WPF Chart - Examples
SciChart WPF ships with hundreds of WPF Chart Examples which you can browse, play with, view the source-code and even export each WPF Chart Example to a stand-alone Visual Studio solution. All of this is possible with the new and improved SciChart WPF Examples Suite, which ships as part of the SciChart WPF SDK.
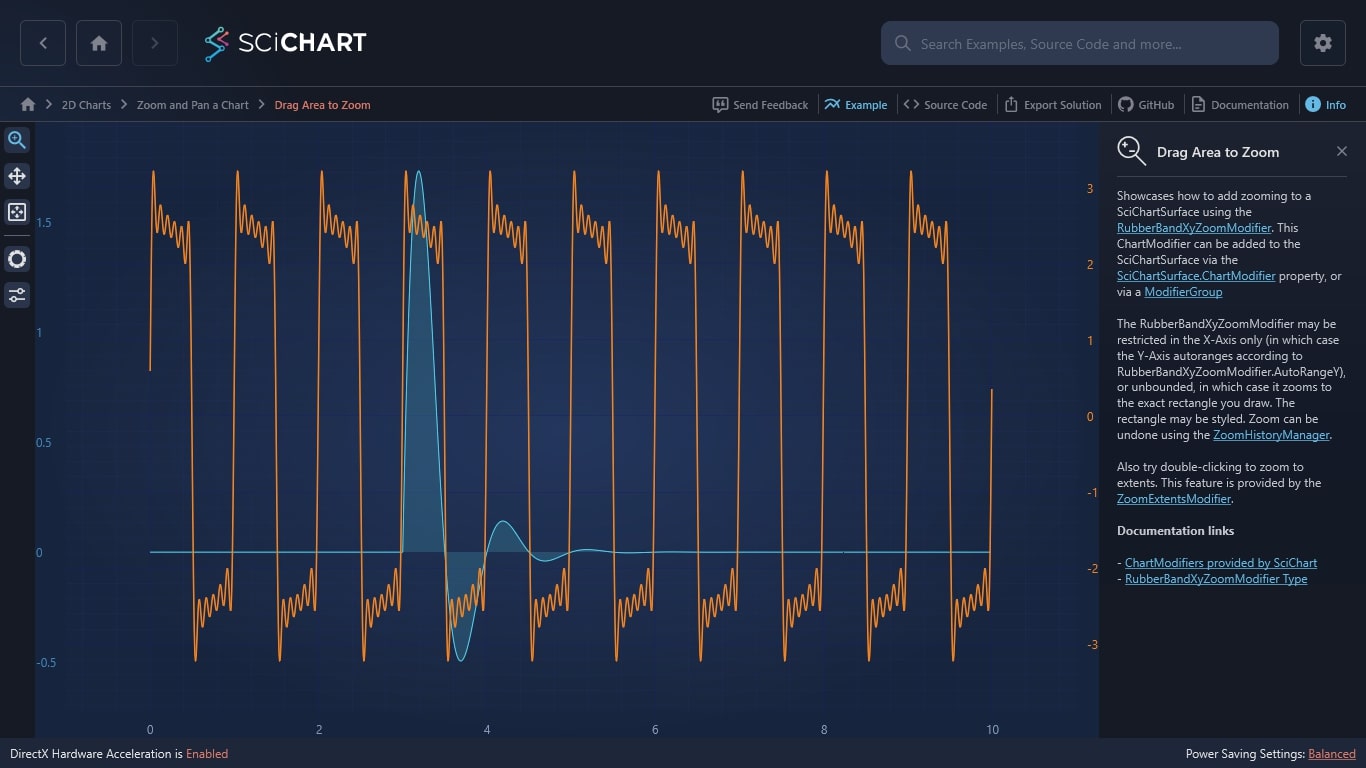
Showcases how to add zooming to a SciChartSurface using the RubberBandXyZoomModifier. This ChartModifier can be added to the SciChartSurface via the SciChartSurface.ChartModifier property, or via a ModifierGroup
The RubberBandXyZoomModifier may be restricted in the X-Axis only (in which case the Y-Axis autoranges according to RubberBandXyZoomModifier.AutoRangeY), or unbounded, in which case it zooms to the exact rectangle you draw. The rectangle may be styled. Zoom can be undone using the ZoomHistoryManager.
Also try double-clicking to zoom to extents. This feature is provided by the ZoomExtentsModifier.
Documentation links
– ChartModifiers provided by SciChart
– RubberBandXyZoomModifier Type

The C#/WPF source code for the WPF Chart Drag Area to Zoom example is included below (Scroll down!).
Did you know you can also view the source code from one of the following sources as well?
- Clone the SciChart.WPF.Examples from Github.
- Or, view source in the SciChart WPF Examples suite.
- Also the SciChart WPF Trial contains the full source for the examples (link below).
