SciChart® the market leader in Fast WPF Charts, WPF 3D Charts, iOS Chart, Android Chart and JavaScript Chart Components
SciChart WPF ships with hundreds of WPF Chart Examples which you can browse, play with, view the source-code and even export each WPF Chart Example to a stand-alone Visual Studio solution. All of this is possible with the new and improved SciChart WPF Examples Suite, which ships as part of the SciChart WPF SDK.
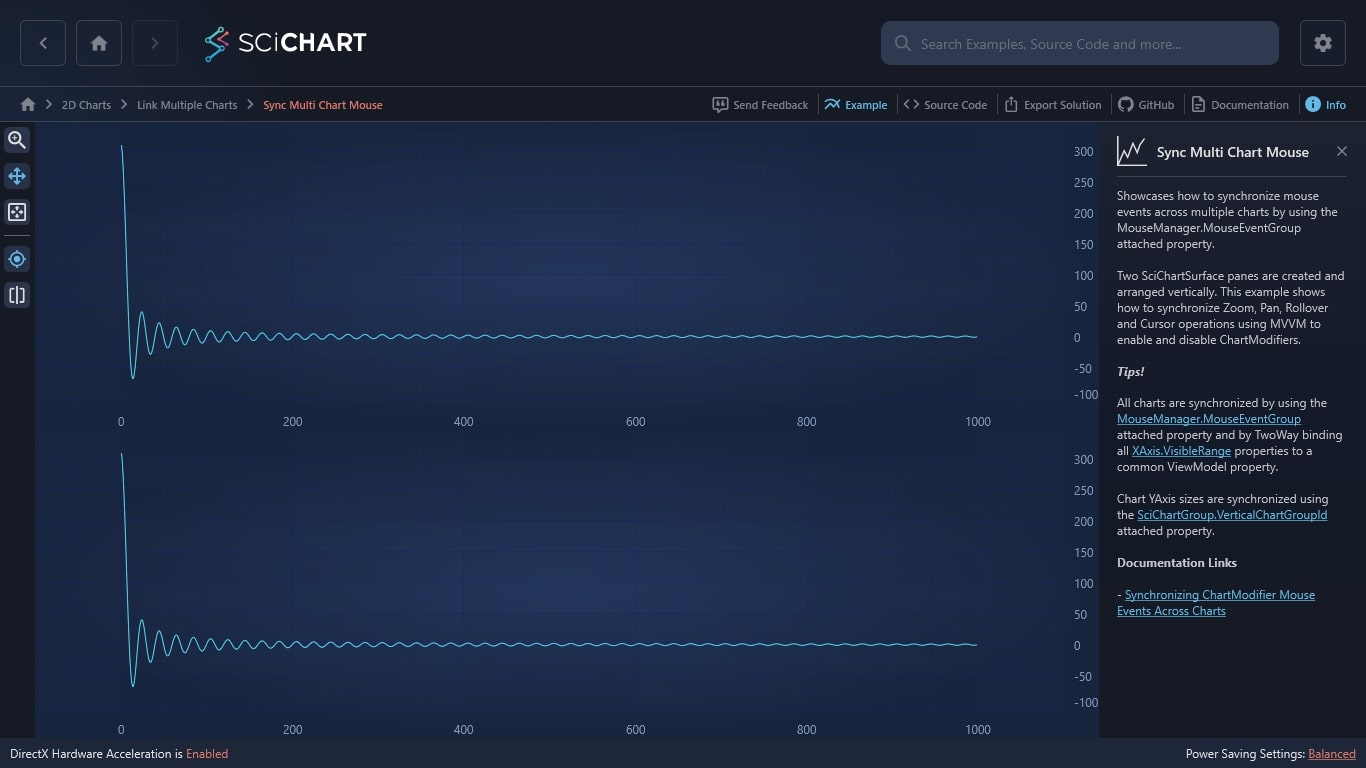
Showcases how to synchronize mouse events across multiple charts by using the MouseManager.MouseEventGroup attached property.
Two SciChartSurface panes are created and arranged vertically. This example shows how to synchronize Zoom, Pan, Rollover and Cursor operations using MVVM to enable and disable ChartModifiers.
Tips!
All charts are synchronized by using the MouseManager.MouseEventGroup attached property and by TwoWay binding all XAxis.VisibleRange properties to a common ViewModel property.
Chart YAxis sizes are synchronized using the SciChartGroup.VerticalChartGroupId attached property.
Documentation Links
The C#/WPF source code for the WPF Chart Sync Multi Chart Mouse Events example is included below (Scroll down!).
Did you know you can also view the source code from one of the following sources as well?
<UserControl x:Class="SciChart.Examples.Examples.ZoomAndPanAChart.SynchronizeMouseAcrossCharts"
xmlns="http://schemas.microsoft.com/winfx/2006/xaml/presentation"
xmlns:x="http://schemas.microsoft.com/winfx/2006/xaml"
xmlns:s="http://schemas.abtsoftware.co.uk/scichart"
xmlns:mc="http://schemas.openxmlformats.org/markup-compatibility/2006"
xmlns:d="http://schemas.microsoft.com/expression/blend/2008"
xmlns:ext="http://schemas.abtsoftware.co.uk/scichart/exampleExternals"
d:DesignHeight="400"
d:DesignWidth="600"
mc:Ignorable="d">
<Grid>
<Grid.ColumnDefinitions>
<ColumnDefinition Width="Auto" />
<ColumnDefinition Width="*" />
</Grid.ColumnDefinitions>
<Grid.RowDefinitions>
<RowDefinition Height="*" />
</Grid.RowDefinitions>
<!-- Define Toolbar -->
<Border Background="#FF232426" BorderThickness="0,0,2,0" BorderBrush="#323539" Grid.RowSpan="2">
<StackPanel Orientation="Vertical">
<ToggleButton Margin="3" x:Name="enableZoom"
Content="Zoom"
HorizontalAlignment="Left"
ToolTipService.ToolTip="Toggle Rubber-Band Zoom"
Style="{StaticResource ZoomButtonStyle}"
IsChecked="{Binding ZoomEnabled, Mode=TwoWay}"
s:ToggleButtonExtensions.GroupName="SyncMultiChartMouseZoomGroup"/>
<ToggleButton Margin="3" x:Name="enablePan"
Content="Pan"
HorizontalAlignment="Left"
ToolTipService.ToolTip="Toggle Zoom-Pan"
IsChecked="{Binding PanEnabled, Mode=TwoWay}"
Style="{StaticResource PanButtonStyle}"
s:ToggleButtonExtensions.GroupName="SyncMultiChartMouseZoomGroup" />
<Button Margin="3"
HorizontalAlignment="Left"
ToolTipService.ToolTip="Zoom to Extents"
Style="{StaticResource ZoomExtentsButtonStyle}"
Click="ZoomExtentsClick"
Content="Zoom Extents" />
<ext:FlyoutSeparator Background="#444"/>
<ToggleButton Margin="3" Style="{StaticResource PointerButtonStyle}"
ToolTipService.ToolTip="Enable CursorModifier"
IsChecked="{Binding CursorEnabled, Mode=TwoWay}"
s:ToggleButtonExtensions.GroupName="SyncMultiChartCursorGroup"/>
<ToggleButton Margin="3" Style="{StaticResource CalloutButtonStyle}"
ToolTipService.ToolTip="Enable RolloverModifier"
IsChecked="{Binding RolloverEnabled, Mode=TwoWay}"
s:ToggleButtonExtensions.GroupName="SyncMultiChartCursorGroup"/>
</StackPanel>
</Border>
<!-- HOW TO SYNCHRONIZE TWO OR MORE CHARTS TOGETHER -->
<!-- -->
<!-- Step 1: You must declare a MouseManager.MouseEventGroup at the root chartmodifier on both charts -->
<!-- This will share the mouse events between the charts -->
<!-- -->
<!-- Step 2: you must bind XAxis.VisibleRange together on the two charts -->
<!-- you can bind three or more charts by binding to a common ViewModel property -->
<!-- -->
<!-- Step 3: You must set attached property SciChartGroup.VerticalChartGroup to synchronize axis sizes -->
<!-- -->
<!-- Be sure to set the ReceiveHandledEvents=True on modifiers which cease to work after sharing mouse events! -->
<!-- Define Chart 0 -->
<s:SciChartSurface x:Name="chart0"
Grid.Row="0"
Grid.Column="1"
s:SciChartGroup.VerticalChartGroup="SyncedChartsSameAxisSizes">
<s:SciChartSurface.RenderableSeries>
<s:FastLineRenderableSeries DataSeries="{Binding ChartData0}" Stroke="#279B27">
<s:FastLineRenderableSeries.SeriesAnimation>
<s:SweepAnimation AnimationDelay="0:0:1" Duration="0:0:3"/>
</s:FastLineRenderableSeries.SeriesAnimation>
</s:FastLineRenderableSeries>
</s:SciChartSurface.RenderableSeries>
<!-- Define X and Y Axis. Optional bands give a cool look and feel for minimal performance impact -->
<s:SciChartSurface.YAxis>
<s:NumericAxis GrowBy="0.1,0.1"
MinorsPerMajor="2"
VisibleRange="0,1" />
</s:SciChartSurface.YAxis>
<s:SciChartSurface.XAxis>
<s:NumericAxis DrawMajorBands="True"
GrowBy="0.1,0.1"
MinorsPerMajor="4"
VisibleRange="{Binding SharedXVisibleRange, Mode=TwoWay}" />
</s:SciChartSurface.XAxis>
<s:SciChartSurface.ChartModifier>
<!-- Whats going on here? -->
<!-- We share the mouse events by using MouseManager.MouseEventGroup="..." -->
<!-- We ensure modifiers receive events even when another has handled by setting ReceiveHandledEvents=true -->
<!-- We bind both charts XAxis to shared property on the viewmodel to ensure they stay in sync -->
<s:ModifierGroup s:MouseManager.MouseEventGroup="myCustomGroup">
<s:RubberBandXyZoomModifier IsEnabled="{Binding ZoomEnabled,
Mode=TwoWay}"
IsXAxisOnly="True"
ReceiveHandledEvents="True" />
<s:ZoomPanModifier IsEnabled="{Binding PanEnabled, Mode=TwoWay}" ReceiveHandledEvents="True" />
<s:MouseWheelZoomModifier />
<s:RolloverModifier IsEnabled="{Binding RolloverEnabled, Mode=TwoWay}" ReceiveHandledEvents="True" />
<s:CursorModifier IsEnabled="{Binding CursorEnabled, Mode=TwoWay}" ReceiveHandledEvents="True" />
<s:YAxisDragModifier Tag="FirstYAxis" />
<s:XAxisDragModifier />
<s:ZoomExtentsModifier />
</s:ModifierGroup>
</s:SciChartSurface.ChartModifier>
</s:SciChartSurface>
<!-- Define Chart 1 -->
<s:SciChartSurface x:Name="chart1"
Grid.Row="1" Grid.Column="1"
s:SciChartGroup.VerticalChartGroup="SyncedChartsSameAxisSizes">
<s:SciChartSurface.RenderableSeries>
<s:FastLineRenderableSeries DataSeries="{Binding ChartData1}" Stroke="#279B27">
<s:FastLineRenderableSeries.SeriesAnimation>
<s:SweepAnimation AnimationDelay="0:0:1" Duration="0:0:3"/>
</s:FastLineRenderableSeries.SeriesAnimation>
</s:FastLineRenderableSeries>
</s:SciChartSurface.RenderableSeries>
<!-- Define X and Y axis. Optional bands give a cool look and feel for minimal performance impact -->
<s:SciChartSurface.YAxis>
<s:NumericAxis GrowBy="0.1,0.1"
MinorsPerMajor="2"
VisibleRange="0,1" />
</s:SciChartSurface.YAxis>
<s:SciChartSurface.XAxis>
<s:NumericAxis DrawMajorBands="True"
GrowBy="0.1,0.1"
MinorsPerMajor="4"
VisibleRange="{Binding SharedXVisibleRange, Mode=TwoWay}" />
</s:SciChartSurface.XAxis>
<s:SciChartSurface.ChartModifier>
<s:ModifierGroup s:MouseManager.MouseEventGroup="myCustomGroup">
<s:RubberBandXyZoomModifier IsEnabled="{Binding ZoomEnabled, Mode=TwoWay}"
IsXAxisOnly="True"
ReceiveHandledEvents="True"
Tag="SecondYAxis" />
<s:ZoomPanModifier IsEnabled="{Binding PanEnabled, Mode=TwoWay}"
ReceiveHandledEvents="True"
Tag="SecondYAxis" />
<s:MouseWheelZoomModifier Tag="SecondYAxis" />
<s:RolloverModifier IsEnabled="{Binding RolloverEnabled, Mode=TwoWay}"
ReceiveHandledEvents="True"
Tag="SecondYAxis" />
<s:CursorModifier IsEnabled="{Binding CursorEnabled, Mode=TwoWay}"
ReceiveHandledEvents="True"
Tag="SecondYAxis" />
<s:YAxisDragModifier Tag="SecondYAxis" />
<s:XAxisDragModifier Tag="SecondYAxis" />
<s:ZoomExtentsModifier Tag="SecondYAxis" />
</s:ModifierGroup>
</s:SciChartSurface.ChartModifier>
</s:SciChartSurface>
</Grid>
</UserControl>
// *************************************************************************************
// SCICHART® Copyright SciChart Ltd. 2011-2022. All rights reserved.
//
// Web: http://www.scichart.com
// Support: support@scichart.com
// Sales: sales@scichart.com
//
// SynchronizeMouseAcrossCharts.xaml.cs is part of the SCICHART® Examples. Permission is hereby granted
// to modify, create derivative works, distribute and publish any part of this source
// code whether for commercial, private or personal use.
//
// The SCICHART® examples are distributed in the hope that they will be useful, but
// without any warranty. It is provided "AS IS" without warranty of any kind, either
// expressed or implied.
// *************************************************************************************
using System;
using System.Windows;
using System.Windows.Controls;
namespace SciChart.Examples.Examples.ZoomAndPanAChart
{
public partial class SynchronizeMouseAcrossCharts : UserControl
{
public SynchronizeMouseAcrossCharts()
{
InitializeComponent();
this.Loaded += MultiChartMouseEvents_Loaded;
}
void MultiChartMouseEvents_Loaded(object sender, RoutedEventArgs e)
{
chart0.AnimateZoomExtents(TimeSpan.FromMilliseconds(1000));
chart1.AnimateZoomExtents(TimeSpan.FromMilliseconds(1000));
}
private void ZoomExtentsClick(object sender, EventArgs e)
{
chart0.AnimateZoomExtents(TimeSpan.FromMilliseconds(500));
chart1.AnimateZoomExtents(TimeSpan.FromMilliseconds(500));
}
}
}
// *************************************************************************************
// SCICHART® Copyright SciChart Ltd. 2011-2022. All rights reserved.
//
// Web: http://www.scichart.com
// Support: support@scichart.com
// Sales: sales@scichart.com
//
// SynchronizeMouseAcrossChartsViewModel.cs is part of the SCICHART® Examples. Permission
// is hereby granted to modify, create derivative works, distribute and publish any part
// of this source code whether for commercial, private or personal use.
//
// The SCICHART® examples are distributed in the hope that they will be useful, but
// without any warranty. It is provided "AS IS" without warranty of any kind, either
// expressed or implied.
// *************************************************************************************
using System;
using SciChart.Charting.Model.DataSeries;
using SciChart.Data.Model;
using SciChart.Examples.ExternalDependencies.Common;
namespace SciChart.Examples.Examples.ZoomAndPanAChart
{
public class SynchronizeMouseAcrossChartsViewModel : BaseViewModel
{
private bool _mouseWheelEnabled;
private bool _panEnabled;
private bool _rolloverEnabled;
private bool _cursorEnabled;
private bool _zoomEnabled;
private IRange _sharedXVisibleRange;
public SynchronizeMouseAcrossChartsViewModel()
{
// Create two DataSeries' which we bind to in the view
ChartData0 = CreateDataSeries();
ChartData1 = CreateDataSeries();
// Set default ChartModifier state
MouseWheelEnabled = false;
PanEnabled = true;
CursorEnabled = true;
// Set shared initial XAxis.VisibleRange.
// Note in code-behind we call sciChartSurface.AnimateZoomExtents(), which requires a
// valid initial range, hence this binding
SharedXVisibleRange = new DoubleRange(0d, 1d);
}
public IDataSeries ChartData0 { get; private set; }
public IDataSeries ChartData1 { get; private set; }
public IRange SharedXVisibleRange
{
get => _sharedXVisibleRange;
set
{
if (_sharedXVisibleRange != value)
{
_sharedXVisibleRange = value;
OnPropertyChanged("SharedXVisibleRange");
}
}
}
public bool MouseWheelEnabled
{
get => _mouseWheelEnabled;
set
{
if (_mouseWheelEnabled != value)
{
_mouseWheelEnabled = value;
OnPropertyChanged("MouseWheelEnabled");
}
}
}
public bool PanEnabled
{
get => _panEnabled;
set
{
if (_panEnabled != value)
{
_panEnabled = value;
OnPropertyChanged("PanEnabled");
ZoomEnabled = !PanEnabled;
}
}
}
public bool ZoomEnabled
{
get => _zoomEnabled;
set
{
if (_zoomEnabled != value)
{
_zoomEnabled = value;
OnPropertyChanged("ZoomEnabled");
PanEnabled = !ZoomEnabled;
}
}
}
public bool CursorEnabled
{
get => _cursorEnabled;
set
{
if (_cursorEnabled != value)
{
_cursorEnabled = value;
OnPropertyChanged("CursorEnabled");
RolloverEnabled = !CursorEnabled;
}
}
}
public bool RolloverEnabled
{
get => _rolloverEnabled;
set
{
if (_rolloverEnabled != value)
{
_rolloverEnabled = value;
OnPropertyChanged("RolloverEnabled");
CursorEnabled = !RolloverEnabled;
}
}
}
private IDataSeries CreateDataSeries()
{
const int count = 1000;
var ds = new UniformXyDataSeries<double>();
for (int i = 0; i < count; i++)
{
ds.Append(count * Math.Sin(Math.Round(i * Math.PI, 3) * 0.1) / i);
}
return ds;
}
}
}