SciChart® the market leader in Fast WPF Charts, WPF 3D Charts, iOS Chart, Android Chart and JavaScript Chart Components
SciChart WPF ships with hundreds of WPF Chart Examples which you can browse, play with, view the source-code and even export each WPF Chart Example to a stand-alone Visual Studio solution. All of this is possible with the new and improved SciChart WPF Examples Suite, which ships as part of the SciChart WPF SDK.
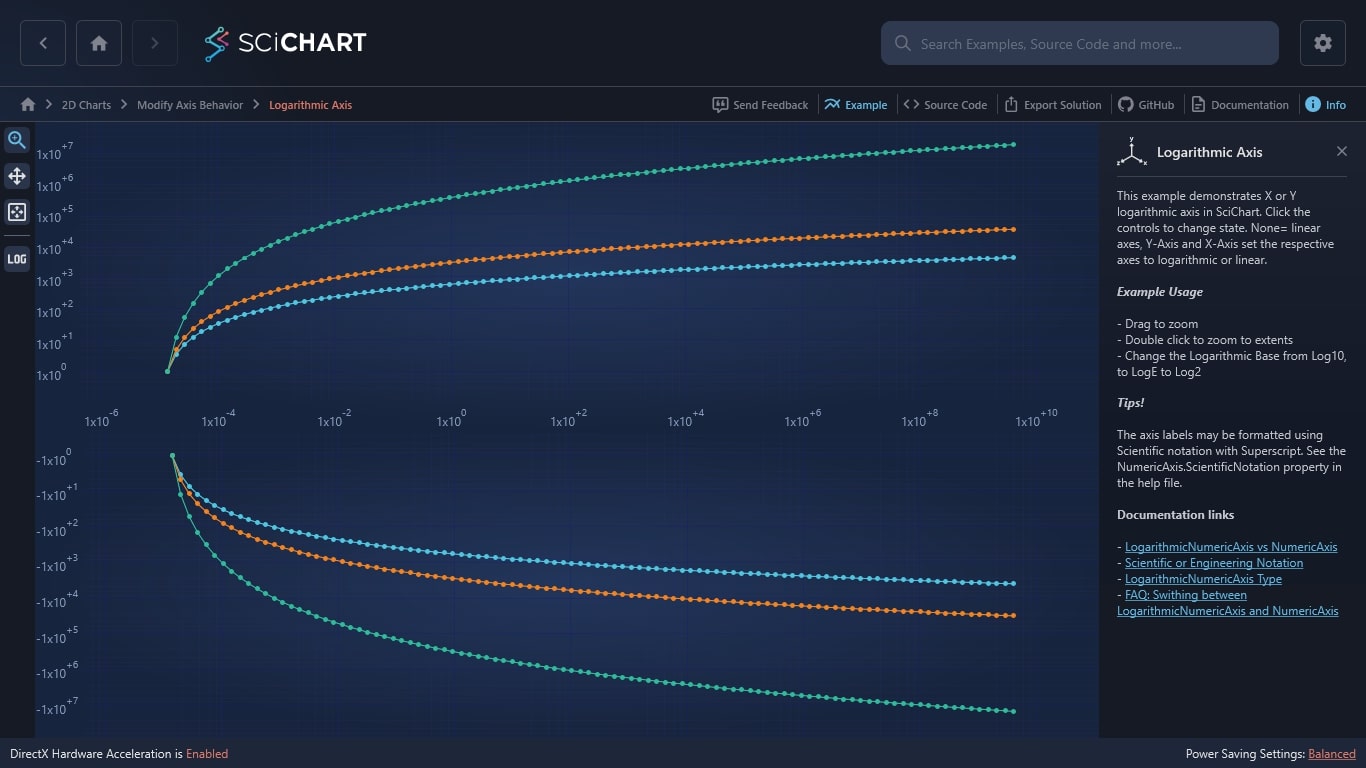
This example demonstrates X or Y logarithmic axis in SciChart. Click the controls to change state. None= linear axes, Y-Axis and X-Axis set the respective axes to logarithmic or linear.
Example Usage
– Drag to zoom
– Double click to zoom to extents
– Change the Logarithmic Base from Log10, to LogE to Log2
Tips!
The axis labels may be formatted using Scientific notation with Superscript. See the NumericAxis.ScientificNotation property in the help file.
Documentation links
– LogarithmicNumericAxis vs NumericAxis
– Scientific or Engineering Notation
– LogarithmicNumericAxis Type
– FAQ: Swithing between LogarithmicNumericAxis and NumericAxis
The C#/WPF source code for the WPF Chart Logarithmic Axis Example example is included below (Scroll down!).
Did you know you can also view the source code from one of the following sources as well?
<UserControl x:Class="SciChart.Examples.Examples.ModifyAxisBehaviour.LogarithmicAxisView"
xmlns="http://schemas.microsoft.com/winfx/2006/xaml/presentation"
xmlns:x="http://schemas.microsoft.com/winfx/2006/xaml"
xmlns:s="http://schemas.abtsoftware.co.uk/scichart"
xmlns:system="clr-namespace:System;assembly=mscorlib"
Loaded="OnLogarithmicAxisViewLoaded"
xmlns:mc="http://schemas.openxmlformats.org/markup-compatibility/2006"
xmlns:d="http://schemas.microsoft.com/expression/blend/2008"
xmlns:ext="http://schemas.abtsoftware.co.uk/scichart/exampleExternals"
d:DesignHeight="400"
d:DesignWidth="600"
mc:Ignorable="d">
<Grid>
<Grid.ColumnDefinitions>
<ColumnDefinition Width="Auto" />
<ColumnDefinition Width="*" />
</Grid.ColumnDefinitions>
<!-- Defines the Toolbar. -->
<!-- It is included for example purposes. -->
<!-- If you wish to know how to zoom and pan a chart then do a search for Zoom Pan in the Examples suite! -->
<Border Background="#FF232426" BorderThickness="0,0,2,0" BorderBrush="#323539" Grid.RowSpan="2" Panel.ZIndex="999">
<StackPanel Orientation="Vertical">
<ToggleButton Margin="3" x:Name="enableZoom"
Content="Zoom"
HorizontalAlignment="Left"
ToolTipService.ToolTip="Toggle Rubber-Band Zoom"
Style="{StaticResource ZoomButtonStyle}"
IsChecked="True"
s:ToggleButtonExtensions.GroupName="SyncMultiChartMouseZoomGroup"/>
<ToggleButton Margin="3" x:Name="enablePan"
Content="Pan"
HorizontalAlignment="Left"
ToolTipService.ToolTip="Toggle Zoom-Pan"
Style="{StaticResource PanButtonStyle}"
s:ToggleButtonExtensions.GroupName="SyncMultiChartMouseZoomGroup" />
<Button Margin="3"
HorizontalAlignment="Left"
ToolTipService.ToolTip="Zoom to Extents"
Style="{StaticResource ZoomExtentsButtonStyle}"
Command="{Binding Source={x:Reference Name=positiveScaleChart}, Path=ZoomExtentsCommand}"
Content="Zoom Extents" />
<ext:FlyoutSeparator Background="#444"/>
<ext:FlyoutMenuButton Style="{StaticResource FlyoutMenuButtonStyle}" Content="LOG" Padding="0">
<ext:FlyoutMenuButton.PopupContent>
<StackPanel Orientation="Vertical" MinWidth="150" Margin="0,0,0,4">
<TextBlock Margin="4" Text="Use Logarithmic on: " />
<CheckBox x:Name="isYLogChbx" Foreground="#999"
Margin="4" IsChecked="True" Checked="OnAxisTypeChanged"
Unchecked="OnAxisTypeChanged" Content="Y-Axis" />
<CheckBox x:Name="isXLogChbx" Foreground="#999"
Margin="4" IsChecked="True" Checked="OnAxisTypeChanged"
Unchecked="OnAxisTypeChanged" Content="X-Axis" />
<ext:FlyoutSeparator/>
<TextBlock Margin="4" Text="Logarithmic base: " />
<ComboBox x:Name="logBasesChbx" VerticalAlignment="Center" Margin="4" SelectedIndex="2">
<system:String>2</system:String>
<system:String>5</system:String>
<system:String>10</system:String>
<system:String>E</system:String>
</ComboBox>
</StackPanel>
</ext:FlyoutMenuButton.PopupContent>
</ext:FlyoutMenuButton>
</StackPanel>
</Border>
<!-- Declare two SciChartSurfaces -->
<!-- Because in this example we are dynamically changing axis type from Linear to Logarithmic, -->
<!-- The axes for both charts are set in code behind. -->
<!-- In reality, if you wanted just a Logarithmic chart, please use type LogarithmicNumericAxis -->
<Grid Grid.Column="1">
<Grid.Resources>
<Style x:Key="LineSeriesStyle" x:Shared="False" TargetType="s:FastLineRenderableSeries">
<Setter Property="PointMarker">
<Setter.Value>
<s:EllipsePointMarker Width="5" Height="5" Fill="{Binding Stroke}"/>
</Setter.Value>
</Setter>
</Style>
<s:ModifierGroup x:Key="ModifierGroup" x:Shared="False" MouseEventGroup="SharedMouseEvents">
<s:RubberBandXyZoomModifier IsEnabled="{Binding Source={x:Reference Name=enableZoom}, Path=IsChecked}" IsXAxisOnly="True" ZoomExtentsY="True" />
<s:ZoomPanModifier IsEnabled="{Binding Source={x:Reference Name=enablePan}, Path=IsChecked}" ClipModeX="None" />
<s:MouseWheelZoomModifier />
<s:ZoomExtentsModifier />
</s:ModifierGroup>
</Grid.Resources>
<Grid.RowDefinitions>
<RowDefinition />
<RowDefinition />
</Grid.RowDefinitions>
<s:SciChartSurface x:Name="positiveScaleChart"
Grid.Row="0"
ChartModifier="{StaticResource ModifierGroup}">
<s:SciChartSurface.RenderableSeries>
<s:FastLineRenderableSeries Stroke="#279B27" Style="{StaticResource LineSeriesStyle}">
<s:FastLineRenderableSeries.SeriesAnimation>
<s:SweepAnimation AnimationDelay="0:0:1" Duration="0:0:3" ZeroLine="1000000"/>
</s:FastLineRenderableSeries.SeriesAnimation>
</s:FastLineRenderableSeries>
<s:FastLineRenderableSeries Stroke="#FF1919" Style="{StaticResource LineSeriesStyle}">
<s:FastLineRenderableSeries.SeriesAnimation>
<s:SweepAnimation AnimationDelay="0:0:1" Duration="0:0:3" ZeroLine="1000000"/>
</s:FastLineRenderableSeries.SeriesAnimation>
</s:FastLineRenderableSeries>
<s:FastLineRenderableSeries Stroke="#1964FF" Style="{StaticResource LineSeriesStyle}">
<s:FastLineRenderableSeries.SeriesAnimation>
<s:SweepAnimation AnimationDelay="0:0:1" Duration="0:0:3" ZeroLine="1000000"/>
</s:FastLineRenderableSeries.SeriesAnimation>
</s:FastLineRenderableSeries>
</s:SciChartSurface.RenderableSeries>
</s:SciChartSurface>
<s:SciChartSurface x:Name="negativeScaleChart"
Grid.Row="1"
ChartModifier="{StaticResource ModifierGroup}">
<s:SciChartSurface.RenderableSeries>
<s:FastLineRenderableSeries Stroke="#279B27" Style="{StaticResource LineSeriesStyle}">
<s:FastLineRenderableSeries.SeriesAnimation>
<s:SweepAnimation AnimationDelay="0:0:1" Duration="0:0:3" ZeroLine="-1000000"/>
</s:FastLineRenderableSeries.SeriesAnimation>
</s:FastLineRenderableSeries>
<s:FastLineRenderableSeries Stroke="#FF1919" Style="{StaticResource LineSeriesStyle}">
<s:FastLineRenderableSeries.SeriesAnimation>
<s:SweepAnimation AnimationDelay="0:0:1" Duration="0:0:3" ZeroLine="-1000000"/>
</s:FastLineRenderableSeries.SeriesAnimation>
</s:FastLineRenderableSeries>
<s:FastLineRenderableSeries Stroke="#1964FF" Style="{StaticResource LineSeriesStyle}">
<s:FastLineRenderableSeries.SeriesAnimation>
<s:SweepAnimation AnimationDelay="0:0:1" Duration="0:0:3" ZeroLine="-1000000"/>
</s:FastLineRenderableSeries.SeriesAnimation>
</s:FastLineRenderableSeries>
</s:SciChartSurface.RenderableSeries>
</s:SciChartSurface>
</Grid>
</Grid>
</UserControl>
// *************************************************************************************
// SCICHART® Copyright SciChart Ltd. 2011-2022. All rights reserved.
//
// Web: http://www.scichart.com
// Support: support@scichart.com
// Sales: sales@scichart.com
//
// LogarithmicAxisView.xaml.cs is part of the SCICHART® Examples. Permission is hereby granted
// to modify, create derivative works, distribute and publish any part of this source
// code whether for commercial, private or personal use.
//
// The SCICHART® examples are distributed in the hope that they will be useful, but
// without any warranty. It is provided "AS IS" without warranty of any kind, either
// expressed or implied.
// *************************************************************************************
using System;
using System.ComponentModel;
using System.Globalization;
using System.Linq;
using System.Windows;
using System.Windows.Controls;
using System.Windows.Data;
using SciChart.Charting;
using SciChart.Charting.Model.DataSeries;
using SciChart.Charting.Visuals.Axes;
using SciChart.Charting.Visuals.Axes.LogarithmicAxis;
using SciChart.Data.Model;
using SciChart.Examples.ExternalDependencies.Data;
namespace SciChart.Examples.Examples.ModifyAxisBehaviour
{
public partial class LogarithmicAxisView : UserControl, INotifyPropertyChanged
{
public event PropertyChangedEventHandler PropertyChanged;
private static readonly TimeSpan duration = TimeSpan.FromMilliseconds(500);
public LogarithmicAxisView()
{
InitializeComponent();
}
private void OnLogarithmicAxisViewLoaded(object sender, RoutedEventArgs e)
{
// Create some DataSeries of type X=double, Y=double
var posDataSeries0 = new XyDataSeries<double, double>();
var posDataSeries1 = new XyDataSeries<double, double>();
var posDataSeries2 = new XyDataSeries<double, double>();
var negDataSeries0 = new XyDataSeries<double, double>();
var negDataSeries1 = new XyDataSeries<double, double>();
var negDataSeries2 = new XyDataSeries<double, double>();
var data1 = DataManager.Instance.GetExponentialCurve(1.8, 100);
var data2 = DataManager.Instance.GetExponentialCurve(2.25, 100);
var data3 = DataManager.Instance.GetExponentialCurve(3.59, 100);
// Append data to series
posDataSeries0.Append(data1.XData, data1.YData);
posDataSeries1.Append(data2.XData, data2.YData);
posDataSeries2.Append(data3.XData, data3.YData);
negDataSeries0.Append(data1.XData, data1.YData.Select(y => -y));
negDataSeries1.Append(data2.XData, data2.YData.Select(y => -y));
negDataSeries2.Append(data3.XData, data3.YData.Select(y => -y));
// Attach DataSeries to RendetableSeries
positiveScaleChart.RenderableSeries[0].DataSeries = posDataSeries0;
positiveScaleChart.RenderableSeries[1].DataSeries = posDataSeries1;
positiveScaleChart.RenderableSeries[2].DataSeries = posDataSeries2;
negativeScaleChart.RenderableSeries[0].DataSeries = negDataSeries0;
negativeScaleChart.RenderableSeries[1].DataSeries = negDataSeries1;
negativeScaleChart.RenderableSeries[2].DataSeries = negDataSeries2;
// Set X,Y axes
OnAxisTypeChanged(null, null);
// Zoom both charts to the data extents
positiveScaleChart.AnimateZoomExtents(duration);
negativeScaleChart.AnimateZoomExtents(duration);
}
private void OnAxisTypeChanged(object sender, RoutedEventArgs e)
{
var isYLog = isYLogChbx != null && isYLogChbx.IsChecked.HasValue && isYLogChbx.IsChecked.Value;
var isXLog = isXLogChbx != null && isXLogChbx.IsChecked.HasValue && isXLogChbx.IsChecked.Value;
var positiveChartXAxis = isXLog ? GenerateLogarithmicAxis(AxisAlignment.Bottom, false) : GenerateLinearAxis(AxisAlignment.Bottom);
var positiveChartYAxis = isYLog ? GenerateLogarithmicAxis(AxisAlignment.Left, false) : GenerateLinearAxis(AxisAlignment.Left);
if (positiveScaleChart != null)
{
// Set X,Y axes
positiveScaleChart.YAxis = positiveChartYAxis;
positiveScaleChart.XAxis = positiveChartXAxis;
positiveScaleChart.ZoomExtents();
}
if (negativeScaleChart != null)
{
// Set X,Y axes
negativeScaleChart.YAxis = isYLog ? GenerateLogarithmicAxis(AxisAlignment.Left, true) : GenerateLinearAxis(AxisAlignment.Left);
negativeScaleChart.XAxis = isXLog ? GenerateLogarithmicAxis(AxisAlignment.Bottom, false) : GenerateLinearAxis(AxisAlignment.Bottom);
// Hide the bottom XAxis
negativeScaleChart.XAxis.Visibility = Visibility.Collapsed;
// Bind the bottom chart XAxis to the top chart XAxis
var xVisibleRangeBinding = new Binding("VisibleRange")
{
Source = positiveChartXAxis,
Mode = BindingMode.TwoWay
};
((AxisBase)negativeScaleChart.XAxis).SetBinding(AxisBase.VisibleRangeProperty, xVisibleRangeBinding);
// Bind the bottom chart YAxis to the top chart YAxis
var yVisibleRangeBinding = new Binding("VisibleRange")
{
Source = positiveChartYAxis,
Mode = BindingMode.TwoWay,
Converter = new ReverseYRangeConverter()
};
((AxisBase)negativeScaleChart.YAxis).SetBinding(AxisBase.VisibleRangeProperty, yVisibleRangeBinding);
negativeScaleChart.ZoomExtents();
}
}
private IAxis GenerateLinearAxis(AxisAlignment axisAlignment)
{
return new NumericAxis
{
AxisAlignment = axisAlignment,
TextFormatting = "#.#E+0",
ScientificNotation = ScientificNotation.Normalized,
GrowBy = new DoubleRange(0.1, 0.1),
DrawMajorBands = false
};
}
private IAxis GenerateLogarithmicAxis(AxisAlignment axisAlignment, bool withNegativeScale)
{
var axis = withNegativeScale ? new NegativeLogarithmicAxis() : new LogarithmicNumericAxis();
axis.AxisAlignment = axisAlignment;
axis.TextFormatting = "#.#E+0";
axis.ScientificNotation = ScientificNotation.LogarithmicBase;
axis.GrowBy = new DoubleRange(0.1, 0.1);
axis.DrawMajorBands = false;
var converter = new LogarithmicBaseConverter();
var logBinding = new Binding("SelectedValue") { ElementName = "logBasesChbx", Converter = converter };
axis.SetBinding(LogarithmicNumericAxis.LogarithmicBaseProperty, logBinding);
return axis;
}
protected virtual void OnPropertyChanged(string propertyName)
{
var handler = PropertyChanged;
if (handler != null) handler(this, new PropertyChangedEventArgs(propertyName));
}
}
public class LogarithmicBaseConverter : IValueConverter
{
public object Convert(object value, Type targetType, object parameter, CultureInfo culture)
{
var str = (string)value;
var result = str.ToUpperInvariant().Equals("E") ? Math.E : Double.Parse(str, CultureInfo.InvariantCulture);
return result;
}
public object ConvertBack(object value, Type targetType, object parameter, CultureInfo culture)
{
throw new NotImplementedException();
}
}
public class ReverseYRangeConverter : IValueConverter
{
public object Convert(object value, Type targetType, object parameter, CultureInfo culture)
{
DoubleRange negativeRange = null;
if (value != null)
{
var positiveRange = (DoubleRange) value;
negativeRange = new DoubleRange(-positiveRange.Max, -positiveRange.Min);
}
return negativeRange;
}
public object ConvertBack(object value, Type targetType, object parameter, CultureInfo culture)
{
DoubleRange positiveRange = null;
if (value != null)
{
var negativeRange = (DoubleRange) value;
positiveRange = new DoubleRange(-negativeRange.Min, -negativeRange.Max);
}
return positiveRange;
}
}
}