Hello,
I have several simple SciChartSurfaces in my WPF-grid. They are in the same WPF-column but in different WPF-rows, so they are arranged in a vertical manner.
I have noticed that the Y-Axis (a NumericAxis-objcet) moves automatically slightly to the left to make room for the numbers on the Y-Axis, if necessary.
I would like to ask if there is a way to “synchronize” the position of several similar Charts (or their Y-Axis´s, respectively.), so the different Y-Axis´s would always be in the same position. Ideally, the Y-Axis´s of all the Charts would move as far to the left as necessary to make room for the longest number of all the Axis´s.
I have attached an example of my current situation and the solution I would ideally like to achieve.
Is there any way to “connect” the different Axis of the charts to create the desired result?
Thank you.
- Marc Vahldieck asked 1 year ago
- last active 11 months ago
The console prints an exception when I zoom in and out with the mouse wheel:
SciChartSurface didn’t render, because an exception was thrown:
Message: Arrays yValues and indexes must have the same length
Stack Trace: at swb.iwb(Int32 bij, String bik, Int32 bil, String bim)
at SciChart.Data.Model.UniformXyPointSeries..ctor(Double xStart, Double xStep, Values1 yValues, Values1 indexes)
at SciChart.Charting.Visuals.RenderableSeries.DrawingProviders.PointMarkerDrawingProvider1.OnDraw(IRenderContext2D renderContext, IRenderPassData renderPassData)1 enumerable, Action`1 operation)
at SciChart.Core.Extensions.EnumerableExtensions.ForEachDo[T](IEnumerable
at SciChart.Charting.Visuals.RenderableSeries.BaseRenderableSeries.InternalDraw(IRenderContext2D renderContext, IRenderPassData renderPassData)
at SciChart.Charting.Visuals.RenderableSeries.BaseRenderableSeries.SciChart.Charting.Visuals.IDrawable.OnDraw(IRenderContext2D renderContext, IRenderPassData renderPassData)
at ebu.toj(RenderPassInfo gj, IRenderContext2D gk, Int32 gl)
at ebu.toi(ISciChartSurface gg, RenderPassInfo gh, IRenderContext2D gi)
at ebu.RenderLoop(IRenderContext2D renderContext)
at SciChart.Charting.Visuals.SciChartSurface.DoDrawingLoop()
Here is a simple example program uploaded.
- hundun wds asked 1 year ago
- last active 1 year ago
I was having some issues with 2 of the chart modifiers for a SciChart3DSurface. The FreeLookModifier3D used to work as intended, but now non of the key presses work. However, the “ExecuteOn” middle mouse button does free look the camera, I just can’t move the camera forwards and backwards with the ‘w’ ‘a’ ‘s’ ‘d’ ‘c’ or ‘e’ keys. In short, I figured it was something I did since I’m messing with the keyboard, but I haven’t been able to pin down the problem. Then, the VertexSelectionModifier stopped working as intended. It seems as if it’s successfully attached to the surface, but it fails to select any points. This previously worked, and stopped moving around the time when I moved SQL databases, oddly enough. I’ve uploaded a short video to Google Drive (https://drive.google.com/file/d/1y_C7XUU3mMPJ4h4m6LpFKVwZELtEUup3/view?usp=sharing) that demonstrates that the selection box appears when I hold down the left mouse button. What might be causing the chart modifiers to misbehave.
- Will Wright asked 1 year ago
How to modify the official sample program: DigitalAnalyzerPerformanceDemo,
Implement [MouseWheel] to scroll up and down the channel, [CTRL + MouseWheel] to enlarge and narrow the channel data?
I found that [CTRL + MouseWheel] is used by default to shift the Y-axis up and down.
Example program RUL:https://github.com/ABTSoftware/SciChart.Wpf.Examples/tree/master/Sandbox/CustomerExamples/DigitalAnalyzerPerformanceDemo
- hundun wds asked 1 year ago
- last active 1 year ago
I would like to modify the XYZ Gizmo in XAML, but I can’t figure out how. What would this code look like?
- Will Wright asked 1 year ago
- last active 1 year ago
I’m encountering some odd behaviour when I rescale my graph to modify the range of the X axis. For certain data series, the line disappears from the chart.
e.g. I have a data series that’s 2899 points long, with X values ranging from -6.17 to 22.81, so I change my X axis range to be from -8 to 24 to fit it all in. When I change the VisibleRange of the SciChartSurface.XAxis, then the line disappears. If I don’t rescale the visible range then the portion that would be visible is rendered fine.
The funny thing about it is, if I remove the last point from the series before adding to the chart, it draws fine, even after I rescale the visible range! The same goes for if I add another point to the end (e.g. even if that point is identical to the existing last point).
Now if I hover the mouse (Rollover) over the chart, the spot to highlight the point in the line still appears as if the graph was still there. It’s like it’s there but invisible.
I’ve tried setting DebugWhyDoesntSciChartRender to true, but this fires only when the chart is initially drawn and no series’ have been added yet, so I get
SciChartSurface didn’t render, RendererErrorCode: [RendererErrorCode: [Because the SciChartSurface.RenderableSeries collection is null or empty. Please ensure that you have set some RenderableSeries with RenderableSeries.DataSeries assigned, or you have set Axis.VisibleRange for all axes in order to view a blank chart.]
RendererErrorCode: [Because none of the SciChartSurface.RenderableSeries has a DataSeries assigned]
However I add the DataSeries’ after this, and when I do that, or rescale the axis, no error is reported.
Here is my XAML code to show the chart:
<s:SciChartSurface
        x:Name="SciChart"
        Grid.Column="0"
        Annotations="{Binding Annotations}"
        DebugWhyDoesntSciChartRender="True"
        GridLinesPanelStyle="{StaticResource GridLinesPanelStyle}"
        RenderableSeries="{s:SeriesBinding ChartSeries}"
        Style="{StaticResource SurfaceStyle}">

        <s:SciChartSurface.RenderSurface>
            <s:HighQualityRenderSurface />
        </s:SciChartSurface.RenderSurface>

        <s:SciChartSurface.XAxis>
            <s:NumericAxis
                AutoRange="Never"
                AutoTicks="False"
                AxisTitle="{Binding XAxis.Label}"
                DrawLabels="{Binding XAxis.ShowLabels}"
                DrawMajorGridLines="{Binding XAxis.MajorGridLines}"
                DrawMinorGridLines="{Binding XAxis.MinorGridLines}"
                DrawMinorTicks="True"
                LabelProvider="{Binding XAxisLabels}"
                MajorDelta="{Binding XAxis.MajorDelta}"
                MinorDelta="{Binding XAxis.MinorDelta}"
                Style="{StaticResource XAxisStyle}"
                TextFormatting="0.##"
                TickLabelStyle="{StaticResource XAxisLabelStyle}"
                TitleStyle="{StaticResource AxisTitleStyle}"
                VisibleRange="{Binding XAxis.DisplayRange.Value}" />
        </s:SciChartSurface.XAxis>

        <s:SciChartSurface.YAxis>
            <s:NumericAxis
                AutoRange="Never"
                AutoTicks="False"
                AxisAlignment="Left"
                AxisTitle="{Binding YAxis.Label}"
                DrawLabels="{Binding YAxis.ShowLabels}"
                DrawMajorGridLines="{Binding YAxis.MajorGridLines}"
                DrawMinorGridLines="{Binding YAxis.MinorGridLines}"
                DrawMinorTicks="True"
                MajorDelta="{Binding YAxis.MajorDelta}"
                MinorDelta="{Binding YAxis.MinorDelta}"
                LabelProvider="{Binding YAxisLabels}"
                Style="{StaticResource YAxisStyle}"
                TextFormatting="0.##"
                TickLabelStyle="{StaticResource AxisLabelStyle}"
                TitleStyle="{StaticResource AxisTitleStyle}"
                VisibleRange="{Binding YAxis.DisplayRange.Value}" />
        </s:SciChartSurface.YAxis>

        <s:SciChartSurface.ChartModifier>
            <s:ModifierGroup>
                <s:LegendModifier
                    x:Name="LegendModifier"
                    Margin="10"
                    HorizontalAlignment="Right"
                    GetLegendDataFor="AllSeries"
                    LegendTemplate="{StaticResource LegendTemplate}"
                    Orientation="Horizontal"
                    ShowLegend="{Binding ShowLegend}"
                    ShowVisibilityCheckboxes="False" />
                <s:RolloverModifier ShowAxisLabels="False">
                    <s:RolloverModifier.LineOverlayStyle>
                        <Style TargetType="Line">
                            <Setter Property="Stroke" Value="{StaticResource VitalCyanBrush}"/>
                            <Setter Property="StrokeThickness" Value="16"/>
                            <Setter Property="Opacity" Value=".2"/>
                            <Setter Property="IsHitTestVisible" Value="False"/>
                            <Setter Property="UseLayoutRounding" Value="True"/>
                        </Style>
                    </s:RolloverModifier.LineOverlayStyle>
                </s:RolloverModifier>
                <s:SeriesSelectionModifier>
                    <s:SeriesSelectionModifier.SelectedSeriesStyle>
                        <!--  When a series is selected (on click), apply this style  -->
                        <Style TargetType="s:BaseRenderableSeries">
                            <Setter Property="Stroke" Value="DeepPink" />
                            <Setter Property="StrokeThickness" Value="3" />
                        </Style>
                    </s:SeriesSelectionModifier.SelectedSeriesStyle>
                </s:SeriesSelectionModifier>
            </s:ModifierGroup>

        </s:SciChartSurface.ChartModifier>
    </s:SciChartSurface>
and here is the code to change the Axis visible range. (In the ViewModel). Note that while this changes both the X Axis and the Y Axis scale, only the X Axis change causes this problem.
        protected override void ScaleAxes(double xaxisLowerValue, double xaxisUpperValue, double yaxisLowerValue, double yaxisUpperValue)
    {
        var xAxisRange = new AxisRange(0, 0);
        var yAxisRange = new AxisRange(0, 0);

        //Resolve time axis
        yAxisRange.MaxValue = CalculateUpperBoundary(yaxisUpperValue, (double)_graphIndicators.BarChartMaxIndicator, YAxis.UpperPadding, YAxis.MajorDelta);
        yAxisRange.MinValue = CalculateLowerBoundary(yaxisLowerValue, (double)_graphIndicators.BarChartMinIndicator, YAxis.LowerPadding, YAxis.MajorDelta);

        //Resolve Volume Axis
        xAxisRange.MaxValue = CalculateUpperBoundary(xaxisUpperValue, xaxisUpperValue, XAxis.UpperPadding, XAxis.MajorDelta);
        xAxisRange.MinValue = CalculateLowerBoundary(xaxisLowerValue, xaxisLowerValue, XAxis.LowerPadding, XAxis.MajorDelta);

        //ensure max and min range have not exceeded the boundary range.
        xAxisRange = EnsureRangeIsWithinBounds(ref xAxisRange, XAxis.BoundingRange);
        yAxisRange = EnsureRangeIsWithinBounds(ref yAxisRange, YAxis.BoundingRange);

        //ensure max and min range are within optimal range.
        xAxisRange = EnsureRangeIsWithinOptimal(ref xAxisRange, XAxis.OptimalRange);
        yAxisRange = EnsureRangeIsWithinOptimal(ref yAxisRange, YAxis.OptimalRange);

        //update the display range
        XAxis.DisplayRange = xAxisRange;
        YAxis.DisplayRange = yAxisRange;
    }
- Colm de Cleir asked 1 year ago
Hi Scichart Team,
I want to add two border lines on the top and left of the chart on the existing theme —“BrightSpark”, I searched and tried some IThemeProvider memebers but have no luck to solve it.
Please find the detail in attached pic, just like bottom and right sides, add two border lines on the other two sides.
- Keyu Yan asked 1 year ago
- last active 1 year ago
Hello Scichart Team,
Can you guys provide me with some guidance to implement a custom IRenderableSeriesViewModel implementation that is supported in MVVM binding in Scichartsurface? Specifically, I’m looking to create a chart series that can be bound to my ViewModel and support custom styling and data handling.
I have tried following the tutorial found here…
Worked Example – CustomRenderableSeries in MVVM
https://www.scichart.com/documentation/win/current/webframe.html#Worked%20Example%20-%20CustomRenderableSeries%20in%20MVVM.html
I was getting a cast error from scicharts. I have attached the picture showing the detailed error.
Concerning the XAML code I have tried both the normal Binding keyword and s:SeriesBinding keyword to the RenderableSeries in the SciChartSurface.
Let me know how to go about this!
- Arjun Sivaprasadam asked 1 year ago
- last active 1 year ago
Hello,
i’m using the spline filter with the ToSpline method.
The problem I have with this is that the method returns a different type.
I want to apply the filter to my XyDataSeries<long, double>. However, the returned value is of type XyDataSeries<double, double>.
Is there a way to apply the filter and have a XyDataSeries<long, double>?
- Martin Schlidt asked 1 year ago
- last active 1 year ago
What properties should I change to change the position of the information in the bottom left of the chart?
- JONGBOG JOUNG asked 1 year ago
- last active 1 year ago
I had great success using ObjectModel3D objects in my XAML file. However, I would like to dynamically add and remove objects based on user input. For this reason, I’ve switched to using codebehind.
private void PopulateScene()
      {
          List<Uri> bitmapImages = DataProcessor.bitmapImages();
          Uri textureSource = new Uri(@"C:\Users\Will\Desktop\lemon_yellow__85006.webp");

          var rotation = new Rotation3D()
          {
              Angle = 45,
              Axis = SciChart.Charting3D.Axis.Axis3D.YAxis
          };

          foreach(Uri bitmapImage in bitmapImages)
          {
              ObjectModel3D objectModel = new ObjectModel3D()
              {
                  TextureSource = new TextureSource(textureSource),
                  Source = new ObjectModelSource(new Uri(@"C:\Users\Will\Desktop\EarthTile.obj")),
                  Position = new Vector3(1, 0, 1),
                  CoordinateMode = ObjectCoordinateMode.Relative,
                  Scale = new Vector3(2, 1, 1),
                  Rotation = rotation
              };

              using (sciChart.SuspendUpdates())
              {
                  sciChart.SceneObjects.Add(objectModel);
              }
          }
      }
I get the correct model with the correct texture. However, setting the position, scale or rotation doesn’t seem to work. All objects are in the same place ((0, 0, 0), no matter the coordinate mode), at the same (1, ,1 ,1) scale, and facing the same direction. How
I also have this function;
private void ClearScene()
{
using (sciChart.SuspendUpdates())
{
sciChart.SceneObjects.Clear();
}
}
Even after the object is cleared from SceneObjects, it persists in the chart.
This leads me to my 2 questions;
- How do I get the objects I add to the chart to observe the
transformational parameters I give it? I don’t need to change the
parameters of objects after they’ve been added to the scene, just
before. - How do I remove objects from a scene?
- Will Wright asked 1 year ago
- last active 1 year ago
Hi, I want to rotate an ObjectModel3D with multiple axis of rotation.
But Rotation property of ObjectModel3D can set only one axis (X or Y or Z).
How can I solve this problem?
Thanks
- JONGBOG JOUNG asked 1 year ago
- last active 12 months ago
We currently own an older version of SCiCHART (5.2.1.11757). The question I have was posted 5 years ago at:
https://www.scichart.com/questions/wpf/change-verticalslicemodifier-value-labels-position
Is this answer still the correct answer or is this now possible via an API call or xaml option with a newer release?
Best
- Rick Shaw asked 1 year ago
- last active 1 year ago
below is my source code.
Only Changed style.
result is different.
the Yaxis Value is different.
Please Someone help me..
call
ExportToStream(SciChart.Core.ExportType.Png, true)
protected override SciChartSurfaceBase CreateCloneOfSurfaceInMemory(System.Windows.Size newSize)
{
        var cloned = (SciChartSurface)base.CreateCloneOfSurfaceInMemory(newSize);
        if (cloned is BaseChart2DSurface specCloned)
        {
            if(cloned.XAxis is NumericAxis numXaxis)
                numXaxis.Style = (Style)Application.Current.Resources["xAxis-Export-Style"];

            cloned.XAxis.TickLabelStyle = (Style)Application.Current.Resources["BaseTickLabel-Export-Style"];
            cloned.XAxis.MajorGridLineStyle = (Style)Application.Current.Resources["BaseAxis-Export-GridLineStyle"];
            cloned.XAxis.MajorTickLineStyle = (Style)Application.Current.Resources["BaseAxis-Export-GridLineStyle"];
            cloned.XAxis.MinorGridLineStyle = (Style)Application.Current.Resources["BaseAxis-Export-GridLineStyle"];
            cloned.XAxis.MinorTickLineStyle = (Style)Application.Current.Resources["BaseAxis-Export-GridLineStyle"];

            cloned.XAxis.TickTextBrush = System.Windows.Media.Brushes.Black;

            if (cloned.YAxis is NumericAxis numYaxis)
                numYaxis.Style = (Style)Application.Current.Resources["yAxis-Export-Style"];

            cloned.YAxis.TickLabelStyle = (Style)Application.Current.Resources["YAxis-Export-TickLabelStyle"];
            cloned.YAxis.MajorGridLineStyle = (Style)Application.Current.Resources["BaseAxis-Export-GridLineStyle"];
            cloned.YAxis.MajorTickLineStyle = (Style)Application.Current.Resources["BaseAxis-Export-GridLineStyle"];
            cloned.YAxis.MinorGridLineStyle = (Style)Application.Current.Resources["BaseAxis-Export-GridLineStyle"];
            cloned.YAxis.MinorTickLineStyle = (Style)Application.Current.Resources["BaseAxis-Export-GridLineStyle"];

            cloned.YAxis.TickTextBrush = System.Windows.Media.Brushes.Black;
            cloned.Background = System.Windows.Media.Brushes.Transparent;
        }
        return cloned;
    }
- SSW PS asked 1 year ago
Hello!
I have a problem with disappearing points on refresh.
I have a measuring process in progress, so my new data coming continously. When the next data is added to my collection, it refreshes the whole graph (Clear, then re-add every point). Sometimes (sporadically) it happens, that some of my points are invisible, but after something changes (new point is added/zooming in the chart etc…) everything is back to normal again.
I have attached a gif, where I have all my 100 points arrived, but only 29 is visible. I need visible points every time.
(I am using ObservableCollection, when CollectionChanged is triggered, I clear my XyDataSeries and add every element from my collection.)
Could you please give me some hint?
Thank you!
- László Jancsó asked 1 year ago
I created an ObjectModel3D object in ViewModel and bound it to View, but the Scale and Position values are not applicable.
What’s wrong with my code?
View:
<UserControl x:Class="Example.TestChart.Views.TestChartView"
         xmlns="http://schemas.microsoft.com/winfx/2006/xaml/presentation"
         xmlns:x="http://schemas.microsoft.com/winfx/2006/xaml"
         xmlns:mc="http://schemas.openxmlformats.org/markup-compatibility/2006"
         xmlns:d="http://schemas.microsoft.com/expression/blend/2008"
         xmlns:local="clr-namespace:Example.TestChart.Views"
         xmlns:locals="clr-namespace:Example.TestChart.ViewModels"
         xmlns:s3D="http://schemas.abtsoftware.co.uk/scichart3D"
         mc:Ignorable="d"
         xmlns:prism="http://prismlibrary.com/"
         prism:ViewModelLocator.AutoWireViewModel="True"
         xmlns:object="clr-namespace:SciChart.Charting3D.Visuals.Object;assembly=SciChart.Charting3D"
         d:DesignHeight="300"
         d:DesignWidth="300">


<Grid>
    <s3D:SciChart3DSurface x:Name="SciChart"
                   Grid.Column="1"
                   BorderThickness="0"
                   WorldDimensions="1000,500,500"
                   RenderableSeries="{s3D:SeriesBinding RenderableSeriesCollenction}"
                   SceneObjects="{Binding SceneEntity3Ds}"
                   Grid.Row="1"
                   >

        <s3D:SciChart3DSurface.Camera>
            <s3D:Camera3D
                          Position="30,400,-1250"
                          Target="40,200,500"
                          />
        </s3D:SciChart3DSurface.Camera>

        <s3D:SciChart3DSurface.XAxis>
            <s3D:NumericAxis3D  AxisTitle ="X"
                        TextFormatting ="n2"
                        AutoRange = "Never"
                        VisibleRange ="0,100"
                        GrowBy =" 10, 10"
                        FlipCoordinates="True"
                        TickLabelAlignment ="Camera"
                        />

        </s3D:SciChart3DSurface.XAxis>
        <s3D:SciChart3DSurface.YAxis>
            <s3D:NumericAxis3D  AxisTitle ="Y"
                        TextFormatting ="n2"
                        AutoRange = "Never"
                        VisibleRange ="0,100"
                        GrowBy =" 10, 10"
                        TickLabelAlignment ="Camera" />
        </s3D:SciChart3DSurface.YAxis>
        <s3D:SciChart3DSurface.ZAxis>
            <s3D:NumericAxis3D  AxisTitle ="Z"
                        TextFormatting ="n2"
                        AutoRange = "Never"
                        VisibleRange ="0,100"
                        GrowBy ="10,10"
                        TickLabelAlignment ="Camera" />

        </s3D:SciChart3DSurface.ZAxis>

        <s3D:SciChart3DSurface.ChartModifier>
            <s3D:ModifierGroup3D>
                <s3D:OrbitModifier3D ExecuteOn="MouseLeftButton"/>
                <s3D:MouseWheelZoomModifier3D />
                <s3D:ZoomExtentsModifier3D AnimateDurationMs="500" ResetPosition="-10,400,-850" ResetTarget="0,200,500"/>
            </s3D:ModifierGroup3D>
        </s3D:SciChart3DSurface.ChartModifier>

    </s3D:SciChart3DSurface>
</Grid>
ViewModel:
    namespace Example.TestChart.ViewModels
{
    using SciChart.Charting3D.Visuals.RenderableSeries;
    using System;
    using System.Collections.ObjectModel;
    using System.Windows.Media;
    using Example.BaseClass;
    using SciChart.Charting3D.Visuals.Object;
    using System.Reflection;
    using System.IO;
    using SciChart.Charting3D;


public class TestChartViewModel : ViewModelBase
{
    public TestChartViewModel()
    {

        RenderableSeriesCollenction = new ObservableCollection<IRenderableSeries3DViewModel>();
        SceneEntity3Ds = new ObservableCollection<ObjectModel3D>();
        addr();
    }

    public void addr()
    {
        string filePath = Path.Combine(Path.GetDirectoryName(Assembly.GetExecutingAssembly().Location), "Objects\\Pawn_Low.obj");
        var obj = new ObjectModel3D(new Uri(filePath), Color.FromRgb(Convert.ToByte(255), Convert.ToByte(255), Convert.ToByte(0)))
        {
            Position = new Vector3(0.5f, 1f, 0.8f),
            CoordinateMode = ObjectCoordinateMode.Relative
        };
        obj.Scale = new Vector3(0.2f, 0.2f, 0.2f);
        SceneEntity3Ds.Add(obj);

    }

    private ObservableCollection<IRenderableSeries3DViewModel> _renderableSeriesCollenction;
    public ObservableCollection<IRenderableSeries3DViewModel> RenderableSeriesCollenction
    {
        get { return _renderableSeriesCollenction; }
        set { _renderableSeriesCollenction = value; }
    }

    private ObservableCollection<ObjectModel3D> _sceneEntity3Ds;
    public ObservableCollection<ObjectModel3D> SceneEntity3Ds
    {
        get { return _sceneEntity3Ds; }
        set { _sceneEntity3Ds = value; }
    }

}
}
- KEUNYOUNG LEE asked 1 year ago
- last active 1 year ago
I saw an obj file appear on the chart through SceneObject But I want to use custom polygon as a point marker for my ScatterRenderableSeries. Can you apply obj file to PointMarker3D? Or How do I add 3d polygon to chart via obj file in viewmodel?
- KEUNYOUNG LEE asked 1 year ago
- last active 1 year ago
Hi,
I’m creating a custom modifier that is derived from a VerticalSliceModifier. Basically if I press CTRL+Click, a VerticalLineAnnotation is added to the VerticalLines property, and tooltips with Y values are displayed. I’m using a collection of LineRenderableSeriesViewModel as data to chart. It works with one detail: my chart is within a tab, and when the tab changes and then returns, the tooltips disappear.
After further investigation, I noticed that the SeriesData ends up with 0 elements after the tab switch. To fix this, I have overrided the OnPropertyChanged on the class, and if the property that changed is “IWindowService”, I remove all markers if new value is null and add them back when new value is not null.
I don’t know why the “IWindowService” property is changed, or what the implications of that are. So even when the solution works, I don’t understand the internal mechanics of why it does.
I feel like there should be a better way to solve this. Can you help me out, or at least explain the internal workings?
I tried using the OnAttach and OnDetached events, but even when I remove the VerticalLines, somehow they keep appearing on the chart, and are not listed in the new VerticalLines collection.
- Arturo Perez asked 1 year ago
- last active 1 year ago
hi.. i want to as how can i add in string on x axis char now show 0 1 2 3 4
i want show string that i load from my DB.. exp Test1 test2 test22 test3
- Abdul Mutalib Mustafa asked 1 year ago
- last active 1 year ago
I used both, but DataPointSelectionModifier doesn’t seem to work
- ppp t asked 1 year ago
- last active 1 year ago
Hello,
we are building an application where Charts are created/placed by the user in a form of editor.
We observed that the creation of the first Chart takes between 1 to 3 seconds (depending on the system) but the creation of subsequent Charts takes virtually no time (as it should be).
We assume that the creation of the first Chart involves some kind of time consuming initialization that is later used in the creation of subsequent Charts.
So we have researched if there is a way to do this initialization at the start of our application, so the user is not inconvenienced by a three second waiting time while placing the first Chart.
We discovered the “LoadLibrariesAndLicenseAsync”-function. However, it looks like it has no measurable effect.
Maybe we are using it wrong?
Here is an example code to illustrate the problem in a condensed manner:
Two charts are created and each time the time it takes to create them is measured.
The first creation takes about 1600 milliseconds, the second one only 2.
How can we make both creations only take a few milliseconds?
Thank you.
        // SciChartSurface.SetRuntimeLicenseKey("our key");

         await SciChart.Charting.Visuals.SciChart2DInitializer.LoadLibrariesAndLicenseAsync(
           "our key",
            null); //...does not seem to work

        Stopwatch sw = new Stopwatch();
        sw.Restart();//start stopwatch

        //creating the first Scichart with test data:

        SciChartSurface sciChartSurface = new SciChartSurface();

        XyDataSeries<double, double> xyDataSeries = new XyDataSeries<double, double>();
        xyDataSeries.AcceptsUnsortedData = true;
        FastLineRenderableSeries fastLineRenderableSeries = new FastLineRenderableSeries();
        fastLineRenderableSeries.DataSeries = xyDataSeries;
        sciChartSurface.RenderableSeries.Add(fastLineRenderableSeries);

        NumericAxis m_xAxis = new NumericAxis();
        NumericAxis m_yAxis = new NumericAxis();
        m_yAxis.AutoRange = AutoRange.Always;
        sciChartSurface.XAxis = m_xAxis;
        sciChartSurface.YAxis = m_yAxis;

        using (xyDataSeries.SuspendUpdates())
        {
            for (int i = 0; i < 100; i++)
                xyDataSeries.Append(i, Math.Sin(i));
        }

        Screen.Children.Add(sciChartSurface);//add first Scichart to grid
        sciChartSurface.Margin = new Thickness(0, 0, 500, 0);

        MessageBox.Show("time: "+sw.ElapsedMilliseconds); //////////  1610 Mlliseconds
        sw.Restart();//restart stopwatch

        //creating the second Scichart with test data:

        SciChartSurface sciChartSurface2 = new SciChartSurface();

        XyDataSeries<double, double> xyDataSeries2 = new XyDataSeries<double, double>();
        xyDataSeries2.AcceptsUnsortedData = true;
        FastLineRenderableSeries fastLineRenderableSeries2 = new FastLineRenderableSeries();
        fastLineRenderableSeries2.DataSeries = xyDataSeries2;
        sciChartSurface2.RenderableSeries.Add(fastLineRenderableSeries2);

        NumericAxis m_xAxis2 = new NumericAxis();
        NumericAxis m_yAxis2 = new NumericAxis();
        m_yAxis2.AutoRange = AutoRange.Always;
        sciChartSurface2.XAxis = m_xAxis2;
        sciChartSurface2.YAxis = m_yAxis2;

        using (xyDataSeries2.SuspendUpdates())
        {
            for (int i = 0; i < 100; i++)
                xyDataSeries2.Append(i, Math.Sin(i));
        }

        Screen.Children.Add(sciChartSurface2);//add second Scichart to grid
        sciChartSurface2.Margin = new Thickness(500, 0, 0, 0);

        MessageBox.Show("time: "+sw.ElapsedMilliseconds); //////////////////////////// 2 Mlliseconds
- Marc Vahldieck asked 1 year ago
- last active 1 year ago
Hi SciChart!
I’m building a real-time data chart, and I wanted to add a SciChartOverview like the “Realtime Ticking Stock Chart” has.
But for some reason, when the user drags the overview to one of the edges, the XVisibleRange stops the updates.
The XAML, the relevant ViewModel, the update method and a short video that demonsrate the problem are attached.
- Ben Mendel asked 1 year ago
- last active 1 year ago
Hi there.
When using PixelPointMarker3D, it seems that it does not work depending on the version of “SciChart.Charting3D.dll”.
Here is my code.
<s3D:SciChart3DSurface.RenderableSeries>
    <s3D:PointLineRenderableSeries3D IsLineStrips="False" StrokeThickness="4">
        <s3D:PointLineRenderableSeries3D.PointMarker>
            <s3D:PixelPointMarker3D SelectedFill="Red"/>
        </s3D:PointLineRenderableSeries3D.PointMarker>
    </s3D:PointLineRenderableSeries3D>
</s3D:SciChart3DSurface.RenderableSeries>
. . .
 <s3D:SciChart3DSurface.ChartModifier>
    <s3D:ModifierGroup3D>
        <s3D:VertexSelectionModifier3D ExecuteOn="MouseRightButton" />
    </s3D:ModifierGroup3D>
</s3D:SciChart3DSurface.ChartModifier>
When i use a dll in the “%AppData%\Local\Programs\SciChart\SciChart SDK\ExampleBin\net6.0-windows\SciChart.Charting3D.dll” path, It works fine as follows.
(Dll Version: 7.0.0.26941)

On the other hand, when referring to SciChart3D received through Nuget, it does not work as shown below.
(Nuget Package Version: 7.0.1.27055)

It seems that TooltipModifier3D also behaves in the same way.
Is there any solution for the above trouble?
Best Regards.
- nada nada asked 1 year ago
- last active 1 year ago
Hello.
Is there a way to hide points out of the Visual Range in SciChart3DSurface?
- nada nada asked 1 year ago
- last active 1 year ago
Hello, I’m using the trial version currently and everything is working great.
I was wondering is there is any way to freeze the chart like I’m looking at pictures while the chart appends new data or save somehow the data points until I will finish my zoom(also if I can move while zooming).
I’m new developer and I have some Idea how to do that but I don’t what will be the right way to do so.
- Shai Ashto asked 1 year ago
- last active 1 year ago
hello.
I am trying to draw the cube area when dragged mouse in SciChart3DSurface likes RubberBandXyZoomModifier.
But I couldn’t find a way to get the coordinates of the mouse clicked point.
Is there a way to get the 3d coordinate value of the point clicked with the mouse in the SciChart3DSurface area?
- nada nada asked 1 year ago
- last active 1 year ago
Memory leak in Fifo mode with Visual Xccelerator Engine enabled.
Two screenshots with Visual Xccelerator Engine enabled and disabled.
In a real application, the behavior is repeated. GS.Collect does not solve the problem.
It looks like the problem occurs on the integrated video card. AMD. When switching to a discrete video card. Memory is stable.
- p0934181372 p0934181372 asked 1 year ago
- last active 1 year ago
Hi I am using UniformXyDataSeries<double> .
And I can’t work with SciChartOverview.
Before that I was working with XyDataSeries<double, double> and everything worked very well.
And now the entire SciChartOverview is simply black.. (still functions as a scrollbar)
And I get this –
SciChartSurface didn’t render, because an exception was thrown:
Message: Object reference not set to an instance of an object.Stack Trace: at
SciChart.Charting.Visuals.RenderableSeries.DrawingProviders.MountainSeriesDrawingProvider.trj(yhn
ayc, IPointSeries ayd) at
SciChart.Charting.Visuals.RenderableSeries.DrawingProviders.MountainSeriesDrawingProvider.OnDraw(IRenderContext2D
renderContext, IRenderPassData renderPassData) at
SciChart.Core.Extensions.EnumerableExtensions.ForEachDo[T](IEnumerable11 operation) at
enumerable, Action
SciChart.Charting.Visuals.RenderableSeries.BaseRenderableSeries.InternalDraw(IRenderContext2D
renderContext, IRenderPassData renderPassData) at
SciChart.Charting.Visuals.RenderableSeries.BaseRenderableSeries.SciChart.Charting.Visuals.IDrawable.OnDraw(IRenderContext2D
renderContext, IRenderPassData renderPassData) at
qxc.cyh(RenderPassInfo cff, IRenderContext2D cfg, Int32 cfh) at
qxc.cyg(ISciChartSurface cfc, RenderPassInfo cfd, IRenderContext2D
cfe) at qxc.RenderLoop(IRenderContext2D renderContext) at
SciChart.Charting.Visuals.SciChartSurface.DoDrawingLoop()
This is the code:
<s:SciChartSurface
           x:Name="sciChart0" ... >  <s:SciChartSurface.RenderableSeries >
                        <s:FastLineRenderableSeries x:Name="RenderableSeries0"  DataSeries="{Binding samples[0]._Series, Mode=TwoWay, UpdateSourceTrigger=PropertyChanged}"
                                            Stroke="{Binding samples[0].Color, Mode=TwoWay}"
                                            StrokeThickness="2" s:LegendModifier.IncludeSeries ="{Binding samples[0].Show, Mode=TwoWay, UpdateSourceTrigger=PropertyChanged}"/>
                      </s:SciChartSurface.RenderableSeries > <!-- .....  -- >
    </s:SciChartSurface>


    <!-- Declare the SciChartOverview and bind to the main chart -->
                <s:SciChartOverview  x:Name="sciChart0Overview" MouseWheel="sciChart0Overview_MouseWheel" Margin="10,0,10,0"
                                    DataSeries="{Binding ElementName=sciChart0, Path=RenderableSeries[0].DataSeries}"
                                    ParentSurface="{Binding ElementName=sciChart0}" Height="50" VerticalAlignment="Bottom"
                                    SelectedRange="{Binding ElementName=sciChart0, Path=XAxis.VisibleRange, Mode=TwoWay}"
                                     ToolTip="Use the mouse wheel to change the sample shown here."
                                     />
Again – everything worked fine for me until I changed the data structure…
[samples[0]._Series is type of UniformXyDataSeries<double>()]
Thanks!
- ravid saadia asked 1 year ago
- last active 1 year ago
Hello,
I would like to implement a simple FastColumnRenderableSeries with an HorizontalLineAnnotation. But I would like it to be sideways.
Here is my current code:
        g = new FastColumnRenderableSeries();

          colums = new UniformXyDataSeries<double>();>

          using (m_sciChartSurface.SuspendUpdates())
          {
              colums.Append(1);
          }


          g.DataSeries = colums;

          m_sciChartSurface.RenderableSeries.Add(g);>

          m_xAxis = new NumericAxis();
          m_yAxis = new NumericAxis();


          m_sciChartSurface.XAxis = m_xAxis;
          m_sciChartSurface.YAxis = m_yAxis;

          m_xAxis.Visibility = System.Windows.Visibility.Hidden;
          m_yAxis.AutoRange = AutoRange.Never;
          m_yAxis.VisibleRange = new DoubleRange(-3, 2);


          HorizontalLineAnnotation hla = new HorizontalLineAnnotation();
          hla.Y1 = 1;
          hla.StrokeThickness = 5;
          hla.Stroke = Brushes.Red;
          m_sciChartSurface.Annotations.Add(hla);

              m_xAxis.AxisAlignment = AxisAlignment.Left;
              m_xAxis.FlipCoordinates = true;
              m_yAxis.AxisAlignment = AxisAlignment.Top;
              m_yAxis.FlipCoordinates = true;
However, the HorizontalLineAnnotation behaves strangely.
Anny suggestions?
Thank you.
- Marc Vahldieck asked 1 year ago
- last active 1 year ago
I’m working with Custom Meshes. I want the user to be able to delete and create an arbitrary number of meshes. It’s fine if there’s a maximum number of meshes that can exist at a time. However, by repeatedly clearing and creating the same mesh, I get this error;
System.InvalidOperationException: ‘The Maximum Mesh ID has been exceeded. Please see http://www.scichart.com/maximum-mesh-id‘
I get the error when I try to add a FreeSurfaceRenderableSeries3D object to the a Scichart3DSurface.RenderableSeries. The link provided by the error got 404’d. I have sixteen SceneObject objects and one TextSceneEntity, borrowed from the example suite. While reproducing the error, I never had more than one mesh. I cleared the RenderableSeries before inserting another mesh.
Is it possible to keep adding meshes as long as I delete them, or does a SciChart3DSurface have a maximum number of meshes that can be added, even with deletion?
- Will Wright asked 1 year ago
- last active 1 year ago
Hi,
I have an analog and scatter chart on separate tabs and when I change for the tab with the scatter chart, after a bit the chart starts to flicker with the data on the chart and the axes values moving quickly up and down and in a few seconds, it’ll become still and won’t move anymore until I change tabs again. It looks like if it would like to scale the Y axis values really quickly, but it’s the same before and after the flickering, which is totally correct, so there is no need to do anything like this. It happens both if I put data to the series dynamically and if there is no data update also. What can cause this behavior?
This is my chart in the XAML:
<s:SciChartSurface x:Name="ScatterChart"
   ClipToBounds="True"
   RenderableSeries="{Binding ScatterRenderSeries}"
   Margin="10,0" >

<s:SciChartSurface.ChartModifier>
    <s:ModifierGroup>
        <s:XAxisDragModifier DragMode="Scale"/>
        <s:YAxisDragModifier AxisId="LeftAxis" DragMode="Scale"/>
        <s:YAxisDragModifier AxisId="RightAxis" DragMode="Scale"/>
        <sciChart6Controls:NotifyingMouseWheelZoomModifier IsEnabled="true" ReceiveHandledEvents="True"/>
        <s:MouseWheelZoomModifier IsEnabled="True" ActionType="Zoom" XyDirection="XYDirection"/>
        <s:RubberBandXyZoomModifier/>
        <s:ZoomPanModifier IsEnabled="True" ExecuteOn="MouseRightButton" ClipModeX="None" />
        <s:ZoomExtentsModifier ExecuteOn="MouseDoubleClick" />
        <s:RolloverModifier ShowTooltipOn="MouseOver"/>
        <s:LegendModifier Margin="10" ShowLegend="True" />
    </s:ModifierGroup>
</s:SciChartSurface.ChartModifier>

<s:SciChartSurface.XAxis>
    <s:NumericAxis x:Name="ScatterXAxis"
            AutoRange="Always"
            GrowBy="0.1,0.1"
            AxisTitle=""
            DrawMajorBands="True"
            DrawMinorTicks="True"
            DrawMinorGridLines="True"
            AutoTicks="True"
            AxisAlignment="Bottom"/>
</s:SciChartSurface.XAxis>

<s:SciChartSurface.YAxis>
    <s:NumericAxis x:Name="ScatterYAxis"
            Id="LeftAxis"
            AutoRange="Always"
            GrowBy="0.1,0.1"
            AxisTitle=""
            DrawMajorBands="True"
            DrawMajorGridLines="True"
            DrawMinorGridLines="True"
            AutoTicks="True"
            TextFormatting="F2"
            ScientificNotation="Normalized"
            AxisAlignment="Left" />
</s:SciChartSurface.YAxis>
- Péter Grósz asked 1 year ago
- last active 12 months ago
Hi,
I’ve faced a strange issue, chart display normally in prevew window under anycpu configuration, once changed the configuration to x64, tha chart not display with no error message. I’ve tied on two computers, erase system harddisk, reinstall window, only install vs2019 and scichart wpf7, and the issue is same. Other wpf controls work normally only scichart has this issue. The program is running normally, only in preview has this issue.
And it’s OK in VS 2022, same project open in VS 2022, x64 configuration preview display normally.
Any solution? Thanks.
- Keyu Yan asked 1 year ago
- last active 1 year ago
I am creating a graph for 10 data series using Scichart, with the most optimal legend placement for the graph being “Top” with Horizontal Orientation as shown in the code below. I would like to keep the spacing compact so all the data series can be visible without the need for the scrollbar, however because of the checkboxes for selecting each series being enabled I cannot compress the spaces to make all the data series visible. I did try using a custom legend with the typical binding but to no avail. I have attached an image of the current legend as well.
<s:LegendModifier Name="legendModifier" Margin="1" Width="1" ShowLegend="True" Orientation="Horizontal"
                                  HorizontalAlignment="Left" VerticalAlignment="Top"
                                  LegendPlacement="Top" ScrollViewer.HorizontalScrollBarVisibility="Auto"
                                  Visibility="Visible"/>
Is it possible to format the legend so as to keep all the series names visible while maintaining the checkboxes for displaying or hiding individual data series?
- Gil Owu asked 1 year ago
- last active 1 year ago
I followed the official example (SciChart_AddObjectsToa3DChart), created a simplest test program, copied the “King_Low.obj” file from the official sample program into my test program, but “King_Low.obj” did not show up, what is the problem?
- hundun wds asked 1 year ago
- last active 1 year ago
Hello,
I just want to override the ChartModifier property in the style
I have tree charts one after the other and only the last chart has a legend. It seems I cannot use a style with the same key multiple times.
<Style x:Key="ChartWithMyModifiers" TargetType="{x:Type s:SciChartSurface}">
    <Setter Property="ChartModifier">
        <Setter.Value>
            <s:ModifierGroup>
                <s:ZoomPanModifier ExecuteOn="MouseRightButton" ClipModeX="None" />
                <s:YAxisDragModifier DragMode="Scale"/>
                <s:XAxisDragModifier DragMode="Scale"/>
                <s:MouseWheelZoomModifier/>
                <s:ZoomExtentsModifier ExecuteOn="MouseDoubleClick" />
                <s:LegendModifier ShowLegend="True"/>
            </s:ModifierGroup>
        </Setter.Value>
    </Setter>
</Style>
The result screen is attached.
Thanks, Gabor
- László Géczi asked 1 year ago
- last active 1 year ago
Hi,
I made a custom modifier and tried to capture a keydown event in Custom Modifiers in abstract “Overriding Key Events” described. The problem is that this event is only fired when SciChartSurface is on focus but for standard modifier like MouseWheelModifier it is working properly. Is there any way to capture the event for whole application?
- Marcus Krauße asked 1 year ago
- last active 1 year ago
https://www.scichart.com/questions/wpf/allow-point-marker-to-extend-past-graph-border
It is 6 years ago. Is it still not supported?
Extending a graph using GrowBy is not adequate for me because what I need is to draw a point on the border not to extend the graph.
- JONGBOG JOUNG asked 1 year ago
- last active 1 year ago
Hello,
I am trying to add a BoxAnnotation with MVVM pattern where the X-Axis is a DateTime axis. The annotation can be dragged into the X-direction. I need to know the DateTime of each position while dragging and also the final position(DateTime) of the BoxAnnotation when the drag Ended. I am listening to the DragDelta and DragEnded events in ViewModel. But here I couldn’t able to get the DateTime from X1 and X2 of that annotation model. I am sharing some snippets of my code. Can you please let me know how I can achieve this?
In xaml:
<Style x:Key="_boxAnnotationStyle" BasedOn="{StaticResource AnnotationBaseStyle}" TargetType="scichart:BoxAnnotation">
        <Setter Property="Template">
            <Setter.Value>
                <ControlTemplate TargetType="scichart:BoxAnnotation">
                    <Border x:Name="PART_BoxAnnotationRoot"
              Margin="{TemplateBinding Margin}"
              Background="{TemplateBinding Background}"
              BorderBrush="{TemplateBinding BorderBrush}"
              BorderThickness="{TemplateBinding BorderThickness}"
              CornerRadius="{TemplateBinding CornerRadius}" />
                </ControlTemplate>
            </Setter.Value>
        </Setter>
</Style>
<scichart:SciChartSurface x:Name="GraphSurface"
                 Annotations="{scichart:AnnotationsBinding ItsAnnotations}">

                <scichart:SciChartSurface.XAxis>
                    <scichart:DateTimeAxis x:Name="GraphXAxis"
                                           VisibleRange="{Binding ItsTimeVisibleRange, Mode=TwoWay}" />
                </scichart:SciChartSurface.XAxis>

                <scichart:SciChartSurface.YAxes>
                    <scichart:NumericAxis x:Name="GraphYAxis"
                                          VisibleRange="0, 10" />

                </scichart:SciChartSurface.YAxes>
 </scichart:SciChartSurface>
In ViewModel.cs
{
    private DateRange _timeVisibleRange;
    private ObservableCollection<IAnnotationViewModel> _annotations;
    private IAnnotationViewModel _boxAnnotation;
    public ObservableCollection<IAnnotationViewModel> ItsAnnotations
    {
        get
        {
            return _annotations;
        }
    }
    public DateRange ItsTimeVisibleRange
    {
        get { return _timeVisibleRange; }
        set
        {
            if (_timeVisibleRange == value) return;
            _timeVisibleRange = value;
            RaisePropertyChanged(() => ItsTimeVisibleRange);
        }
    }
    .
    .
    .
    _boxAnnotation = new BoxAnnotationViewModel()
        {
            IsEditable = true,
            DragDirections = SciChart.Charting.XyDirection.XDirection,
            X1 = DateTime.UtcNow.AddSeconds(300),
            X2 = DateTime.UtcNow,
            Y1 = 0,
            Y2 = 8,
            StyleKey = "_boxAnnotationStyle"
        };

     _annotations = new ObservableCollection<IAnnotationViewModel>() { };
     _annotations.Add(_boxAnnotation );

     _captureTimeRangeSelectorAnnotation.DragDelta += OnDrag;
     _captureTimeRangeSelectorAnnotation.DragEnded += DragEnded;
       .
       .
       .
    private void DragEnded(object sender, EventArgs e)
    {
         var boxAnnotationModel = sender as BoxAnnotationViewModel;
          // Need to know the DateTime value of X1 and X2
    }
    private void OnDrag(object sender, AnnotationDragDeltaEventArgs e)
    {
         var boxAnnotationModel = sender as BoxAnnotationViewModel;
         // Need to know the DateTime value of X1 and X2
    }
    .....
    .....
}
- Habibur Rahman asked 1 year ago
- last active 1 year ago
Have you guys ever seen the attached stack trace? It appears to happen when our view model gets activated and the annotations get unbound and rebound quickly during view model activation. It’s difficult to reproduce and is very specific to certain view models so I’m not going to try to create a sample application that has the issue, but perhaps you’ve seen the stack trace before or know something about it.
Thanks for any help!
Matthew
- Matthew Trahan asked 1 year ago
- last active 10 months ago
Hello SciChart team,
I wanted to implement 3DSelectionModifier that should select a point closest to the mouse pointer per mouse click.
To do this, I create a rectangle with a clicked point in the center with a mouse click and use the PickScene method of the ViewPort3D object.
List<EntityVertexId>? entityVertexIds = Viewport3D.PickScene(mousePoint.ToRectCenter(30));
Depending on the camera angle It can of course happen that several points appear in the scene. In this case I wanted to do the following:
for each determined point in 3D space, determine its 2D screen coordinates
HitTestInfo3D hitTestInfo = new HitTestInfo3D() { IsHit = true, EntityId = entityVertexId.EntityId, VertexId = entityVertexId.VertexId };
SeriesInfo3D? seriesInfo = pointsEntity.ToSeriesInfo(hitTestInfo);
//Vector3D hitVertex = seriesInfo.HitVertex;
Vector3 vertex = seriesInfo.HitVertexCoords;
Point point1 = ParentSurface.Camera.WorldToScreenSpace(vertex);
Determine the distance between the point of the mouse and the 2D coordinates of the point from the scene
double newDistance = PointUtil.Distance(mousePoint, point1);
Select the point with the shortest distance.
if (distance.IsNaN() || newDistance < distance)
{
  distance = newDistance;
  nearestSeriesInfo3D = seriesInfo;
}
During the implementation I encountered the following problem:
I used following camera object method first
Point p = ParentSurface.Camera.WorldToScreenSpace(vertex);
but this gave me no plausible point.
The other method
Point p = ParentSurface.Camera.LocalCoordinateToScreenSpace(vertex);
also seemed to return a point that returned the wrong value when calculating the distance, so the wrong point was selected.
If I try to click the data point directly, I expect at least one of the methods to return a point very very close to the mouse pointer. However, both methods gave me a point on the screen (see screenshot) that did not match the mouse point.
Maybe I’m missing a step or transformation. Could you explain me what I’m doing wrong?
Example project is attached
- Silvester Schneidt asked 1 year ago
- last active 10 months ago
hello, can i know how to draw draw multiple 3DPointlines in a 3DSurface? I want to show my result in a 3DSurface, but i don’t know how to do it in SciChart. Thank you very much!
- Jian qiang Huang asked 1 year ago
- last active 1 year ago
Hello,
Is there away to extend a LineAnnotationViewModel to the right? I see there is a ExtendedLineAnnotaion
But that only seems to be available in the DrawingTools API.
Thank you
- Leland asked 1 year ago
- last active 1 year ago
Hi,
When hovering mouse over a graph, the box that appears showing the name and value gets cut off instead of flipping to remain in the area.
Can you please help me to overcome this issue or if any, idea or lead much appreciated. Please let me know if you need more information.
Please find the screenshot for your reference.
- Barani G asked 1 year ago
- last active 1 year ago
Hi, I want to create an event that will run when the user checks a zoom square. (see picture: zoom_square.png)
My motivation:
I run realtime samples and set:
AutoRange="Always"
It bothers me that I can’t zoom the X axis (because the AutoRange…) The way I found to solve it is to change the NumericAxis.GrowBy property. But I want it to happen automatically when the user checks a zoom square and not manually like it is now.
I added pictures:
1. A given situation in which the samples are seen. (AutoRange="Always")
2. What happens when you zoom (either with the zoom square or with the mouse wheel)- The Y axis is stretched but the X axis is not.
3. What does the graph look like if the user drags the X-axis to the sides and changes the NumericAxis.GrowBy ==> desired state.
I want step 3 to happen automatically according to the size of the square the user marked. (According to the size of the square, I will know how to define the appropriate NumericAxis.GrowBy)
thanks!
- ravid saadia asked 1 year ago
- last active 1 year ago
Hello,
I’m using SciChart in our WPF project. And we are Keeping Series and Annotations as RadObservableCollection(from Telerik) instead of ObservableCollection to get the benefits of RadObservableCollection. But when I’m adding or deleting data from RadObservableCollection it does not affect in charts. Does SciChart work with RadObservableCollection ? I’ve explored your examples and wasn’t able to found examples with RadObservableCollection.
- Lusine Torosyan asked 1 year ago
- last active 1 year ago
Requirements:
- Main graph updates based on the data from the selected Item.
- The data and styling is independent and the style is dynamic global style for all Items.
- The data for the graphing that is Data Series is binded to DataSet which is of type XYDataSeries<DateTime, double>.
- DataSeries data is obtained from the datacontext which implements INotifyPropertyChanged
Problem:
- The databinding is not dynamic and the data series is not updated when the selection changes.
- The initial data selection is reflected but any subsequent data changes are not reflected on the sci chart surface.
- This behavior was only for the Dataseries binding and it was verified using a textbox which binds to the count of the DataSet and this updates as the selection changes but not the dataseries.
Please suggest a work around or an alternative solution so that I can predefine axes and series but swap out the data based on the selected Item. Please see the attached xaml code below.
        <Grid>
        <Grid DockPanel.Dock="Top">
            <chart:SciChartSurface x:Name="mainView"
                                   OnRenderException="MainView_OnRenderException"
                                   Loaded="MainView_Loaded">
                <chart:SciChartSurface.YAxes>
                    <chart:NumericAxis x:Name="AxisOne"
                                       Id="Id1"
                                       AxisAlignment="Left"/>

                    <chart:NumericAxis x:Name="AxisTwo"
                                       Id="Id2"
                                       AxisAlignment="Left"/>

                </chart:SciChartSurface.YAxes>
                <chart:SciChartSurface.XAxis>
                    <chart:DateTimeAxis x:Name="DateTimeAxis"/>
                </chart:SciChartSurface.XAxis>
                <chart:SciChartSurface.RenderableSeries>
                    <chart:FastLineRenderableSeries x:Name="DataSet1FS"
                                                    DataSeries="{Binding DataSet1}"
                                                    YAxisId="Id1"
                                                    Stroke="Yellow"/>
                </chart:SciChartSurface.RenderableSeries>
            </chart:SciChartSurface>
        </Grid>
        <TextBlock Text="{Binding Path=DataSet1.Count}"
                            Margin="0 -20 0 0"
                            HorizontalAlignment="Right"
                            VerticalAlignment="Top"
                            Height="20"
                            Width="200"
                            Background="White"
                            Foreground="Black"/>
    </Grid>
- Arjun Sivaprasadam asked 1 year ago
- last active 1 year ago
I show very low values and they show me as 0.
Although they are not.
(I tried to change the
SciChartSurface.YAxis.NumericAxis.TextFormatting="0.000000000000000000000000000000000000000000...")
But it didn’t help
- ravid saadia asked 1 year ago
- last active 1 year ago
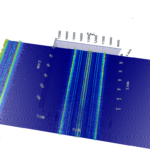
I’m trying to draw 3d spectrum waterfall chart using PointLineRenderableSeries3D, but the graph is flickering (when i rotate it using orbit modifier) with dashed lines. I’m trying to use different settings in my code and SciChart Examples (StrokeThickness, Opacity, Antialiasing, layout rounding, tips from this topic https://www.scichart.com/questions/wpf/flickering-chart), but nothing helps me. I attach two images (plot 1 from SciChart Examples (dashed lines) and plot 2 – from my program (flickering)). Is there any way to make lines more clear and not flickering (something like plot 3 attached image).
- Maksim Rumyantsev asked 1 year ago
- last active 1 year ago
Hello,
I am trying to generate a graph where the ticks and the labels will be added from TickProvier and LabelProvider. But when there is not enough space, it doesn’t show most of the labels, where it can only skip one label in the middle of two labels (Please check the attached photo). I can not set IsLabelCullingEnabled = true as I do not want any overlap on labels.
I have shared a sample project. Here, I always want to show all the ticks generated from the TickProvider. But how can I handle the labels, so that I can decide inside LabelProvider(Or any other place) if I should set a label empty or not based on the previous label position?
- Habibur Rahman asked 1 year ago
