Hi~
I am trying to create a plot that animates ODS (Operating Deflection Shape) using FRF (Frequency Response Function) data. Is ODS animation possible using scichart’s gemoetry 3D plot?
Thanks.
- kim2 kim asked 11 months ago
- last active 11 months ago
I am working on a multithreaded application where the acquisition and chart display run on different threads. I am attempting to collect samples and plot only when I have 100 samples available to have less resource consumption and keep the application responsive. However, when I change the number of samples in the block, my FIFO capacity seems to change, allowing significantly less amount of samples than the ones I need. The current FIFO capacity should allow for at least 16 mins worth of data, but it only shows less than a second
If I set the block size to 1 (single sample appending) I obtain the results I need, but I am seeing performance issues in other areas of the program, hence the need of appending in blocks.
See the attachments for more clarity. Any suggestions?
EDIT: Adding code
private void DisplayNPD()
        {
            XyDataSeries<float, float> npdRawDataSeries = new XyDataSeries<float, float>();
            int fifoSize = 1000000;
            npdRawDataSeries.FifoCapacity = fifoSize;
            npdRawData_RS.DataSeries = npdRawDataSeries;

            double npdRaw = 0;
            bool successfulDequeue = false;
            int samplesQueued = 0;
            int samplesInBlock = 100;
            float[] rawSamples = new float[samplesInBlock];
            float[] time = new float[samplesInBlock];

            while (!ImagingSession.terminateThreads)
            {
                if (ImagingSession.laserOnOff && !graphRestarted)
                {
                    int npdElementsInQueue = npdDisplayQueue.Count;
                    if (npdElementsInQueue > 0)
                        successfulDequeue = npdDisplayQueue.TryDequeue(out npdRaw);

                    if (successfulDequeue)
                    {
                        currentTime = graphStopwatch.ElapsedMilliseconds * 0.001;
                        time[samplesQueued] = (float) currentTime;
                        rawSamples[samplesQueued] = (float) (npdRaw * 1000);

                        samplesQueued++;
                        if (samplesQueued == samplesInBlock)
                        {
                            using (npdRawDataSeries.SuspendUpdates())
                                npdRawDataSeries.Append(time, rawSamples);
                            samplesQueued = 0;

                            if (currentTime > upperLimit)
                            {
                                lowerLimit = upperLimit;
                                upperLimit += xAxisWidth;
                                AdjustXAxis(currentHorizontalScale);
                            }
                        }
                    }
                }
            }
        }
- Matthew Beatty asked 9 months ago
- last active 9 months ago
Hi,
I want to change the grid distance between the two slices dynamically in both X , Y and Z direction. But whatever the value I set for StepZ and StepX, nothing changes in the output. I still see the same graph.
Please can you suggest if there is any way to achieve this.
I am attaching the code of waterfall example here.
- Deepashree Iyangar asked 7 months ago
- last active 5 months ago
Sorry for opening another question, but this followup to https://www.scichart.com/questions/js/series-labels got missed.
I’m looking to add a border and background to a TextAnnotation.
Back in the WPF days we had the ability to pretty easily add background colors and such to annotations, thanks to the existing WPF model. I’m assuming in the JS example this would be custom; do you have any existing code/examples for that? Looking for being able to use a colored box whose fill matches the renderable series stroke, along with a contrasting text color.
Dan
- Dan Santimore asked 6 months ago
- last active 5 months ago
Hi,
I previously asked a question about a flickering chart. (https://www.scichart.com/questions/question/flickering-chart)
After stripping down my application I think I have found the root cause, and the information in that question seem to be completely irrelevant. If it is ok I’d rather delete that question.
I have extracted the relevant code out of my application and put it in the attached test application. After clicking the start button data should be added in real time. To reproduce change the visible area to a part of the chart and then hold to right scrollbar grip and move it, don’t release, just hold still, the chart starts to flicker.
- Bruno Vermeersch asked 8 years ago
- last active 8 years ago
Hi!
I have chart with mountain series with a palette provider.
It performs extremely well with 50k points.
However, I noticed that when I drag the chart away, to a point where the series is not visible, the performance sinks and the chart is extremely laggy.
I have uploaded my code to codepen: https://codepen.io/robrob123/pen/KKJjyvp
I checked the performance using the chrome performance profiler and I found that a function called applyStrokeFillPalletting is called repeatedly many times and each time it takes way too long to execute, considering there is no series to draw.
I have attached a screenshot showing the performance profiling.
Thank you!
- Roger Cooper asked 5 months ago
- last active 4 months ago
Hello!
Great work, thanks a lot for this framework!
Could you provide an example of animated inserting of a new point? My goal is to implement interpolation between previous retrieved and last point on the real-time line chart.
- Alexander Edunov asked 8 years ago
- last active 2 years ago
I want to implement something like, if a certain analysis value/custom logic is true for one of the values in the loop, –> set this bar color to ‘orange’ as an example, how can i do this?
   // Create a dataset of type x=DateTime, y=Double
  var dataSeries = new OhlcDataSeries<DateTime, double>();

   // Prices are in the format Time, Open, High, Low, Close (all IList)
  var prices = smallerList;

    // Append data to series. SciChart automatically redraws
    for (var i = 0; i < prices.Count(); i++)
   {

 // Convert TIME to a 4-digit string (e.g., 5 becomes "0005", 15 becomes "0015")
 string timeString = prices[i].Value.TIME.ToString("D4");

 // Parse the TIME field
 int hour = int.Parse(timeString.Substring(0, 2));
 int minute = int.Parse(timeString.Substring(2, 2));

 // Create the DateTime object
 DateTime dateTime = new DateTime(prices[i].Value.YEAR, prices[i].Value.MONTH, prices[i].Value.DAY,      hour, minute, 0);
 Dispatcher.Invoke(() =>
 {
     //here we append values in 'dataSeries', how do i do something like, 'bool condition =
// returnCustomLogic('dataValues') --> outputs true, if true --> set this bar color to orange

     // Update the UI element on the UI thread
     dataSeries.Append(
    dateTime,
    (double)prices[i].Value.OPEN,
    (double)prices[i].Value.HIGH,
    (double)prices[i].Value.LOW,
    (double)prices[i].Value.CLOSE);

   });


   }
     Dispatcher.Invoke(() =>
     {
 StockChart.RenderableSeries[0].DataSeries = dataSeries;

 // Zoom Extents - necessary as we have AutoRange=False
 StockChart.ZoomExtents();
   });
- Adan Ramirez asked 3 months ago
- last active 3 months ago
I am trying to subscribe to Visible Range changes on a DateTimeNumericAxis, it is not working, am I doing something wrong?
- Jhonatan Laguna asked 2 months ago
- last active 2 months ago
Hello SciChart-Team!
I’m trying to export a graph from my application using the “ExportToFile”-method.
This is what my code looks
Chart.ExportToFile(@"C:\Users\miko\Desktop\export.xps", SciChart.Core.ExportType.Xps, false, new Size(2560, 1440));
When this is being called the following exception is being raised
Exception thrown: 'SciChart.Charting.Common.Helpers.ExportException' in SciChart.Charting.dll

Additional information: Exception occured during deserialization of the SeriesSelectionModifier type. The SelectedSeriesStyle property of the Style type cannot be processed. Please be advised that SciChart doesn't handle serialization of objects with propeties of interface type, collection type or custom type.You need to implement IXmlSerializible in such objects to have them handled properly. For more details, please check the InnerException.
This exception seems to be related to the SeriesSelectionModifier I have applied to my chart.
The modifier XAML:
<s:SeriesSelectionModifier
    x:Name="seriesSelection
    SelectedSeriesStyle="{StaticResource selectedSeriesStyle}"
    SelectionChanged="seriesSelection_SelectionChanged" />
The style XAML
<Style x:Key="selectedSeriesStyle" TargetType="{x:Type s:FastLineRenderableSeries}">
     <Setter Property="PointMarkerTemplate">
         <Setter.Value>
             <ControlTemplate>
                 <s:EllipsePointMarker
                 Width="6"
                 Height="6"
                 Fill="White"
                 Stroke="Black" />
            </ControlTemplate>
         </Setter.Value>
     </Setter>
 </Style>
When I remove the SeriesSelectionModifier from my XAML all works as expected.
What am I missing?
- Michael Kollmann asked 7 years ago
- last active 7 years ago
Hi all,
I would like to ask how to modify the label of the OHLC Chart in Android.
For example, in the attached screenshot, how to change the label “Highest” to “High” ? Thanks.
- Ray Hung asked 7 years ago
- last active 7 years ago
I was doing a bit of thinking about how I would be adding a horizontal line to my financial data series because my x-axis was in Date format. So I wrote this walkthrough with 2 functions to help any devs that come along after me.
My example is a bar chart with prices on the vertical y-axis and dates on the x-axis. the final product is posted below as a pic. All that is needed is to count the items in your date data series and you can position your bar relative to that.
my dates were in this object array and I just counted the array to get my bearings.
let totalBars = lastPriceList.count        //  holds number of bars in my price object
let startBar = totalBars - 100             //  this will make my line 100 bars long
let sellPrice = lastBar?.shortEntryPrice   //  here is the price level of the line I want to plot
then I passed that to this function to get a horizontal line
addTradeEntry(SignalLine: sellPrice!, StartBar: startBar, EndBar: totalBars)
here are the 2 functions that do all of the work
private func addTradeEntry(SignalLine: Double, StartBar: Int, EndBar: Int) {

    let horizontalLine1 = SCIHorizontalLineAnnotation()
    horizontalLine1.coordinateMode = .absolute;

// lower number pushes to left side of x axis
    horizontalLine1.x1 = SCIGeneric(StartBar)
// higher number pushes bar right of x axis
    horizontalLine1.x2 = SCIGeneric(EndBar)

// the position on y (price) axis
    horizontalLine1.y1 = SCIGeneric(SignalLine)
    horizontalLine1.horizontalAlignment = .center

    horizontalLine1.isEditable = false
    horizontalLine1.style.linePen = SCISolidPenStyle.init(color: UIColor.red, withThickness: 2.0)
    horizontalLine1.add(self.buildLineTextLabel("Sell \(SignalLine)", alignment: .left, backColor: UIColor.clear, textColor: UIColor.red))
    surface.annotations.add(horizontalLine1)
}
this one formats the text
private func buildLineTextLabel(_ text: String, alignment: SCILabelPlacement, backColor: UIColor, textColor: UIColor) -> SCILineAnnotationLabel {
    let lineText = SCILineAnnotationLabel()
    lineText.text = text
    lineText.style.labelPlacement = alignment
    lineText.style.backgroundColor = backColor
    lineText.style.textStyle.color = textColor
    return lineText
}
- Warren Hansen asked 7 years ago
- last active 6 years ago
Hello, SciChart Team!
i have an issue using mouse drag event ( RubberBandXyZoomModifier, ZoomPanMidifier). the message says “NullReferenceException in SciChart.Charting.dll ” or “Thread.cs not found” from time to time.
after some experiments i figured out that the app starts to crush after i change XAxis type .
i have a simple mvvm user control used to display both arrays of double and datebound data, XAxes of SciChart Surfase is bound to an observable collection of IAxis elements. if i need to change chart type i clear this collection and create an axis of desired type (DateTimeAxisViewModel or NumericAxisViewModel). after that the series can be added, but zooming causes crash with nearly to no info.
i attached a solution, which lacks only scichart dlls in order to run (hopefully), Window_Loaded method has a commented line which changes chart type and makes app crush on zooming, would be nice if you checked it out.
Thanks in advance!
Alexander
- Alexander Volkov asked 6 years ago
- last active 6 years ago
Hi,
I am trying to show a 2D Scatter series having 4 points that form a square. Like (0;0), (1;0), (1;1) and (0;1). Is there a way to tell the chart to keep this thing square when I resize the surface, use zoom extent, rubber zoom etc? I basically need X/Y ratio to be fixed.
Thanks
- Valeriy Karkachev asked 5 years ago
- last active 2 years ago
Hello everyone,
I have a chart which has data added to its plots at inconsistent time intervals.
My intention is to be able to limit the displayed data by their x-values, for example only showing the last 60 seconds. At the same time I wish to be able to zoom/pan back to the old data, so I can not discard it, and from what I saw “VisibleRangeLimit” did not work this way either, as it limited every zoom or pan action to the given range limit. Mainly I need the auto ranging to limit the display to my limits (and return the graph to its scrolling mode), while every other zoom/pan interaction stops the scrolling without being limited.
The solution I came up with for this is to “move” the VisibleRange of the axis whenever new data points outside the current displayed range are added to the chart’s plots. (For example if a point is plotted at 61 seconds, the VisibleRange moves to min=1 and max=61.)
I made this into an axis class, which inherits the NumericAxis and uses DataRangeChanged to change the VisibleRange on data changes and VisibleRangeChanged to react to auto ranging and zooming/panning.
private void UpdateVisibleRange()
{
    DoubleRange visibleRange = (DoubleRange)GetMaximumRange();
    visibleRange.Min = visibleRange.Max > ViewLimit ? visibleRange.Max - ViewLimit : 0;
    VisibleRange = visibleRange;
}

// DataRangeChanged += DataRangeChangedHandler;
private void DataRangeChangedHandler(Object sender, EventArgs e)
{
    if (IsAutoRangeActive)
    {
        UpdateVisibleRange();
        IsAutoRangeActive = true;
    }
}

// VisibleRangeChanged += VisibleRangeChangedHandler;
private void VisibleRangeChangedHandler(Object sender, VisibleRangeChangedEventArgs e)
{
    if (base.AutoRange == AutoRange.Always)
    {
        base.AutoRange = AutoRange.Never;
        UpdateVisibleRange();
        IsAutoRangeActive = true;
    }
    else if (IsAutoRangeActive)
    {
        IsAutoRangeActive = false;
    }
}
(Only relevant code shown.)
How it works:
If the VisibleRange of the axis is changed through other means than new data being plotted or AutoRange being set to Always, a zoom/pan action is assumed and IsAutoRangeActive gets set to false.
If AutoRange is set to Always it causes the VisibleRange to change, which causes a VisibleRangeChanged event to trigger, activating IsAutoRangeActive and recalculating the VisibleRange to fit the desired view limit.
IsAutoRangeActive being true causes data range changes from new data to call UpdateVisibleRange, which moves the displayed range according to the view limit. As changes to the VisibleRange cause a VisibleRangeChanged event to trigger, which sets IsAutoRangeActive to false, IsAutoRangeActive needs to be reset to true after the VisibleRange has been updated in the handler.
The problem:
It all seemed to work fine until I noticed that this method does not update the actually displayed axis VisibleRange to the latest range. It uses the previous VisibleRange whenever the DataRange changes, despite VisibleRange apparently being set to the correct values. For example, if the previous range was at “min=1, max =61”, and the next is at “min=2, max=62”, the chart’s x-axis would display “min=1, max=61” instead.
It seems that “VisibleRange = visibleRange;” in UpdateVisibleRange, called from DataRangeChangedHandler, does not update the displayed range.
It works fine if the change is trigger by setting AutoRange to Always, and the x-axis’ VisibleRange corrects itself when the y-axis is modified.
(Overall this seems like quite a crude solution to me, and I wonder if there isn’t a better way of achieving this. Maybe I overlooked something?)
EDIT:
I got around the issue by using the ViewportManager as recommended and described in Tutorial 06 – Adding Realtime Updates (Scrolling Realtime Charts, see ScrollingViewportManager), though I had to make a change to make it work with my modifiers, which rely on AutoRange being set to “Always” to reset the view to scrolling mode (this way I can reset the x and y axis to extends independently).
private class ScrollingViewportManager : DefaultViewportManager
{
    public Double ViewLimit = 1.0;

    protected override IRange OnCalculateNewXRange(IAxis xAxis)
    {
        DoubleRange dataRange = null;
        if (xAxis.AutoRange == AutoRange.Never) // Zoom/Pan
        {
            dataRange = xAxis?.VisibleRange?.AsDoubleRange();
        }
        else // X-Value limited AutoRange
        {
            dataRange = xAxis?.DataRange?.AsDoubleRange();
            if (dataRange != null)
            {
                dataRange.Min = (dataRange.Max > ViewLimit) ? (dataRange.Max - ViewLimit) : 0.0;
                dataRange.Max = (dataRange.Max == dataRange.Min) ? (dataRange.Min + 1.0) : dataRange.Max;

                Double rangeWidth = dataRange.Max - dataRange.Min;
                dataRange.Min -= (rangeWidth * xAxis.GrowBy.Min);
                dataRange.Max += (rangeWidth * xAxis.GrowBy.Max);
            }
        }
        if (dataRange == null)
            dataRange = new DoubleRange(0.0, ViewLimit);
        return dataRange;
    }
}
…wonder why I didn’t think of checking for AutoRange instead of ZoomState in the ViewportManager earlier.
While I haven’t tested it thoroughly yet, it seems to work the way I intended it to.
The reason I calculate the GrowBy myself is because it otherwise uses the full DataRange (for example if you had a window of 60 seconds, GrowBy of (0.0, 0.1) and 1000 seconds of data, it would move the data completly out of view, “showing” the timespan from 1040 to 1100).
For me the problem is solved by using a better solution to the actual problem. The question why changes to VisibleRange in the DataRangeChanged-event don’t update the chart is still open though, if someone else comes upon this problem.
- Christoph Fleu asked 5 years ago
- last active 5 years ago
I am using a PinchZoomModifier with my chart and I would like to execute some code when the user stops the zooming action (stops touching the screen). Is it possible to do? Are there any listeners I could attach to the PinchZoomModifier? I couldn’t find any in the docs.
- MIha Rozina asked 5 years ago
- last active 5 years ago
NuGet package: 6.0.0.12596-beta (SciChart nightly)
When building a simple WPF NET Core 3.0 app, a native dependency is found to be missing on clean machines (vcomp140.dll).
The only change from the default WPF NET Core 3.0 template, is the addition of the option for Self-Contained-Deployment:
<RuntimeIdentifier>win-x86</RuntimeIdentifier>
(I build for win-x86, since NET Core does not have an Any-CPU equivalent.)
The whole project file for reference:
<Project Sdk="Microsoft.NET.Sdk.WindowsDesktop">

<PropertyGroup>
  <OutputType>WinExe</OutputType>
  <TargetFramework>netcoreapp3.0</TargetFramework>
  <UseWPF>true</UseWPF>
  <RuntimeIdentifier>win-x86</RuntimeIdentifier>
</PropertyGroup>

<ItemGroup>
  <PackageReference Include="SciChart" Version="6.0.0.12596-beta" />
  <PackageReference Include="SciChart.DirectX" Version="6.0.0.12596-beta" />
</ItemGroup>
When doing this, a build will result in the target folder containing: the application, all of the application dependencies (other projects, NuGet packages, references, etc), and all of the needed NET Core run-time files (including a bunch of DLLs that are normally installed by a C++ redistributable, needed for the NET Core run-time to function).
The result is a target folder ranging from about 100 – 200 MB (only about 60 MB compressed) that is ready to run on any clean machine with a minimum OS version of Windows 7 SP1 (with a lot of updates), without having to install a NET run-time or any other system-level dependencies.
When run on a clean machine (I tested with virtual machines for Windows 7 SP1 and Windows 10, with no dev tools installed), a XAML parse exception occurs when the SciChartSurface tries to load the native dependency:
C:\Users\some_user\AppData\Local\SciChart\Dependencies\v6.0.0.12596\x86\VXccelEngine2D.dll
I ran dependency walker on this to find the following dependencies:
c:\windows\system32\D3D9.DLL
c:\windows\system32\D3D11.DLL
c:\windows\system32\D3DCOMPILER_47.DLL
c:\windows\system32\VCOMP140.DLL
c:\windows\system32\KERNEL32.DLL
c:\windows\system32\USER32.DLL
c:\windows\system32\GDI32.DLL
c:\windows\system32\ADVAPI32.DLL
c:\windows\system32\OLE32.DLL
All of these are present on the Windows 7 SP1 (with updates) virtual machine I was running, except for vcomp140.dll. I confirmed that copying the file over from my dev machine to the application folder on the virtual machine caused the error to disappear, and SciChart seems to be working fine now.
For now I will simply add this file as a reference DLL to my project and copy that over, but would it make sense to add this to one of the SciChart NuGet packages in this case? The only problem is you probably wouldn’t want to add it unconditionally, but somehow only for self-contained builds, and there just isn’t a lot of information about self-contained builds at the moment, or how to detect them or anything like that. I suppose a build-time check for the “RuntimeIdentifier” project property would work, as that always results in a self-contained build, but it’s honestly a little hard to say.
- Alicat Developer asked 4 years ago
- last active 4 years ago
I found the example for spline drawing, but it’s still missing the gradient brush that mountain series have, how can I add it? thanks
- jose solorzano asked 4 years ago
- last active 4 years ago
Hello,
I’m evaluating SciChart v6.1 for a WPF realtime charting application.
So far everything has worked well, except some issues with very slow loading.
On my machine, any app referencing SciChart takes around 5-6 seconds to initialize before the app can continue loading.
Some debugging with dotTrace shows most of the time is spent in the constructor of SciChartSurface calling the Charting2DNativeDllsLoader constructor.
dev machine is Windows 10 Pro x64, core i7, 32GB ram
Visual Studio 2019 Pro
To duplicate create new WPF application, .NET Framework v4.8
In MainWindow constructor add two lines:
SciChartSurface.SetRuntimeLicenseKey("[TRIAL KEY]");
var tmp = new SciChartSurface();
Executing the second line takes around 5-6 seconds.
I have uploaded a sample project that duplicates this issue and dotTrace result.
Let me know if I can provide any other info.
- Steven Hansen asked 4 years ago
- last active 4 years ago
I am considering applying server-side licensing for my javerScript application.
In the document below, there is a phrase “Our server-side licensing component is written in C++.”
(https://support.scichart.com/index.php?/Knowledgebase/Article/View/17256/42/)
However, there is only asp.net sample code on the provided github.
(https://github.com/ABTSoftware/SciChart.JS.Examples/tree/master/Sandbox/demo-dotnet-server-licensing)
I wonder if there is a sample code implemented in C++ for server-side licensing.
Can you provide c++ sample code?
Also, are there any examples to run on Ubuntu?
- vaquita50 asked 11 years ago
- last active 9 years ago
I’m looking for some direction on how to implement a modifier that reacts to interaction (mouse up/down etc) with a charts axis
- User clicks on axis
- Provide callback for side effect when clicked
Thanks
- Henrique Rodrigues asked 3 years ago
- last active 3 years ago
Hi,
is there a way to store an additional value to the XyDataSeries.
In my case I want to store some additional information (string) while recording.
Regards Markus
- Rupertsberger Markus asked 10 years ago
- last active 10 years ago
Hi,
I’m trying to implement a market footprint with SciChart framework, I mean is possible create like a plugin for implement in the framework?
My idea was set body color of all the candles invisible and than for every candle set two volume series in horizontal like in the image.
- John Lepre asked 3 years ago
- last active 5 months ago
I have some small chart to show trend data. It flickers when hovering cursor or zooming on it
- Xifeng Wen asked 10 years ago
Hello SciChart-Team,
I noticed that the columns in Sparse Column3D and in Uniform Column 3D always start at the XZ surface. Is there any option or way to do so, that columns always use the zero value of the Y axis as their starting point. The visible range of the axes should correspond to the minimum and maximum Y values.
The current behavior can be reproduced in the example SciChart_UniformColumn3D:
If the VisibleRange of the Y-axis goes from 0 to 0.5 then the columns with negative values go down (see screenshot 1)
As soon as the VisibleRange of the Y-axis goes from -0.5 to 0.5, the columns look like this (Screenshot2) We need the columns to look like in Screenshot 1, only that the Y-axis is also visible downwards.
Can the starting point of the columns be changed?
Best regards
Silvester
- Silvester Schneidt asked 3 years ago
- last active 1 year ago
I am dynamically adding and removing items from an observablecollection of Irenderable series in my viewmodel, and binding it to the renderableseries on the chart surface. However, when I add and remove items that I want to be ordered, and are appropriately ordered in the collection, they are not ordered on the legend.
Is there a way to reorder the series in the legend (MVVM solution would be great)?
You can replicate the issue (or the symptom), by toggling the visibilty of the series in the below example by clicking the checkbox within the legend and then switching the getlegenddatafrom to visible series, and then switch back. (no longer in ABC order).
Thanks,
Jason
- morseja asked 9 years ago
- last active 4 months ago
Hi,
We found that the part of our project that uses scichart does not work correctly on iOS12, and then we tried to open a browser on iOS12 to the scichart javascript demo webpage, and found that it did not work.
What is the minimum iOS version supported by javscript scichart?
- chinghung lai asked 2 years ago
- last active 4 months ago
There is a tabcontrol with two tabitems. Scichart control is in one tabitem, the xy line renderable series of scichart control count is about 5000, and each series has 2000 datas.
At the start, I load and show the scichart curves with loading icon, and it run normally. Then, change to the other tabitem. When I change back to the scichart tabitem , it will taken about 10 secends.
How to reduce the reshow time? Or is there any event occurs when reshow finished which I can used to show loading icon?
- Shao Lin asked 2 years ago
- last active 2 years ago
Hello,
I am trying to change the frequency range in the Y axis on the Heatmap to 100000 from 50000, but the plot does not seem to be working to scale to the proper frequency range on the Y axis. I expect the plot to keep the same scale around 20000 for the upper line when I change the upper scale to 100000, but the graph scales the upper line up to 40000. I’m using function Heatmap2DArrayDataSeries() and passing the series data along with TimeFunc() for mapping to X axis and FreqFunc() for mapping to Y axis. I made some changes to FreqFunc(), but it did not change the upper line to 20000. See below for my partial code. Thanks,
    protected override void OnDisplayLoaded()
    {
    ...
    ...
        _dopplersurface.YAxes[0].VisibleRange = YVisibleRange2; // YVisibleRange2 = {0, 100000}
        _surface.UpdateLayout();

    }

    private void PlotData()
    {
    ...
        ...
        heatmap2DArrayDataSeries = new Heatmap2DArrayDataSeries<DateTime, double, double>(_spectrogramBuffer, TimeFunc, FreqFunc);
        HeatmapRenderableSeries = heatmap2DArrayDataSeries;
    }

    double FreqFunc(int iy)
    {
        double FreqDelta = 1.0 / (time_queue[1] - time_queue[0]).TotalSeconds / (FFT_Points / 2.0);
        if (((FFT_Points / 2.0) * FreqDelta / 2) < (double)YVisibleRange2.Max); // FFT_Points = 1024
        {
            FreqDelta = FreqDelta * 2;
        }
        return iy * FreqDelta / 2; // Returns 0 if iy is 0 and 50000 if iy is 512
    }

    DateTime TimeFunc(int ix)
    {
        if (time_queue.Count > (ix * Step))
        {
            DateTime DateTimeTemp1 = time_queue[ix * Step];
            return DateTimeTemp1;
        }
        else
        {
            return time_queue[time_queue.Count - 1];
        }
    }
- Hoa Duong asked 2 years ago
- last active 2 years ago
I cannot figure out how to setup SciChartSurface so that it would be initialized right away and IsSizeValidForDrawing returned true.
Now I have the special case for the first call to the view with SciChartSurface and I start working with it after receiving SizeChanged event. In this event handler and afterwards IsSizeValidForDrawing gets true and later on all my requests to the view are OK. It’s quite inconvenient.
When does SciChartSurface get resized? What makes it resize?
Which moment does IsSizeValidForDrawing get true?
What should I do to make the size valid after instantiating or receiving first bunch of data ?
How can I make it progmammatically?
This is my xaml:
…
        <s:SciChartSurface.RenderableSeries>
            <s:FastLineRenderableSeries XAxisId="XAxis1" YAxisId="YAxis1" AntiAliasing="False" />
            <s:FastLineRenderableSeries XAxisId="XAxis2" YAxisId="YAxis2" AntiAliasing="False"  />
            <s:FastLineRenderableSeries XAxisId="XAxis1" YAxisId="YAxis1" AntiAliasing="False" />
            <s:FastLineRenderableSeries XAxisId="XAxis2" YAxisId="YAxis2" AntiAliasing="False" />
            <s:FastLineRenderableSeries XAxisId="XAxis1" YAxisId="YAxis1" AntiAliasing="False"/>
            <s:FastLineRenderableSeries XAxisId="XAxis2" YAxisId="YAxis2" AntiAliasing="False"/>
        </s:SciChartSurface.RenderableSeries>

        <s:SciChartSurface.XAxes>
            <s:NumericAxis Id="XAxis1" />
            <s:NumericAxis Id="XAxis2" />
        </s:SciChartSurface.XAxes>

        <s:SciChartSurface.YAxes>
            <s:NumericAxis Id="YAxis1"  />
            <s:NumericAxis Id="YAxis2" />
        </s:SciChartSurface.YAxes>
    </s:SciChartSurface>

    <Grid Grid.Row="1" x:Name="myOverviews">
        <Grid.RowDefinitions>
            <RowDefinition Height="*" />
            <RowDefinition Height="*" />
        </Grid.RowDefinitions>

        <s:SciChartOverview  Grid.Row="0"
                    XAxisId="XAxis1"
                    ParentSurface="{Binding ElementName=mySurface}"
                    DataSeries="{Binding ElementName=mySurface, Path=RenderableSeries[4].DataSeries}"
                    SelectedRange="{Binding ElementName=mySurface, Path=XAxes[0].VisibleRange, Mode=TwoWay}"
                    Visibility ="Collapsed"
                    s:ThemeManager.Theme="BlackSteel">
        </s:SciChartOverview>

        <s:SciChartOverview Grid.Row="1"
                    XAxisId="XAxis2"
                    ParentSurface="{Binding ElementName=mySurface}"
                    DataSeries="{Binding ElementName=mySurface, Path=RenderableSeries[4].DataSeries}"
                    SelectedRange="{Binding ElementName=mySurface, Path=XAxes[1].VisibleRange, Mode=TwoWay}"
                    Visibility ="Collapsed"
                    s:ThemeManager.Theme="BlackSteel">
        </s:SciChartOverview>
    </Grid>
All visibilities besides SciChartSurface are “Collapsed”
SciChart version 3.1.0.5077
Thank you
- Anton Kochepasov asked 9 years ago
- last active 9 years ago
Please look at screenshot. There is SeriesValueModifier with 27.68 price, but it is not fit into YAxis. Questinos:
1) How can I bind YAxis width to always fit SeriesValueModifier ?
2) How can I set font size and text formatting for value in SeriesValueModifier , not changing text on YAxis labels?
- RTrade A asked 9 years ago
- last active 9 years ago
Trying to install SciChart using the PodSpecs-Nightly repo:
source ‘https://github.com/ABTSoftware/PodSpecs-Nightly.git’
Running pod install results in this error:
[!] Error installing SciChart
[!] /usr/bin/curl -f -L -o /var/folders/mr/0skn4y5d1t99bcvzd09g_wdr0000gn/T/d20221220-30745-gfzfrf/file.zip https://github.com/ABTSoftware/PodSpecs-Nightly/releases/download/v4.4.1-nightly.5867/SciChart_iOS_4.4.1-nightly.5867.zip --create-dirs --netrc-optional --retry 2 -A 'CocoaPods/1.11.3 cocoapods-downloader/1.6.3'
curl: (22) The requested URL returned error: 404
Notice the word “SDK” is missing from the URL above. The correct URL should be:
- Michael Chartier asked 1 year ago
- last active 1 year ago
From what I’ve read into chrome’s roadmap, everything seems on track for a webgpu release in May.
Is scichart taking this into account and planning to add webgpu support?
I suspect this would make quite an impact on performance, so it would be a great addition.
Thanks!
- João Velasques asked 1 year ago
- last active 1 year ago
Hello,
How would I go about creating a modifier (or extending an existing one?) that will allow the user to doubleclick on the y-axis to set the y-axis extents to the y-values in the visible x-range? can I capture a doubleclick on the y-axis?
I would like to reserve the doubleclick on the surface for other features, that’s why I don’t use the zoomextents modifier.
Thank you
Mathias
- Mathias Vanden Auweele asked 9 years ago
- last active 9 years ago
The console prints an exception when I zoom in and out with the mouse wheel:
SciChartSurface didn’t render, because an exception was thrown:
Message: Arrays yValues and indexes must have the same length
Stack Trace: at swb.iwb(Int32 bij, String bik, Int32 bil, String bim)
at SciChart.Data.Model.UniformXyPointSeries..ctor(Double xStart, Double xStep, Values1 yValues, Values1 indexes)
at SciChart.Charting.Visuals.RenderableSeries.DrawingProviders.PointMarkerDrawingProvider1.OnDraw(IRenderContext2D renderContext, IRenderPassData renderPassData)1 enumerable, Action`1 operation)
at SciChart.Core.Extensions.EnumerableExtensions.ForEachDo[T](IEnumerable
at SciChart.Charting.Visuals.RenderableSeries.BaseRenderableSeries.InternalDraw(IRenderContext2D renderContext, IRenderPassData renderPassData)
at SciChart.Charting.Visuals.RenderableSeries.BaseRenderableSeries.SciChart.Charting.Visuals.IDrawable.OnDraw(IRenderContext2D renderContext, IRenderPassData renderPassData)
at ebu.toj(RenderPassInfo gj, IRenderContext2D gk, Int32 gl)
at ebu.toi(ISciChartSurface gg, RenderPassInfo gh, IRenderContext2D gi)
at ebu.RenderLoop(IRenderContext2D renderContext)
at SciChart.Charting.Visuals.SciChartSurface.DoDrawingLoop()
Here is a simple example program uploaded.
- hundun wds asked 12 months ago
- last active 12 months ago
Following the “How to Template the Axis Title” sample and using a simple TextBlock with TextWrapping=”Wrap” I am seeing strange resizing of the main chart elements especially with a scrollbar.
The attached image shows an example app (code available).
The first chart is normal (title clipped).
The second chart has the wrapping textblock and a scrollbar. The scrollbar is off the edge, the chart view area is off the edge. The entire axis label is still not visible (“Lorem ipsum dolor sit amet, consectetur”)
The third chart has no scrollbar so fits elements on the window, but still does not show all text.
The components creeping offscreen is the big problem I cannot figure out how to fix. Please
Note also happens in v7
- Dave Speight asked 11 months ago
- last active 10 months ago
Hello,
Python with Matplotlib allows us to draw a line series that has multiple color depending on something else as shown below (https://matplotlib.org/3.3.0/gallery/lines_bars_and_markers/multicolored_line.html):
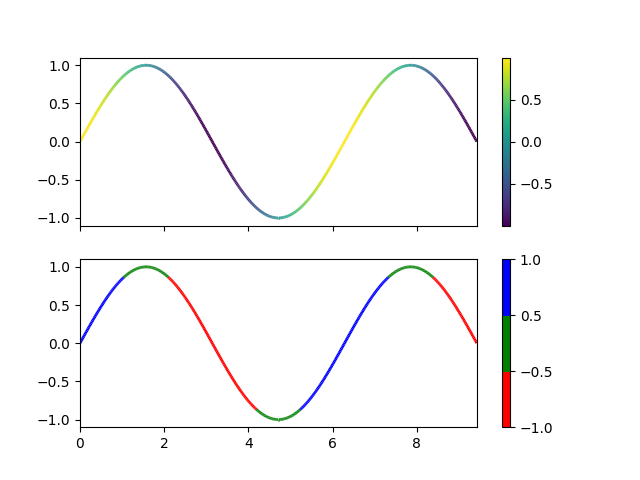
Is it possible with SciChart (WPF version)?
- Tetsu Shimizu asked 10 months ago
- last active 10 months ago
Hi, I have an issue where I am trying to create multiple xAxes where one is normal and the rest are horizontally stacked. Then I calculate the stacked length of each stacked axes, but the issue comes when I change the width of the chart or inspect element, which would alter the width of the chart somehow, I got error saying the total width of the stacked axes is bigger than available size.
I have a codesanbox example of it:
https://codesandbox.io/s/scichart-stacked-xaxis-stacked-length-issue-3knt23?file=/src/App.tsx
I am using percentage for the stacked xAxes length and then I added them up to be 100% total, but somehow it is saying that it is more than available size.
So, my question is, how can I listen or get the width/size changes event of the chart/xAxis, so that I can calculate accordingly?
- Nung Khual asked 9 months ago
- last active 8 months ago
Hi,
Could anyone explain me what’s that about these errors?
‘Mocks_SciChart_Charting_Visuals_SciChartOverview_0_166924839_8_24014362’ TargetType does not match type of element ‘SciChart_Charting_Visuals_SciChartOverview_0_166924839’
The value “Spectrium.Chart.Modifiers.Spectrogram.SpectrogramSelectionModifier” is not of type “Mocks.SciChart_Charting_ChartModifiers_IChartModifier_0_166924839” and cannot be used in this generic collection.
The first one is caused by
<LinearGradientBrush x:Key="MountainAreaBrush" StartPoint="0,0" EndPoint="0,1">
    <GradientStop Offset="0" Color="#33006400" />
    <GradientStop Offset="1" Color="#E5006400" />
</LinearGradientBrush>

<Style x:Key="OverviewScrollbarStyle" TargetType="s:SciChartScrollbar">
    all setters are omited for brevity
</Style>

<Style x:Key="OverviewStyle" TargetType="s:SciChartOverview"> <-- this style cause an error
    <Setter Property="Fill" Value="{StaticResource MountainAreaBrush}"/>
    <Setter Property="ScrollbarStyle" Value="{StaticResource OverviewScrollbarStyle}"/>
    <Setter Property="Stroke" Value="#FF279B27"/>
</Style>
The second by
<s:SciChartSurface.ChartModifier>
    <s:ModifierGroup s:MouseManager.MouseEventGroup="CustomGroup">
        <m:SpectrogramSelectionModifier/>
    </s:ModifierGroup>
</s:SciChartSurface.ChartModifier>
Of course “m” namespace is defined.
After building all these errors disappear but just right after I click on .xml file int the solution explorer the errors are shown again.
Best regards
Mark
- Marek Sienczak asked 8 years ago
- last active 8 years ago
Hi SciChart,
We are experiencing a SciChart XPS export issue.
I am using a FlowDocumentPageViewer with a FlowDocument containing SciChart graphs. My goal is to export all pages of the FlowDocument to an XPS file using the XamlRenderSurface to save in vector graphics. However, I’m facing an issue where only the currently selected page exports correctly, while the other pages display empty graphs.
By default, we employ the VisualXcceleratorRenderSurface for all SciChart render surfaces. Before exporting, I programmatically switch them to XamlRenderSurface to save in vector graphics. This approach works well when all the graphs have been rendered on-screen at least once with the new surface type before exporting. However, if a graph hasn’t been rendered on-screen before exporting, it appears empty, and only the graphs from the selected page export correctly. You can find code snippets below.
XAML code:
<s:SciChartSurface
    x:Name="PART_Surface"
    ...
    RenderSurface="{TemplateBinding RenderType, Converter={StaticResource RenderTypeConverter}}"
    ...
Converter:
public class RenderTypeConverter : IValueConverter
{
    public object Convert(object value, Type targetType, object parameter, CultureInfo culture)
    {
        // Set render settings
        return (RenderType)value switch
        {
            RenderType.DirectX => new VisualXcceleratorRenderSurface(),
            RenderType.HighQuality => new HighQualityRenderSurface(),
            RenderType.HighSpeed => new HighSpeedRenderSurface(),
            RenderType.Vector => new XamlRenderSurface(),
            _ => new HighSpeedRenderSurface(),
        };
    }
    ...
}
Export:
private void ExportVector(string fullPath)
{
    // Sets the RenderType to Vector for all surfaces
    // This invokes RenderTypeConverter to set the RenderSurface to XamlRenderSurface
    // Since they are bound in the XAML code
    SetAxesSurfacesRenderToVector();

    XPS_Export_AllPagesOfFlowDocument(fullPath);

    // DirectX is always the default for all surfaces that we use
    ResetAxesSurfacesToDirectX();
}
private void XPS_Export_AllPagesOfFlowDocument(string fullPath)
{
    using (var package = Package.Open(fullPath, FileMode.Create))
    {
        using (var xpsDocument = new XpsDocument(package, CompressionOption.Maximum))
        {
            var xpsSerializationManager = new XpsSerializationManager(new XpsPackagingPolicy(xpsDocument), false);
            var documentPaginator = ((IDocumentPaginatorSource)FlowDocument)?.DocumentPaginator;
            xpsSerializationManager.SaveAsXaml(documentPaginator);

            xpsDocument.Close();
        }
    }
}
The binding and the converter works for all offscreen elements, yet the they won’t take effect until rendered on screen at least once.
I have to select each page manually, after setting all graphs to use XamlRenderSurface, so each would be rendered on screen at least once before the export.
My question is: How can I export XamlRenderSurfaces that are off-screen and haven’t been rendered on-screen before the export process?
You can find an image below showcasing the problem.
Thank you and looking forward to your reply!
Best Regards,
Kaloyan Krastev
- Kaloyan Krastev asked 8 months ago
- last active 6 months ago
I’ve got a dashboard implemented with stacked bar charts that are not very big. I added the RolloverModifier to show some relevant data for each bar and set the ClipToBounds property to false.
It works fine when the stacked bar chart doesn’t have too many series (see attached image). I just wanted to resize the font and use only one line for each value, instead of name on one line and value on another.
I’ve tried setting the font size property (and others) but it didn’t work.
Thanks for your help.
Andre
- andrecsa asked 8 years ago
- last active 8 years ago
I want to be able to disable a chart if there is no data on it, and then enable the chart when there is data. The reason why I want to do that is because I have three charts that are sync and I want to disable the other charts that have no data, so that the cursor modifier or the zooming and stuff will not affect the other charts without data and will only affect the one with data.
Attached image is 3 charts that are in sync.
- Nung Khual asked 6 months ago
- last active 6 months ago
Hi.
My colleagues have used on their WPF application SciChartScrollbar to select a portion of a created graph. I want to use the same behavior on Xamarin.Android. What can I use to have the same effect?
Thank you.
- Victor Boieru asked 5 months ago
- last active 3 months ago
Hi,
is it possible to style (dashed lines) just a segment of the line in a line chart?
- Aysan Afrand asked 8 years ago
- last active 8 years ago
I want to configure the chart as shown in the image.
How should I code to implement the same image in SciChart?
- Jeong HaMin asked 4 months ago
- last active 4 months ago
I want to make label on yAxis.
SCIChart provides AxisMarkerAnnotation, but I want to use CustomAnnotation because I need something custom.
So I tried drawing a CustomAnnotation on the yAxis but failed.
Android succeeds in drawing CustomAnnotation on the yAxis using the method below, but iOS doesn’t provide it?
On iOS, Can’t customAnnotation only set the value of the yAxis like AxisMarkerAnnotation?
Android was possible…
error message like this
Exception raised with reason: CALayer position contains NaN: [nan 248.71]. Layer: <CALayer:0x280c10bc0; position = CGPoint (0 0); bounds = CGRect (0 0; 0 0); delegate = <BTChart.CurrentPriceAnnotationView: 0x13d74d8f0; frame = (0 0; 0 0); layer = <CALayer: 0x280c10bc0>>; sublayers = (<_UILabelLayer: 0x282d15860>); opaque = YES; allowsGroupOpacity = YES; >
- Junyoung Kang asked 3 months ago
- last active 2 months ago
Hi there,
Here is my xaml setting :
 <s:SciStockChart.XAxisStyle>
     <Style TargetType="s:CategoryDateTimeAxis">
         <Setter Property="VisibleRange" Value="{Binding ParentViewModel.XRange}" />
         <Setter Property="AutoRange" Value="{Binding ParentViewModel.AutoRangeX}"/>
     </Style>
 </s:SciStockChart.XAxisStyle>
And I also set, XRange = new IndexRange(0, 9), AutoRangeX = AutoRange.Never, but the chart show like image, always has gap there.
What should I do?
- CHIA CHUN TANG asked 1 month ago
- last active 1 month ago
I am trying to use the Box plot type to render a gantt-style chart. The intention is to set the Median, lowerQuartile and Min all to the start time values, and the upperQuartile and Max to the End times.
The trouble, as I think I have found, is that the model doesn’t support DateTime as the type for the YAxis values. Using the Box Chart example in the demo suite for inspiration, I have two very stripped down charts on my page:
 <s:SciChartSurface x:Name="ganttChart" BorderThickness="0" Padding="0" Grid.Row="0">
      <s:SciChartSurface.RenderableSeries>
           <s:FastBoxPlotRenderableSeries x:Name="ganttSeries" />
      </s:SciChartSurface.RenderableSeries>
      <s:SciChartSurface.XAxis>
           <s:NumericAxis/>
      </s:SciChartSurface.XAxis>
      <s:SciChartSurface.YAxis>
           <s:DateTimeAxis/>
      </s:SciChartSurface.YAxis>
 </s:SciChartSurface>

 <s:SciChartSurface x:Name="sciChart" Grid.Column="1" BorderThickness="0" Padding="0" Grid.Row="1">
      <s:SciChartSurface.RenderableSeries>
           <s:FastBoxPlotRenderableSeries x:Name="boxSeries" />
      </s:SciChartSurface.RenderableSeries>
      <s:SciChartSurface.XAxis>
           <s:DateTimeAxis />
      </s:SciChartSurface.XAxis>
      <s:SciChartSurface.YAxis>
           <s:NumericAxis />
      </s:SciChartSurface.YAxis>
 </s:SciChartSurface>
I then populate them appropriately:
    private void MainWindow_Loaded(object sender, RoutedEventArgs e)
    {
        var ganttDataSeries = new BoxPlotDataSeries<double, DateTime>();
        var ganttData = GetGanttPlotData().ToArray();

        ganttSeries.DataSeries = ganttDataSeries;
        ganttDataSeries.Append(ganttData.Select(x => x.X),
                    ganttData.Select(x => x.Median),
                    ganttData.Select(x => x.Minimum),
                    ganttData.Select(x => x.LowerQuartile),
                    ganttData.Select(x => x.UpperQuartile),
                    ganttData.Select(x => x.Maximum));

        var boxData = GetBoxPlotData().ToArray(); // this is the same implementation as the demo
        var boxDataSeries = new BoxPlotDataSeries<DateTime, double>();
        boxDataSeries.Append(boxData.Select(x => x.Date),
            boxData.Select(x => x.Median),
            boxData.Select(x => x.Minimum),
            boxData.Select(x => x.LowerQuartile),
            boxData.Select(x => x.UpperQuartile),
            boxData.Select(x => x.Maximum));

        boxSeries.DataSeries = boxDataSeries;
    }

    private IEnumerable<GanttPoint> GetGanttPlotData()
    {
        var xValues = Enumerable.Range(1, 10).ToArray();

        var random = new Random();

        for (int i = 0; i < 10; i++)
        {
            DateTime med = new DateTime(2016, 1, 1).AddDays(random.Next(31, 330));
            DateTime min = med.AddDays(-1 * random.Next(30));
            DateTime max = med.AddDays(random.Next(30));
            DateTime lower = min.AddDays((med - min).TotalDays * random.NextDouble());
            DateTime upper = max.AddDays(-1 * ((max - med).TotalDays * random.NextDouble()));

            Console.WriteLine($"Median:{med} Min:{min} Max:{max} Lower:{lower} Upper:{upper}");
            yield return new GanttPoint(xValues[i], min, lower, med, upper, max);
        }
    }

    private struct GanttPoint
    {
        public readonly double X;
        public readonly DateTime Minimum;
        public readonly DateTime LowerQuartile;
        public readonly DateTime Median;
        public readonly DateTime UpperQuartile;
        public readonly DateTime Maximum;

        public GanttPoint(double x, DateTime min, DateTime lower, DateTime med, DateTime upper, DateTime max)
            : this()
        {
            X = x;
            Minimum = min;
            LowerQuartile = lower;
            Median = med;
            UpperQuartile = upper;
            Maximum = max;
        }
    }
The attached image is what renders. Is there a reason for this behavior? I was really hoping to use this plot type to support the floating bars use case. I can make a custom renderable series to achieve the result, but that seems like a lot of work.
Please advise.
Thanks,
Mike.
- Michael Dusoe asked 8 years ago
- last active 6 years ago
I have created a 3D surface mesh successfully and now I want to plot a data series on the mesh. The inputs to the data series are 2D (X,Y) with the Z axis value always being directly on the mapped 3D surface point at the specified X,Y position.
I am trying to populate a XyzDataSeries3D() collection like so…
var xyzData = new XyzDataSeries3D();
xyzData.Append(x, y, z);
How to I determine the Z value given I have the X and Y values? Is there a built-in method for determining this or do I need to do it myself?
Thanks.
Gareth.
- Gareth Parris asked 7 years ago
- last active 7 years ago
Hi – I have a scrolling sine wave and would like to put a numeric value at the high point of each peak. Is this possible? I’ve attached a pic of what I need. ty
- Paul Richardson asked 7 years ago
- last active 7 years ago
