I have created a demo app with the relevant code.
I have a tab control with 2 tabs, each one with a version of the SciChart surface showing multiple graphs stacked on top of each other.
The first (LAT) uses the standard WPF ListBox with each item contains a surface.
The second (ECG) uses a vertically stacked YAxis (from the customer examples).
Scenario
Select the second tab (ECG).
Press the Create button to create 50 waveforms.
(note – only a single graph is created)
Select the first tab, then select the 2nd tab.
(all 50 graphs are created)
HELP
I am unable to upload the .zip file (with the demo) or an images.
I select the file – but it does not upload
- Craig Wooldridge asked 9 months ago
- last active 9 months ago
Code changes :
– Grab the SciChart_ScatterChart example
 <s:SciChartSurface Name="sciChart"
                Grid.Column="1"
                Padding="0"
                BorderThickness="0">

 <s:SciChartSurface.RenderableSeries>
     <s:XyScatterRenderableSeries x:Name="scatterRenderSeries0"
                                  Opacity="0.67">
         <s:XyScatterRenderableSeries.PointMarker>
             <s:EllipsePointMarker Width="14"
                                   Height="14"
                                   Fill="{StaticResource PointMarkerFillColor}"
                                   StrokeThickness="0" />
         </s:XyScatterRenderableSeries.PointMarker>
     </s:XyScatterRenderableSeries>
 </s:SciChartSurface.RenderableSeries>

 <s:SciChartSurface.XAxis>
     <s:NumericAxis DrawMajorBands="True"
                    GrowBy="0.1, 0.1"
                    VisibleRangeLimit="0, 0"
                    VisibleRangeLimitMode="Min" />
 </s:SciChartSurface.XAxis>

 <s:SciChartSurface.YAxis>
     <s:NumericAxis DrawMajorBands="True"
                    GrowBy="0.1, 0.1"
                    VisibleRangeLimit="0, 0"
                    VisibleRangeLimitMode="Min" />
 </s:SciChartSurface.YAxis>

 <s:SciChartSurface.ChartModifier>
     <s:ModifierGroup>
         <s:ZoomPanModifier ClipModeX="ClipAtMin" />
         <s:MouseWheelZoomModifier />
     </s:ModifierGroup>
 </s:SciChartSurface.ChartModifier>
Repro steps :
- Zoom out using the wheel
- Try to pan
- Notice that it appears to apply an unwanted zoomToExtents operation
Can I also ask why there is still no ClipModeY for the ZoomPanModifier? there are a few posts relating to this with workarounds, but none of them seem to work as far as I can tell without weird side affects.
- Ben Green asked 9 months ago
- last active 9 months ago
I’m experimenting with creating a CustomRenderableSeries.
I was expecting VisualXcceleratorRenderSurface to perform the fastest. But what I am finding is that it is noticeably slower than XamlRenderSurface. By slower, I mean interaction with zoom/pan becomes choppy and resizing the window is choppy. Which is surprising because I’m really not rendering much at all.
We plan on rendering a lot more than this, but it already appears to struggling. Can you shed some light?
public class MyDataSeries : XyDataSeries<double>
{
    public MyDataSeries()
    {

    }
}

public class MyRenderableSeries : CustomRenderableSeries
{
    public MyRenderableSeries()
    {

    }

    protected override void Draw(IRenderContext2D renderContext, IRenderPassData renderPassData)
    {
        base.Draw(renderContext, renderPassData);

        if (DataSeries is not MyDataSeries series)
            return;

        using (var brush = renderContext.CreateBrush(Brushes.Red))
        using (var pen = renderContext.CreatePen(Colors.Black, true, 1))
        {
            for (int i = 0; i < series.Count; ++i)
            {
                double pos = (double)series.XValues[i];

                var x = renderPassData.XCoordinateCalculator.GetCoordinate(pos);
                var y = renderPassData.YCoordinateCalculator.GetCoordinate(pos);
                var s = renderPassData.XCoordinateCalculator.GetCoordinate(0) - renderPassData.XCoordinateCalculator.GetCoordinate(1);

                var points = CreateCircle(new Point(x, y), s);
                renderContext.FillPolygon(brush, points);
            }
        }
    }

    private List<Point> CreateCircle(Point pos, double radius)
    {
        var points = new List<Point>();

        int count = 1000;
        for (int i = 0; i < count; ++i)
        {
            double angle = (360.0 / count * i) * (Math.PI / 180);
            double x = Math.Cos(angle) * radius;
            double y = Math.Sin(angle) * radius;

            points.Add(new Point(pos.X + x, pos.Y + y));
        }

        points.Add(points[0]);

        return points;
    }
}

public class MyRenderableSeriesViewModel : BaseRenderableSeriesViewModel
{
    public override Type ViewType => typeof(MyRenderableSeries);
}

public class MyViewModel : BaseViewModel
{
    public List<IRenderableSeriesViewModel> RenderableSeriesViewModels { get; }

    public MyViewModel()
    {
        RenderableSeriesViewModels = new List<IRenderableSeriesViewModel>
        {
            Generate(Enumerable.Range(0, 25).Select(x => (double)x).ToArray()),
        };
    }

    private IRenderableSeriesViewModel Generate(double[] data)
    {
        var dataSeries = new MyDataSeries();
        dataSeries.Append(data, data);

        return new MyRenderableSeriesViewModel
        {
            DataSeries = dataSeries,
            StyleKey = "mySeriesStyle"
        };
    }
}


<UserControl x:Class="SciChart.Examples.Examples.SeeFeaturedApplication.Histogram.ViolinView"
         xmlns="http://schemas.microsoft.com/winfx/2006/xaml/presentation"
         xmlns:s="http://schemas.abtsoftware.co.uk/scichart"
         xmlns:d="http://schemas.microsoft.com/expression/blend/2008"
         xmlns:x="http://schemas.microsoft.com/winfx/2006/xaml"
         xmlns:mc="http://schemas.openxmlformats.org/markup-compatibility/2006"
         xmlns:local="clr-namespace:SciChart.Examples.Examples.SeeFeaturedApplication.Histogram"
         mc:Ignorable="d">

<UserControl.Resources>
    <ResourceDictionary>
        <ResourceDictionary.MergedDictionaries>
            <ResourceDictionary Source="/SciChart.Charting;component/Themes/Default.xaml" />
        </ResourceDictionary.MergedDictionaries>

        <Style TargetType="{x:Type local:MyRenderableSeries}"
               BasedOn="{StaticResource MvvmDefaultRenderableSeriesStyle}"
               x:Key="mySeriesStyle">
        </Style>
    </ResourceDictionary>
</UserControl.Resources>

<s:SciChartSurface x:Name="SciChart"
                   RenderableSeries="{s:SeriesBinding RenderableSeriesViewModels}">
    <s:SciChartSurface.RenderSurface>
        <s:VisualXcceleratorRenderSurface />
    </s:SciChartSurface.RenderSurface>

    <s:SciChartSurface.XAxis>
        <s:NumericAxis />
    </s:SciChartSurface.XAxis>

    <s:SciChartSurface.YAxis>
        <s:NumericAxis />
    </s:SciChartSurface.YAxis>
    <s:SciChartSurface.ChartModifier>
        <s:ModifierGroup>
            <s:ZoomPanModifier />
            <s:RubberBandXyZoomModifier ExecuteOn="MouseRightButton" />
            <s:ZoomExtentsModifier ReceiveHandledEvents="False" />
            <s:MouseWheelZoomModifier />
        </s:ModifierGroup>
    </s:SciChartSurface.ChartModifier>
</s:SciChartSurface>
I have tested this on 3 machines, and all show the same behaviour.
**VisualXcceleratorEngine: Creating VisualXcceleratorRenderSurface Visual Xccelerator Engine v7.0.1.27055
GPU Capability Test ### Is BGRA feature required: TRUE
Examining Graphics Adapter: Intel(R) Iris(R) Xe Graphics VRAM:
128Mb DeviceId: 39497Visual Xccelerator Engine Direct3D9 Compatibility
Determines whether the adapter is blacklisted due to its unstable work… FALSE
Trying to create Direct3D9 Device… SUCCESSVisual Xccelerator Engine Direct3D11 Compatibility
Trying to create Direct3D9Ex Device (WPF Compatibility)… SUCCESS
Trying to create Direct3D11 Device… SUCCESSRank: 3000128 Points
Examining Graphics Adapter: NVIDIA T500 VRAM: 1928Mb DeviceId:
8123Visual Xccelerator Engine Direct3D9 Compatibility
Determines whether the adapter is blacklisted due to its unstable work… FALSE
Trying to create Direct3D9 Device… FAILEDVisual Xccelerator Engine Direct3D11 Compatibility
Trying to create Direct3D9Ex Device (WPF Compatibility)… FAILED
Trying to create Direct3D11 Device… SUCCESSRank: 3001928 Points
Examining Graphics Adapter: Microsoft Basic Render Driver VRAM: 0Mb
DeviceId: 140Visual Xccelerator Engine Direct3D9 Compatibility
Determines whether the adapter is blacklisted due to its unstable work… FALSE
Trying to create Direct3D9 Device… FAILEDVisual Xccelerator Engine Direct3D11 Compatibility
Trying to create Direct3D9Ex Device (WPF Compatibility)… FAILED
Trying to create Direct3D11 Device… SUCCESSRank: 2000000 Points
Selected Graphics Adapter, where DeviceId is: 8123 Is Direct3D9
Supported: FALSE Is Direct3D11 Supported: TRUE Is Blacklisted:
FALSEPlease find the log file here:
C:\dev\TestApps\SciChart_Violin\bin\Debug\net6.0-windows\GpuCapability.log**VisualXcceleratorEngine: SUCCESS! VisualXcceleratorRenderSurface: attempt to initialize the engine with parameters: Use Direct3D9 –
False
- Ben Green asked 9 months ago
- last active 8 months ago
I am working on a multithreaded application where the acquisition and chart display run on different threads. I am attempting to collect samples and plot only when I have 100 samples available to have less resource consumption and keep the application responsive. However, when I change the number of samples in the block, my FIFO capacity seems to change, allowing significantly less amount of samples than the ones I need. The current FIFO capacity should allow for at least 16 mins worth of data, but it only shows less than a second
If I set the block size to 1 (single sample appending) I obtain the results I need, but I am seeing performance issues in other areas of the program, hence the need of appending in blocks.
See the attachments for more clarity. Any suggestions?
EDIT: Adding code
private void DisplayNPD()
        {
            XyDataSeries<float, float> npdRawDataSeries = new XyDataSeries<float, float>();
            int fifoSize = 1000000;
            npdRawDataSeries.FifoCapacity = fifoSize;
            npdRawData_RS.DataSeries = npdRawDataSeries;

            double npdRaw = 0;
            bool successfulDequeue = false;
            int samplesQueued = 0;
            int samplesInBlock = 100;
            float[] rawSamples = new float[samplesInBlock];
            float[] time = new float[samplesInBlock];

            while (!ImagingSession.terminateThreads)
            {
                if (ImagingSession.laserOnOff && !graphRestarted)
                {
                    int npdElementsInQueue = npdDisplayQueue.Count;
                    if (npdElementsInQueue > 0)
                        successfulDequeue = npdDisplayQueue.TryDequeue(out npdRaw);

                    if (successfulDequeue)
                    {
                        currentTime = graphStopwatch.ElapsedMilliseconds * 0.001;
                        time[samplesQueued] = (float) currentTime;
                        rawSamples[samplesQueued] = (float) (npdRaw * 1000);

                        samplesQueued++;
                        if (samplesQueued == samplesInBlock)
                        {
                            using (npdRawDataSeries.SuspendUpdates())
                                npdRawDataSeries.Append(time, rawSamples);
                            samplesQueued = 0;

                            if (currentTime > upperLimit)
                            {
                                lowerLimit = upperLimit;
                                upperLimit += xAxisWidth;
                                AdjustXAxis(currentHorizontalScale);
                            }
                        }
                    }
                }
            }
        }
- Matthew Beatty asked 9 months ago
- last active 9 months ago
I used an IPointMarkerPaletteProvider to change the color of the bubble chart to a solid color. However, the circles are not smooth around the perimeter, and they look very stepped. The same thing happens when I set the AntiAliasing property of the FastBubbleRenderableSeries to True. How can I make it a smooth circle?
- sungchul park asked 9 months ago
- last active 9 months ago
I want the bubbles in my bubble chart to be one color with no gradient, and I also want to color the border line. How can I do this?
- sungchul park asked 9 months ago
- last active 9 months ago
Hi,
All MyGet systems which host the SciChart nuget feeds are down: https://status.myget.org/
Does someone know where to report this issue and how to get any more information on this downtime? E.g. is it planned and is there an estimate how long this is going to take?
Thanks!
- Christian Liebhardt asked 9 months ago
- last active 9 months ago
My application is written in .net 7 wpf using scichart will the application work on linux with scichart?
- Бектемир v asked 9 months ago
- last active 9 months ago
Is it possible to draw a graph without passing values to other charts just by doing RenderableSeries.Add?
in WPF C#
- SEONG JEONGWOO asked 10 months ago
- last active 9 months ago
I created a simple .NET6 WPF application and added the SciChart assembly references. I call SciChartSurface.SetRuntimeLicenseKey(…) in App constructor and run the application. I get the following exception:
*System.TypeInitializationException: The type initializer for ‘njm’ threw an exception. Source=SciChart.Core
Inner Exception 1:
InvalidOperationException: babel m0 7238858: Method not found: ‘System.Reflection.Emit.AssemblyBuilder System.AppDomain.DefineDynamicAssembly(System.Reflection.AssemblyName, System.Reflection.Emit.AssemblyBuilderAccess)’.
Inner Exception 2:
MissingMethodException: Method not found: ‘System.Reflection.Emit.AssemblyBuilder System.AppDomain.DefineDynamicAssembly(System.Reflection.AssemblyName, System.Reflection.Emit.AssemblyBuilderAccess)’.*
Everything works well if I use SciChart in a .NET4.8 WPF application. How can I fix this? Thanks.
- Marius Cabas asked 10 months ago
- last active 10 months ago
We’re working on a Nyquist plot using the latest SciChart SDK for WPF.
We have quite a MVVM dependent structure already in place.
We are working with 3D frequency based Complex data. The Nyquist plot would have 2 axes – Y for Imaginary values and X axis for Real values. We apply some averaging and post-processing of the 3D data to put in 2D form and show it in the Nyquist plot.
However, we’d like to be able to scroll the data at certain frequency ranges without showing the actual frequency graph in the plot. Is there a possibility to implement an independent scrollbar containing a averaged magnitude graph (similar idea to the processing of the Nyquist data) over a frequency range? We’d like to scroll this frequency range and on selected range changed to recalculate data in the Nyquist plot.
We have quite an extensive graphing structure implemented already. The main issue I’m currently facing is that the scrollbar is bound to the SciChartSurface and I cannot seem to figure out how to build it more like a “sexy” frequency range selector while staying within the SciChart library? Is there any possibility to not be bound to the SciChartSurface? And of course, the axes are quite different – in the Nyquist we have linear real and imaginary values (-2 to +2, for example) whereas the frequency range would extend much further data-wise (0 – 3000 Hz, for example).
Any help would be appreciated. Feel free to ask for more details.
- Kaloyan Krastev asked 10 months ago
- last active 3 months ago
Hello,
Python with Matplotlib allows us to draw a line series that has multiple color depending on something else as shown below (https://matplotlib.org/3.3.0/gallery/lines_bars_and_markers/multicolored_line.html):
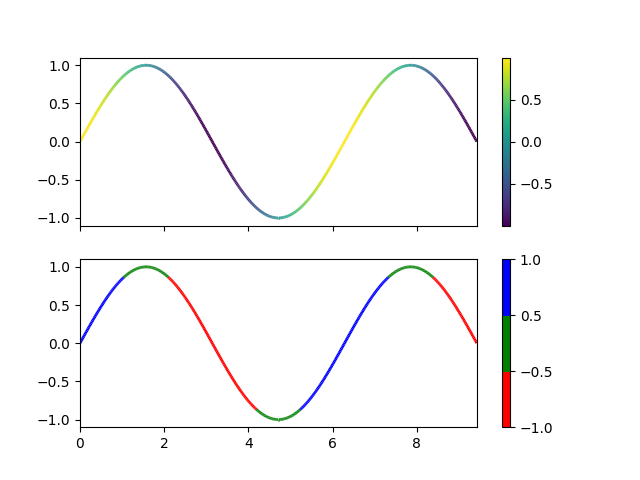
Is it possible with SciChart (WPF version)?
- Tetsu Shimizu asked 10 months ago
- last active 10 months ago
Hello.
In my project, I am trying to display four SciChartSurfaces with a single legend. Furthermore, I want the Visibility changes of each series in the legend checkbox to be reflected in all SciChartSurfaces.
The following code achieves this, but I am not confident that it is the best solution. Is there a more Smart way to accomplish this?
MainWindow.xaml
<Window x:Class="SurveyFleetVisionChartLegend.MainWindow"
    xmlns="http://schemas.microsoft.com/winfx/2006/xaml/presentation"
    xmlns:x="http://schemas.microsoft.com/winfx/2006/xaml"
    xmlns:d="http://schemas.microsoft.com/expression/blend/2008"
    xmlns:local="clr-namespace:SurveyFleetVisionChartLegend"
    xmlns:mc="http://schemas.openxmlformats.org/markup-compatibility/2006"
    xmlns:s="http://schemas.abtsoftware.co.uk/scichart"
    Title="MainWindow"
    Width="800"
    Height="550"
    d:DataContext="{d:DesignInstance {x:Type local:MainWindowViewModel}}"
    mc:Ignorable="d">

<Window.DataContext>
    <local:MainWindowViewModel />
</Window.DataContext>
<Window.Resources>
    <BooleanToVisibilityConverter x:Key="BooleanToVisibilityConverter" />
</Window.Resources>
<Grid>
    <Grid.RowDefinitions>
        <RowDefinition />
        <RowDefinition />
        <RowDefinition />
        <RowDefinition />
        <RowDefinition Height="auto" />
    </Grid.RowDefinitions>

    <s:SciChartSurface Grid.Row="0"
                       Margin="5"
                       VerticalAlignment="Stretch"
                       Background="WhiteSmoke"
                       CacheMode="{x:Null}"
                       ChartTitle="SciChartSurface1"
                       RenderableSeries="{s:SeriesBinding GraphSeriess1.Value,
                                                          Mode=OneWay,
                                                          UpdateSourceTrigger=PropertyChanged}">

        <s:SciChartSurface.XAxis>
            <s:NumericAxis DrawLabels="False"
                           GrowBy="0.1, 0.1" />
        </s:SciChartSurface.XAxis>

        <s:SciChartSurface.YAxis>
            <s:NumericAxis HorizontalContentAlignment="Left"
                           DrawLabels="False"
                           GrowBy="0.1, 0.1" />
        </s:SciChartSurface.YAxis>
        <s:SciChartSurface.ChartModifier>
            <s:ModifierGroup>
                <s:LegendModifier x:Name="TrendChartLegendModifier"
                                  ShowLegend="False"
                                  Visibility="Visible" />
            </s:ModifierGroup>
        </s:SciChartSurface.ChartModifier>
    </s:SciChartSurface>
    <s:SciChartSurface Grid.Row="1"
                       Margin="5"
                       VerticalAlignment="Stretch"
                       Background="WhiteSmoke"
                       ChartTitle="SciChartSurface2"
                       RenderableSeries="{s:SeriesBinding GraphSeriess2.Value,
                                                          UpdateSourceTrigger=PropertyChanged}">

        <s:SciChartSurface.XAxis>
            <s:NumericAxis DrawLabels="False"
                           GrowBy="0.1, 0.1" />
        </s:SciChartSurface.XAxis>

        <s:SciChartSurface.YAxis>
            <s:NumericAxis HorizontalContentAlignment="Left"
                           DrawLabels="False"
                           GrowBy="0.1, 0.1" />
        </s:SciChartSurface.YAxis>
    </s:SciChartSurface>
    <s:SciChartSurface Grid.Row="2"
                       Margin="5"
                       VerticalAlignment="Stretch"
                       Background="WhiteSmoke"
                       ChartTitle="SciChartSurface3"
                       RenderableSeries="{s:SeriesBinding GraphSeriess3.Value}">

        <s:SciChartSurface.XAxis>
            <s:NumericAxis DrawLabels="False"
                           GrowBy="0.1, 0.1" />
        </s:SciChartSurface.XAxis>

        <s:SciChartSurface.YAxis>
            <s:NumericAxis HorizontalContentAlignment="Left"
                           DrawLabels="False"
                           GrowBy="0.1, 0.1" />
        </s:SciChartSurface.YAxis>
    </s:SciChartSurface>
    <s:SciChartSurface Grid.Row="3"
                       Margin="5"
                       VerticalAlignment="Stretch"
                       Background="WhiteSmoke"
                       ChartTitle="SciChartSurface4"
                       RenderableSeries="{s:SeriesBinding GraphSeriess4.Value}">

        <s:SciChartSurface.XAxis>
            <s:NumericAxis DrawLabels="False"
                           GrowBy="0.1, 0.1"
                           VisibleRangeLimitMode="MinMax" />
        </s:SciChartSurface.XAxis>

        <s:SciChartSurface.YAxis>
            <s:NumericAxis HorizontalContentAlignment="Left"
                           DrawLabels="False"
                           GrowBy="0.1, 0.1" />
        </s:SciChartSurface.YAxis>
    </s:SciChartSurface>

        <!--  Display the legend for Chart1.  -->
        <!--  Synchronization of Visiblity of each series of each SciChartSurface is performed on the ViwModel side.  -->
        <s:SciChartLegend Grid.Row="4"
                          Grid.Column="1"
                          HorizontalAlignment="Stretch"
                          HorizontalContentAlignment="Center"
                          LegendData="{Binding LegendData,
                                               ElementName=TrendChartLegendModifier}"
                          Orientation="Vertical"
                          ScrollViewer.VerticalScrollBarVisibility="Auto"
                          ShowVisibilityCheckboxes="True" />
    </Grid>
</Window>
MainWindowViewModel.cs
    using Reactive.Bindings;
using Reactive.Bindings.Extensions;
using SciChart.Charting.Common.Extensions;
using SciChart.Charting.Model.ChartData;
using SciChart.Charting.Model.ChartSeries;
using SciChart.Charting.Model.DataSeries;
using System;
using System.Collections.Generic;
using System.Collections.ObjectModel;
using System.Linq;
using System.Reactive.Disposables;
using System.Reactive.Linq;
using System.Text;
using System.Threading.Tasks;
using System.Windows;
using System.Windows.Documents;
using System.Windows.Media;
using System.Xml.Linq;

namespace SurveyFleetVisionChartLegend
{
    public class MainWindowViewModel
    {
        public ReactivePropertySlim<List<IRenderableSeriesViewModel>> GraphSeriess1 { get; set; } = new ReactivePropertySlim<List<IRenderableSeriesViewModel>>();
        public ReactivePropertySlim<List<IRenderableSeriesViewModel>> GraphSeriess2 { get; set; } = new ReactivePropertySlim<List<IRenderableSeriesViewModel>>();
        public ReactivePropertySlim<List<IRenderableSeriesViewModel>> GraphSeriess3 { get; set; } = new ReactivePropertySlim<List<IRenderableSeriesViewModel>>();
        public ReactivePropertySlim<List<IRenderableSeriesViewModel>> GraphSeriess4 { get; set; } = new ReactivePropertySlim<List<IRenderableSeriesViewModel>>();

        public ReactiveCommand RecreateCommand { get; set; }

        private List<string> chartNames;
        private Dictionary<string, bool> seriesVisibles { get; set; }
        private Random random = new Random();

        public MainWindowViewModel()
        {
            chartNames = new List<string>() { "Chart1", "Chart2", "Chart3" };
            seriesVisibles = new Dictionary<string, bool>();
            chartNames.ForEach(a => seriesVisibles.Add(a, true));

            GraphSeriess1.Value = createGraphSeriess("Chart");
            GraphSeriess2.Value = createGraphSeriess("Chart");
            GraphSeriess3.Value = createGraphSeriess("Chart");
            GraphSeriess4.Value = createGraphSeriess("Chart");

            // If the legend changes the Visibility of each series in GraphSeriess1,
            // Vary the Visibility of each series in other GraphSeriess.
            GraphSeriess1.Subscribe(s=> {
                if(s != null)
                    s.ForEach(a =>
                    {
                        a.ObserveProperty(b => b.IsVisible).Subscribe(_ =>
                        {
                            if (GraphSeriess2.Value != null)
                                GraphSeriess2.Value.First(c => c.DataSeries.SeriesName == a.DataSeries.SeriesName).IsVisible = a.IsVisible;
                            if (GraphSeriess3.Value != null)
                                GraphSeriess3.Value.First(c => c.DataSeries.SeriesName == a.DataSeries.SeriesName).IsVisible = a.IsVisible;
                            if (GraphSeriess4.Value != null)
                                GraphSeriess4.Value.First(c => c.DataSeries.SeriesName == a.DataSeries.SeriesName).IsVisible = a.IsVisible;
                            seriesVisibles[a.DataSeries.SeriesName] = a.IsVisible;
                        });
                    });
            });
        }

        private List<IRenderableSeriesViewModel> createGraphSeriess(string name)
        {
            return chartNames.Select((x,a) => createGraphSeries(x, a)).ToList();
        }

        private IRenderableSeriesViewModel createGraphSeries(string name, int index)
        {
            var dataSeries = new XyDataSeries<double>() { SeriesName = name};

            for (var i = 0; i < 5; i++)
            {
                dataSeries.Append(i, random.Next(100));
            }

            return new LineRenderableSeriesViewModel()
            {
                DataSeries = dataSeries,
                IsVisible = seriesVisibles[dataSeries.SeriesName],
                Stroke = Color.FromRgb((byte)(index * 200), (byte)(index * 100), (byte)(index * 100))
            };
        }
    }
}
That is all. Best regards.
- Kouki Takeda asked 10 months ago
- last active 10 months ago
I must be missing something here.
I’ve followed the tooltips and hit test 3d chart examples.
All I need is the X, Y, Z coordinates that you get with the tooltip.
The only example I’ve found is for scatter points using VertexSelectionModifier3D and OnScatterDataChanged event.
But I cant figure out how to do something similar with GridDataSeries (Uniform or non-uniform).
I’ve tried the “ToolTipOpening” event but it doesn’t trigger when the tooltip opens.
This is the last thing I need before I commit to a licence.
The chart is working fine for my use case otherwise.
Thanks!
- Blaz Majcen asked 10 months ago
- last active 10 months ago
I build a .net6.0 project, and add an scichart, when I set the min of visible range of Axis to a bit less than 0, for example -1, the first tick will be zero ,but will show as -0, which is very weird.
And the situation occurs on demo of Scichart, too.
- Hugo Chu asked 10 months ago
- last active 10 months ago
Hello.
Referring to the link above, we have modified the ViewModel side to maintain the selection state of chart points.
It works fine for a single chart, but when I have multiple charts, the selection points are interlocked between charts. I would like them to be independent of each other.
I wasn’t sure if there was a problem with my code or with the DataPointSelectionModifier, so does anyone know?
I have attached a code sample and a GIF of a working image.
※To reproduce this, click the three points in order from the top while holding down the control key on “Chart1” to make the three points selected. The color of the points will change from blue to red.
Next, while holding down the control key in “Chart2,” click on the bottom point. Then, in “Chart2,” four points are selected, even though only one point is pressed in total.
That is all. Best regards.
- Naoya Yokoyama asked 10 months ago
- last active 10 months ago
Hi,
I’m trying to add Data Point Selection in 3D Surface. I followed this example (https://www.scichart.com/example/wpf-chart/wpf-3d-chart-example-simple-select-scatter-point-3d-chart/) but it didn’t work.
Point MetaData is added for each point:
 _model = new ScatterRenderableSeries3DViewModel()
 {
      DataSeries = _dataSeries,
      StyleKey = "ScatterSeries",
      PaletteProvider = new PointCloudPaletteProvider(),
      PointMarker = marker
 };

 RenderableSeries = new ObservableCollection<IRenderableSeries3DViewModel>()
 {
      _model
 };
public void AppendPositionData(double x, double y, double z)
{
    var vertex = new PointMetadata3D(Colors.Coral, 10);
    _dataSeries.Append(x, y, z, vertex);
}
Vertex Selection Modifier is added to group
        <s3D:SciChart3DSurface.ChartModifier>
                <s3D:ModifierGroup3D>
                    <s3D:FreeLookModifier3D ExecuteOn="MouseLeftButton" ExecuteWhen="Shift" />
                    <s3D:OrbitModifier3D ExecuteOn="MouseLeftButton" />
                    <s3D:VertexSelectionModifier3D ExecuteOn="MouseLeftButton" ExecuteWhen="None" />
                    <s3D:MouseWheelZoomModifier3D />
                    <s3D:ZoomExtentsModifier3D AnimateDurationMs="500"
                                               ResetPosition="300,300,200"
                                               ResetTarget="0,0,0" />
                </s3D:ModifierGroup3D>
            </s3D:SciChart3DSurface.ChartModifier>
        </s3D:SciChart3DSurface>
Now, when click to a point on the surface, IsSelected property seems not be set.
Please suggest a way to fix this issue! Thanks.
- Nguyen Bao Trung asked 11 months ago
- last active 9 months ago
I am using ImpulseSeries3Dgraph in some positions labels are overlapping on the graph, is there any way to increase the space between axis labels and the graph? please look into the attached image.
- Ammar Khan asked 11 months ago
- last active 11 months ago
Hello,
I’m Using the FastMountainRenderableSeries to fill the area under/over the Data points with a color gradient.
However, the gradient always seems to adapt to the currently shown data values and uses the maximal and minimal value of the displayed data as the “poles” for the coloring.
In the attached image, Data is displayed with a maximal value of 2 and a minimal value of -2. The gradient (from white to black) uses these values to map the color. -2 corresponds to white and 2 corresponds to black, and the room between is interpolated.
If I were to change the displayed data to have a different max/min value, the gradient would adapt accordingly.
Here is the relevant code I’m using:
FastMountainRenderableSeries m_graph = new FastMountainRenderableSeries();
m_graph.ZeroLineY = 0;
m_graph.AntiAliasing = true;
m_graph.Fill = new LinearGradientBrush(Colors.Black, Colors.White, 90);…adding datapoints…
My question is, is there is a way to gain more control over the way the colors of the gradient are mapped onto the area under/over the data points?
For example, maybe I want the black->white gradient only to go from 2->1 and everything above 2 is black and everything below 1 is white, no matter what range the displayed values currently have.
Ideally it would be possible to create/overwrite a “color-mapping”-function that accepts double values and returns colors to fill the are under/over the data points.
Thank you.
- Marc Vahldieck asked 11 months ago
- last active 11 months ago
Hello support team,
I’m using a SciChartSurface Chart with a CategoryDateTimeAxis (xAxis).
The chart should contain three stacked bar columns and Annotations between the columns.
How can I place the Annotations exactly between the columns with consideration of the dynamic width of chart surface? I haven’t found the exactly property or solution for this particular case.
Thanks for your support in advanced!
- Miriam Moser asked 11 months ago
- last active 11 months ago
I uploaded a test code that dynamically loads multiple charts when selecting different items in the ListBox, and if you toggle options in the ListBox, the previously created charts won’t be released, resulting in a memory leak
- hundun wds asked 11 months ago
- last active 11 months ago
I have a scatterplot with different series of points and I need to figure out a way to draw each point separately in a different Z order. This will acheive “layering” of the points based on some metadata criteria.
The main issue to solve here is as follows. Each series can have “highlighted” points (outlined in blue on the chart, uses SciChart point selection) and “selected” points (denoted by a star point marker) which are tied to a selection in a grid. Any point in any of the series can be Highlighted and/or Selected. I need the the non-selected and non-highlighted points to be drawn first, then the selected points, then the highlighted points. This would guarantee that the highlighted points are always drawn on top of all others, and the selected points drawn on top of all but the highlighted.
My attempt has been to create a custom chart modifier and override OnParentSurfaceRendered. In that method I build dictionaries of points based on the metadata grouping criteria, then start with the lowest Z index group (the non-highlighted and non-selected points) draw those points, and continue up to the highest Z order group (the highlighted points).
Is there a simpler way to achieve this point layering functionality across data series?
Thanks.
- Cale Bryceson asked 11 months ago
- last active 11 months ago
Hello,
I have a WPF .Net 6 application running on Window 11 that monitors data coming from the network.
The app has five tab controls, each tab has four FIFO line charts.
I have another app (the “sender”) that sends simulated data to feed and test the “main” app.
Everything works beautifully when:
– The sender app is not running
– then, first navigate through all tabs, seeing an empty chart (expected)
– Launch the sender app.
– Navigate through tabs, watching them updating in near real time…
But…
If I do not initially navigate through all tabs, only the visible tab gets updated.
I suspect/speculate that SciChart code is doing some “critical” initializations on the OnLoaded event that are missed if tabs do not get loaded before setup.
We want the charts to get populated even if they are hidden at startup.
Any suggestions to fix the issue? Or am I doing anything wrong ?
Thank you
- Laurent Testud asked 11 months ago
- last active 11 months ago
I’m using the ZoomHistoryManager in my application which works great!
But how can I add my own entry to the undo/redo stack?
On my viewmodel I have
 /// <summary>
/// XAxisRange
/// </summary>
public DoubleRange? XAxisRange
{
    get => _xAxisRange;
    set => SetProperty(ref _xAxisRange, value);
}

private DoubleRange? _xAxisRange = null;

/// <summary>
/// YAxisRange
/// </summary>
public DoubleRange? YAxisRange
{
    get => _yAxisRange;
    set => SetProperty(ref _yAxisRange, value);
}

private DoubleRange? _yAxisRange = null;
and I want to implement something like :
 public void CustomRangeUpdate()
{
    if (RenderableSeries.Count > 0)
    {

        XAxisRange = new DoubleRange(x1, x2);
        YAxisRange = new DoubleRange(y1, y2);

        ZoomHistoryManager.SaveLatestRange(new AxisKey("DefaultAxisId", true), XAxisRange);
        ZoomHistoryManager.SaveLatestRange(new AxisKey("YAxis", false), YAxisRange);
        ZoomHistoryManager.PushAll();
    }
}
But it looks like I am using it incorrectly as it doesn’t add any entries. I’ve also tried Push() with no luck
- forl forl asked 11 months ago
- last active 11 months ago
We have been testing different limits of data types we are aiming to draw to the chart, and have found that if all of the values in a series are the same, very near 0, float value, then the line isn’t drawn. We do, however, get the value showing up on the vertical line annotation.
Though we are not using the latest version of SciChart in our production app (Net 4.6.1 requirement, but upgrading that soon), I have managed to reproduce the same in a very simplified .Net7 app using the latest version (7.0.2.27161). I have attached both the test app (with my runtime key removed) and a screenshot of the app.
Here is the code we are using to generate the sample series in the code behind of MainWindow.xaml:
public partial class MainWindow : Window
{
    public MainWindow()
    {
        InitializeComponent();
        this.Loaded += OnLoaded;
    }

    private void OnLoaded(object sender, RoutedEventArgs routedEventArgs)
    {
        var floatData = new XyDataSeries<double, float>();

        for (var i = 0; i < 1000; i++)
        {
            floatData.Append(i, float.Parse(Math.Pow(2, -126).ToString("E")));
        }

        this.FloatSeries.DataSeries = floatData;
    }
}
MainWindow.xaml contains just a SciChart Surface, as follows:
<s:SciChartSurface x:Name="Surface">
            <s:SciChartSurface.RenderableSeries>
                <s:FastLineRenderableSeries x:Name="FloatSeries"
                                            Stroke="#FF4083B7"/>
            </s:SciChartSurface.RenderableSeries>

            <s:SciChartSurface.XAxis>
                <s:NumericAxis AutoRange="Always"/>
            </s:SciChartSurface.XAxis>

            <s:SciChartSurface.YAxis>
                <s:NumericAxis AutoRange="Always"/>
            </s:SciChartSurface.YAxis>

            <s:SciChartSurface.ChartModifier>
                <s:ModifierGroup>
                    <s:RubberBandXyZoomModifier />
                    <s:ZoomExtentsModifier />

                    <s:VerticalSliceModifier>
                        <s:VerticalSliceModifier.VerticalLines>
                            <s:VerticalLineAnnotation X1="500"
                                                      IsEditable="True"
                                                      LabelTextFormatting="E"
                                                      Stroke="White" />
                        </s:VerticalSliceModifier.VerticalLines>
                    </s:VerticalSliceModifier>
                </s:ModifierGroup>
            </s:SciChartSurface.ChartModifier>

            <s:SciChartSurface.Annotations>
                <s:TextAnnotation Text="Test app highlighting problem when all x values are floats with the same scientific value"
                                  CoordinateMode="Relative"
                                  X1="0"
                                  Y1="0"
                                  Margin="2"/>
            </s:SciChartSurface.Annotations>
        </s:SciChartSurface>
Adding another value to the series with result in the line being drawn, as long as it is sufficiently different to the others.
What would be the best way to get this data showing to the users? Whilst highly unlikely the user is going to use such values, we cannot discount this. Would extending the ViewportManager to provide our own range be the best approach? If it impacts on the suggestions, due to our implementation requirements our production app will only show up to two series per surface (with the same data type), but we could be showing upwards of 256 charts (with one of 12 data types as their y-axis type). All of our charts are linked to a common TimeSpanAxis for the x axis.
- Carl Alsford asked 11 months ago
- last active 11 months ago
I’m using SciChartSurface to draw XyDataSeries on XyScatterRendurableSeries.
XyDataSeries changes values at certain times and requires updates.
However, it takes too long to update multiple SciChartSurfaces.
I’ve tried the SuspendUpdates method, but it doesn’t work.
Please let me know if there is a good way.
Thank you in advance.
- Seung Woo Jin asked 11 months ago
Hello,
I’m experiencing a strange phenomenon in which the (in-)visibility of the MajorGridLines of the X-and Y-Axis is only realized in the GUI after the SciChartSurface containing the Axis has been manually resized.
The SciChartSurface is embedded in our GUI like any ordinary WPF-element.
The visibility of the MajorGridLines is controlled via a C#-property:
public virtual bool BackgroundGridVisibility
   {
              get {
                  return m_yAxis.DrawMajorGridLines;
              }
              set {
                  m_xAxis.DrawMajorGridLines = m_yAxis.DrawMajorGridLines = value;
                  NotifyPropertyChanged();
              }
   }
I tried various application of the UpdateLayout-Funktion after setting the visibility, but did not observe positive change.
Is there some other kind of “repaint”-function that can be used to update the visibility of the GridLines?
Thank you
- Marc Vahldieck asked 11 months ago
- last active 11 months ago
I’m trying to create a chart with a single FastLineRenderableSeries, that will have one Y axis, and two X axes.
The first X axis will be a simple NumericAxis, but I want the second X axis to show a string value plotted for each point in the series.
For example, if I have a line series with 3 points
[x:0, y:10]
[x:10, y:20]
[x:20, y:10]
I want the first X axis to show a simple 0-20 range, but I want the second X axis to have “Point1” at x=0, “Point2” at x=10 and “Point3” at x=20.
I have tried with AxisMarkerAnnotation, but this appears to always rotate the text vertically (I need the text horizontal like on a normal Axis)
The second problem is that when you zoom out, the axes go out of sync? I have tried to resolved this using
 private void XNumericAxis_VisibleRangeChanged(object sender, Charting.Visuals.Events.VisibleRangeChangedEventArgs e)
    {
        XNameAxis.VisibleRange = XNumericAxis.VisibleRange;
        XNameAxis.GrowBy = XNumericAxis.GrowBy;
        XNameAxis.MajorDelta = XNumericAxis.MajorDelta;
    }
but it still goes out of sync (see attached images).
Full code :
 <s:SciChartSurface x:Name="sciChart"
                   GridLinesPanelStyle="{StaticResource GridLinesPanelStyle}"
                   Style="{StaticResource SciChartSurfaceStyle}">

    <s:SciChartSurface.RenderableSeries>
        <s:FastLineRenderableSeries x:Name="lineSeries"
                                    Stroke="Plum"
                                    StrokeThickness="3">
            <s:FastLineRenderableSeries.SeriesAnimation>
                <s:FadeAnimation AnimationDelay="0:0:0.2"
                                 Duration="0:0:1" />
            </s:FastLineRenderableSeries.SeriesAnimation>
        </s:FastLineRenderableSeries>
    </s:SciChartSurface.RenderableSeries>

    <s:SciChartSurface.XAxes>
        <s:NumericAxis Style="{StaticResource XAxisStyle}"
                       AxisBandsProvider="{Binding XAxisBands}"
                       VisibleRangeChanged="XNumericAxis_VisibleRangeChanged"
                       x:Name="XNumericAxis" />
        <s:NumericAxis Style="{StaticResource XAxisStyle}"
                       LabelProvider="{Binding XAxisLabels}"
                       AutoRange="Never"
                       x:Name="XNameAxis"
                       Id="NameAxis" />
    </s:SciChartSurface.XAxes>

    <s:SciChartSurface.YAxes>
        <s:NumericAxis Style="{StaticResource YAxisStyle}"
                       AxisAlignment="Left" />
    </s:SciChartSurface.YAxes>
    <s:SciChartSurface.ChartModifier>
        <s:ModifierGroup>
            <s:ZoomPanModifier />
            <s:ZoomExtentsModifier />
            <s:MouseWheelZoomModifier />
        </s:ModifierGroup>
    </s:SciChartSurface.ChartModifier>

    <s:SciChartSurface.Annotations>

        <s:AxisMarkerAnnotation X1="0"
                                XAxisId="NameAxis"
                                AnnotationCanvas="XAxis">
            <s:AxisMarkerAnnotation.PointerTemplate>
                <DataTemplate  DataType="{x:Type s:AxisInfo}">

                </DataTemplate>
            </s:AxisMarkerAnnotation.PointerTemplate>
            <s:AxisMarkerAnnotation.LabelTemplate>
                <DataTemplate  DataType="{x:Type s:AxisInfo}">
                    <TextBlock Text="Point 1"
                               Foreground="Black"
                               FontWeight="Normal" />
                </DataTemplate>
            </s:AxisMarkerAnnotation.LabelTemplate>
        </s:AxisMarkerAnnotation>

        <s:AxisMarkerAnnotation X1="10"
                                XAxisId="NameAxis"
                                AnnotationCanvas="XAxis">
            <s:AxisMarkerAnnotation.PointerTemplate>
                <DataTemplate  DataType="{x:Type s:AxisInfo}">

                </DataTemplate>
            </s:AxisMarkerAnnotation.PointerTemplate>
            <s:AxisMarkerAnnotation.LabelTemplate>
                <DataTemplate  DataType="{x:Type s:AxisInfo}">
                    <TextBlock Text="Point 2" />
                </DataTemplate>
            </s:AxisMarkerAnnotation.LabelTemplate>
        </s:AxisMarkerAnnotation>

        <s:AxisMarkerAnnotation X1="20"
                                XAxisId="NameAxis"
                                AnnotationCanvas="XAxis">
            <s:AxisMarkerAnnotation.PointerTemplate>
                <DataTemplate  DataType="{x:Type s:AxisInfo}">

                </DataTemplate>
            </s:AxisMarkerAnnotation.PointerTemplate>
            <s:AxisMarkerAnnotation.LabelTemplate>
                <DataTemplate  DataType="{x:Type s:AxisInfo}">
                    <TextBlock Text="P3" />
                </DataTemplate>
            </s:AxisMarkerAnnotation.LabelTemplate>
        </s:AxisMarkerAnnotation>

    </s:SciChartSurface.Annotations>
</s:SciChartSurface>
- forl forl asked 11 months ago
- last active 11 months ago
Hi,
In the interface IRenderableSeriesViewModel an IncludeLegend property would be helpful (analogous to LegendModifier.IncludeSeriesProperty). Otherwise you have to override the LegendModifier.GetSeriesInfo method and implement the logic yourself.
regard
Tobias
- Tobias asked 11 months ago
- last active 11 months ago
We would like to add an sphere on a 3D surface graph between steps. We are using a SurfaceMeshRenderableSeries3D and we have the X and Y indices of the point. Is there a way to do this out of the box?
Or is there a way to get the interpolated point using the data series and the indices?
If that is not possible, is there an algorithm we could get from you to do the calculation ourselves?
Currently we are using a XyzDataSeries3D and adding the point to that, but our interpolation algorithm must not be the same as yours, as the point does not stay on the surface of the graph in between points.
- Doug Witt asked 11 months ago
- last active 11 months ago
Hello,
I have a chart currently working. (See attached Chart_Current.png for what I have now)
I’d like to add concentric color-filled zones to the chart, to indicate when the already existing line series enters and exits particular zones of interest. My zones are elliptical, and I need to be able to define them as such (so I do not think the “Bubble” stuff will work). I need to color in the space inside my zones, with some opacity, such that the original renderable series can still be seen. (See attached Chart_Goal.png for a crude MS Paint drawing of what I am trying to achieve.)
I have explored the WPF Examples App and seen several promising chart / series types, but I am still not sure how to proceed. It seems the HeatMap stuff will probably be useful, but I am not sure how to define my HeatMap zones elliptically.
Any tips on how to proceed would be greatly appreciated. I am just trying to get pointed in the right direction.
Thank you!
Kurt
- Kurt Madland asked 11 months ago
- last active 6 months ago
Following the “How to Template the Axis Title” sample and using a simple TextBlock with TextWrapping=”Wrap” I am seeing strange resizing of the main chart elements especially with a scrollbar.
The attached image shows an example app (code available).
The first chart is normal (title clipped).
The second chart has the wrapping textblock and a scrollbar. The scrollbar is off the edge, the chart view area is off the edge. The entire axis label is still not visible (“Lorem ipsum dolor sit amet, consectetur”)
The third chart has no scrollbar so fits elements on the window, but still does not show all text.
The components creeping offscreen is the big problem I cannot figure out how to fix. Please
Note also happens in v7
- Dave Speight asked 11 months ago
- last active 10 months ago
Suppose I have an XYSeries dataset. For this example, Y is a temperature value in Celsius.
The XYSeries without modification I will call raw space. I assume that there is some matrix stack that transforms my “raw space” data series to screen space (the actual pixel on the screen).
Basic Point Transform assumption from my limited Graphics experience:
(Raw Space -> View Space (axis transforms etc) -> Culled Space (culled and interpolated points) -> Screen Space (positioned properly on the screen))
Now all is well if I am just running this graph in Celsius, but perhaps my user wants to change the Y axis to Fahrenheit. For maximum speed I want to generate a transform to edit the dataset, creating an extra space which I will call “Transformed Space”
(Raw Space -> Transformed Space -> View Space -> Culled Space -> Screen Space)
The matrix transform to Fahrenheit (Transformed Space) would be:
| 1   0    0 | | x |
| 0  1.8  32 | | y |
| 0   0    1 | | 1 |
Is it possible to build transforms like this in Scichart or a partial matrices approach like in WPF? Or do I need to loop through and change my raw series every time the units change?
Thank You,
Nicholas Louks
- Nicholas Louks asked 11 months ago
- last active 11 months ago
Hi,
The axis labels are not always showing when zoomed in/out.
Is there a way/workaround to persist the end labels and also make it editable?
Please see attached pic
Thanks
Pramesh
- Pramesh Sharma asked 11 months ago
- last active 11 months ago
Hi SciChart team,
first of all I want to say that I still think SciChart is great! However, I am quite frustrated at the moment. In small applications, the chart and its annotations work very well (yes “Annotations are Easy!”), but in large industrial applications with many views and millions of lines of code, there are from time to time difficult complications with the chart. This is also the case now with the Annotation Creation Modifier. As far as I can see, the AnnotationCreationModifier.OnModifierMouseUp method uses the annotation’s IsSelected state to determine whether to create a new annotation or complete one. With custom composite annotation it can happen that a mouse click first selects the annotation and only then AnnotationCreationModifier.OnModifierMouseUp is called (see attached screenshots).
Sometimes it works, sometimes it doesn’t, depending on where the mouse is.
The AnnotationCreationModifier should not use the annotation’s IsSelected state to complete its internal “edit mode” and call “OnAnnotationCreated”.
Or is there already a solution for this?
regards,
Tobias
- Tobias asked 11 months ago
- last active 11 months ago
Hi, I’m struggling to reduce times for loading draw (5,000Series x 5,000points) x 10 charts
which is in Scichart example ‘Load 500Seriesx500points’.
-
Present, Loading (5,000Series x 5,000points) x 10 charts consumes about 1 minutes.
How can i load and draw this more faster? -
And While in loading, how can i generate and show a Progress bar?
- Hyunji Jeon asked 11 months ago
- last active 11 months ago
I wanted to experiment with adding a tooltip to the SciChart_ScatterChartPerformanceDemo.
I extended the xaml with
 <s:SciChartSurface.ChartModifier>
            <s:ModifierGroup>
                <s:MouseWheelZoomModifier/>
                <s:TooltipModifier />
            </s:ModifierGroup>
        </s:SciChartSurface.ChartModifier>
However, I have noticed that the tooltip doesn’t seem to react properly to the geometry under the cursor. The tooltip will often show up when the cursor is outside the geometry.
If you use a SquarePointMarker with a width and height of 25, the tooltip pops up even when you’re a fair distance away from the geometry.
The hit detection doesn’t appear to be working correctly?
Edit : Also, it appears I am unable to answer questions here, when I add an answer, it accepts it, but doesn’t show anything?
- forl forl asked 11 months ago
- last active 10 months ago
Hi~
I am trying to create a plot that animates ODS (Operating Deflection Shape) using FRF (Frequency Response Function) data. Is ODS animation possible using scichart’s gemoetry 3D plot?
Thanks.
- kim2 kim asked 11 months ago
- last active 11 months ago
I’m overriding FastLineRenderableSeries so I can do some custom rendering.
I have a data series defined as :
 var xyDataSeries = new XyDataSeries<double>();
            xyDataSeries.Append(0, 0);
            xyDataSeries.Append(1, 1);
Test.DataSeries = xyDataSeries;
and my chart as :
<s:SciChartSurface Loaded="SciChartSurface_Loaded">
        <s:SciChartSurface.RenderableSeries>
            <customSeriesMvvmExample:FastLineRenderableSeriesEx x:Name="Test" />
        </s:SciChartSurface.RenderableSeries>
        <s:SciChartSurface.XAxis>
            <s:NumericAxis/>
        </s:SciChartSurface.XAxis>
        <s:SciChartSurface.YAxis>
            <s:NumericAxis/>
        </s:SciChartSurface.YAxis>
    </s:SciChartSurface>
And then I override InternalDraw :
public class FastLineRenderableSeriesEx : FastLineRenderableSeries
{
    protected override void InternalDraw(IRenderContext2D renderContext, IRenderPassData renderPassData)
    {
        base.InternalDraw(renderContext, renderPassData);

        using (var brush = renderContext.CreateBrush(Colors.Transparent))
        using (var pen = renderContext.CreatePen(Stroke, true, StrokeThickness, Opacity))
        {

            var xCalc = renderPassData.XCoordinateCalculator;
            var yCalc = renderPassData.YCoordinateCalculator;

            var xCoord = xCalc.GetCoordinate(0.5);
            var yCoord = yCalc.GetCoordinate(0.5);

            renderContext.DrawEllipse(pen, brush, new System.Windows.Point(xCoord, yCoord), 150, 150);

            renderContext.DrawLine(pen,
                new System.Windows.Point(xCalc.GetCoordinate(0.6), yCalc.GetCoordinate(0)),
                new System.Windows.Point(xCalc.GetCoordinate(2), yCalc.GetCoordinate(1.4)));
        }
    }
}
The problem is that the base.InternalDraw draws the original data series line very nicely with anti-aliasing, but the custom circle I draw has no AA, and the custom line I draw looks very thin?
what’s going on here?
- forl forl asked 11 months ago
- last active 11 months ago
I am running the app which uses the sci chart object FreeSurfaceRenderableSeries3D.
This is a 3d spherical surfaced object, i tried to run it in release mode, i am unable to do the manual rotation using mouse drag to explore the surface of the 3d object. But the object is on freeze for any mouse activity on screen.
I have attached sample image of state of my app.
Please suggest.
- Vishnu Ramvath asked 12 months ago
- last active 11 months ago
I am facing the following two issues related to application crash and unable to perform 3d object rotation in release mode.
Issue 1: Application Crash
I am using PointLineRenderableSeries3D object to render the Data series points.
I have a timer which ticks every 1 sec and have new data series points with some rotation of previous values.
Hence will try to add new points on every 1 sec to the same object data series
timer1.tick +=(() => {
// rendererUpdate is object of PointLineRenderableSeries3D
        using (rendererUpdate.DataSeries.SuspendUpdates())
            {
              var newData = GetNewPointsWithRotation( rendererUpdate.DataSeries, 30);//30 is angle of rotation for older points
                rendererUpdate.DataSeries = newData;
            }
}
Issue 2: When i run the application in release mode, i am unable to perform manual rotation using mouse dragging for the 3d sphere FreeSurfaceRenderableSeries3D object SurfaceMesh referred in the code.
When the application is running in release mode , i tried to drag rotate the 3d shape, but the 3d object is not responding to the mouse drag event (Press hold mouse left button and drag).
The attachment contains the wpf code (xaml and cs) in the same file.
Code refers .jpg file, Please refer any local jpg file to repro the issue.
Please suggest the possible reasons and fixes of the same.
Please provide the possible insights of the same.
- Vishnu Ramvath asked 12 months ago
- last active 9 months ago
I want to create a chart like the attached image file.
I want to mark points with different colors depending on the number of data corresponding to the x and y axes.
As a result of searching, there is a HeatmapColorPalette. Is it good to use this?
If there is a more suitable chart, please introduce it.
thank you
- Seung Woo Jin asked 12 months ago
- last active 12 months ago
Is there any option to hide any axis panel (side wall of the y-axis) in SciChart3D? want to hide the wall marked in red in the image.
- Sunitha Rallabandi asked 12 months ago
- last active 11 months ago
Hello all,
our application is recording data points from a measurement device. The recorded data points are shown in a 2D and 3D chart. Both charts are within one page, the user can switch between the charts via TabControl.
The problem we have is, that when a new data point is added, the chart, which is not in focus (so not selected by the TabControl) does not update.
For the 2D chart we could solve this issue by executing the following code on the TabControl selection changed event:
this.ViewportManager.BeginInvoke(() => { this.ViewportManager.ZoomExtents(); });
For the 3D chart we tried the same approach with the following code (also exectue on the TabControl selection changed event), the function ScaleWorldDimensions adjust the 3D space based on the recorded data:
   Application.Current.Dispatcher.Invoke(() =>
        {
            if (this.ListDataPoints.Count > 0)
            {
                this.ScaleWorldDimensions(this.ListDataPoints);
                this.Surface3D.ViewportManager.ZoomExtents();
            }
        });
But unfortunately this does not solve the issue. Therfore the user either has to switch the tab again or add a new data point when the 3D chart is selected.
Do have hints on how to solve this issue?
Thanks for your support in advanced, in case you need furhter information please let me know.
- Thomas Holler asked 12 months ago
- last active 12 months ago
Hi,
Is there any way to create a multipane chart in WPF like it done using Sub-Charts API in JavaScript chart where it shares same WebGL chart surface.
I know the way it is done using SciChartGroup where there are multiple SciChartSurfaces added to the group in order to create multipane chart, but if it can be done the way it is done in JavaScript charts, it will improve WPF chart performance drastically I think.
Regards,
Chandra
- Chandra Pratap Singh asked 12 months ago
- last active 12 months ago
When the X-axis mouse scroll to zoom in or out, the use of MouseWheel=”mouseWheelZoomModifier_MouseWheel” monitoring is invalid, how to do the mouse wheel zoom, dynamic loading more data, the mouse wheel shrink, do not need to reduce the data, because in some cases the one-time loading data is too large
- fang yangmao asked 12 months ago
- last active 12 months ago
Hello,
I have several simple SciChartSurfaces in my WPF-grid. They are in the same WPF-column but in different WPF-rows, so they are arranged in a vertical manner.
I have noticed that the Y-Axis (a NumericAxis-objcet) moves automatically slightly to the left to make room for the numbers on the Y-Axis, if necessary.
I would like to ask if there is a way to “synchronize” the position of several similar Charts (or their Y-Axis´s, respectively.), so the different Y-Axis´s would always be in the same position. Ideally, the Y-Axis´s of all the Charts would move as far to the left as necessary to make room for the longest number of all the Axis´s.
I have attached an example of my current situation and the solution I would ideally like to achieve.
Is there any way to “connect” the different Axis of the charts to create the desired result?
Thank you.
- Marc Vahldieck asked 12 months ago
- last active 11 months ago
The console prints an exception when I zoom in and out with the mouse wheel:
SciChartSurface didn’t render, because an exception was thrown:
Message: Arrays yValues and indexes must have the same length
Stack Trace: at swb.iwb(Int32 bij, String bik, Int32 bil, String bim)
at SciChart.Data.Model.UniformXyPointSeries..ctor(Double xStart, Double xStep, Values1 yValues, Values1 indexes)
at SciChart.Charting.Visuals.RenderableSeries.DrawingProviders.PointMarkerDrawingProvider1.OnDraw(IRenderContext2D renderContext, IRenderPassData renderPassData)1 enumerable, Action`1 operation)
at SciChart.Core.Extensions.EnumerableExtensions.ForEachDo[T](IEnumerable
at SciChart.Charting.Visuals.RenderableSeries.BaseRenderableSeries.InternalDraw(IRenderContext2D renderContext, IRenderPassData renderPassData)
at SciChart.Charting.Visuals.RenderableSeries.BaseRenderableSeries.SciChart.Charting.Visuals.IDrawable.OnDraw(IRenderContext2D renderContext, IRenderPassData renderPassData)
at ebu.toj(RenderPassInfo gj, IRenderContext2D gk, Int32 gl)
at ebu.toi(ISciChartSurface gg, RenderPassInfo gh, IRenderContext2D gi)
at ebu.RenderLoop(IRenderContext2D renderContext)
at SciChart.Charting.Visuals.SciChartSurface.DoDrawingLoop()
Here is a simple example program uploaded.
- hundun wds asked 1 year ago
- last active 1 year ago
I was having some issues with 2 of the chart modifiers for a SciChart3DSurface. The FreeLookModifier3D used to work as intended, but now non of the key presses work. However, the “ExecuteOn” middle mouse button does free look the camera, I just can’t move the camera forwards and backwards with the ‘w’ ‘a’ ‘s’ ‘d’ ‘c’ or ‘e’ keys. In short, I figured it was something I did since I’m messing with the keyboard, but I haven’t been able to pin down the problem. Then, the VertexSelectionModifier stopped working as intended. It seems as if it’s successfully attached to the surface, but it fails to select any points. This previously worked, and stopped moving around the time when I moved SQL databases, oddly enough. I’ve uploaded a short video to Google Drive (https://drive.google.com/file/d/1y_C7XUU3mMPJ4h4m6LpFKVwZELtEUup3/view?usp=sharing) that demonstrates that the selection box appears when I hold down the left mouse button. What might be causing the chart modifiers to misbehave.
- Will Wright asked 1 year ago
How to modify the official sample program: DigitalAnalyzerPerformanceDemo,
Implement [MouseWheel] to scroll up and down the channel, [CTRL + MouseWheel] to enlarge and narrow the channel data?
I found that [CTRL + MouseWheel] is used by default to shift the Y-axis up and down.
Example program RUL:https://github.com/ABTSoftware/SciChart.Wpf.Examples/tree/master/Sandbox/CustomerExamples/DigitalAnalyzerPerformanceDemo
- hundun wds asked 1 year ago
- last active 12 months ago
