Hi,
I have several chart panes that share a mouse group and a shared visual range (I inject the shared visual range of type IRange in the constructor of the pane view model). I then set the XAxis visual range to the shared visual range inside each pane view model. However, when I use either of the below approaches outside of the pane view model to adjust the min and max of shared visual range, the Xaxis.VisualRange of each pane does not reflect that change.
Approach A: _sharedVisualRange.Min = ….; _sharedVisualRange.Max = …
Approach B: _sharedVisualRange.SetMinMax(….)
Neither approach actually impacts the XAxis.VisualRange.Min/Max.
Initially when I created the XAxis in code I set its VisualRange equal to the shared visual range that was injected via constructor, like :
XAxis = new CategoryDateTimeAxis()
{
……
……
VisualRange = _sharedVisualRange,
…..
};
Please note that all the above refers to code in the view model. I bind the XAxis in the pane view model to the XAxis of the surface in xaml.
My entire synchronization heavily relies on the assumption of this working, but it does not.
- bbmat asked 6 years ago
- last active 6 years ago
Hi sir,
We would like to build a real time updated stackedcolumn chart in mvvm mode.
Is that possible? (x-axis on the left side)(y-axis on the bottom side which can keep update with only 10mins range)
I wonder can I use the StackedColumnRenderableSeriesForMvvm?
I found out this control but have no idea how to use it…
- Wade Yao asked 3 years ago
- last active 3 years ago
Hi SciChart team,
I have built a xyscatter chart with DateTime type X-Axis and Double type Y-Axis,
and built boxannotations to mark areas.
May I set the x-Axis value in the tooltip?
Or can I show properties of each item which means every point in the xyscatterseries, and customize the tooltip content style like adding the description of every properties.
- Wade Yao asked 3 years ago
- last active 3 years ago
Hello!
I am getting started with SciChart and attempting to use it for a project I’m working on.
I am attempting to make a 3D scatter plot whose data is populated through a ViewModel.
Below is a my xaml:
 <UserControl x:Class="CustomWindow.Pages.Results_Page.Common_Tests.Positional6DOFErrorTest"
             xmlns="http://schemas.microsoft.com/winfx/2006/xaml/presentation"
             xmlns:x="http://schemas.microsoft.com/winfx/2006/xaml"
             xmlns:mc="http://schemas.openxmlformats.org/markup-compatibility/2006"
             xmlns:d="http://schemas.microsoft.com/expression/blend/2008"
             xmlns:enum="clr-namespace:MultiMet.Interfaces.Common;assembly=MultiMet.Interfaces"
             xmlns:xcdg="http://schemas.xceed.com/wpf/xaml/datagrid"
             xmlns:s3D="http://schemas.abtsoftware.co.uk/scichart3D"
             mc:Ignorable="d"
             d:DesignHeight="360" d:DesignWidth="712">

    <Grid Background="White">
        <Grid.RowDefinitions>
            <RowDefinition Height="*"/>
        </Grid.RowDefinitions>
        <Grid.ColumnDefinitions>
            <ColumnDefinition Width="*"/>
            <ColumnDefinition Width="*"/>
        </Grid.ColumnDefinitions>

        <!-- Some other stuff I'm doing on the page -->

        <s3D:SciChart3DSurface Grid.Column="1" ShowLicensingWarnings="True"
                        IsFpsCounterVisible="False"
                         IsAxisCubeVisible="True"
                         IsXyzGizmoVisible="False"
                         CoordinateSystem="RightHanded"
                               Background="White" RenderableSeries="{s3D:SeriesBinding RenderableSeries3DViewModels}">
            <!-- Create XAxis -->
            <s3D:SciChart3DSurface.XAxis>
                <s3D:NumericAxis3D TickTextBrush="Black" AxisTitle="X (mm)" DrawMajorBands="True" DrawMajorGridLines="True"
                        DrawMinorGridLines="True"
                        DrawMajorTicks="True"
                        DrawMinorTicks="True"
                        AxisBandsFill="Transparent"
                        FontSize="10"
                        TickLabelAlignment="Camera"
                                   GrowBy="0.1, 0.1"/>
            </s3D:SciChart3DSurface.XAxis>
            <!-- Create YAxis -->
            <s3D:SciChart3DSurface.YAxis>
                <s3D:NumericAxis3D AxisTitle="Z (mm)"
                        AxisBandsFill="Transparent"
                        TickTextBrush="Black"
                        FontSize="10"
                        TickLabelAlignment="Camera"
                                   GrowBy="0.1, 0.1"/>
            </s3D:SciChart3DSurface.YAxis>
            <!-- Create ZAxis -->
            <s3D:SciChart3DSurface.ZAxis>
                <s3D:NumericAxis3D AxisTitle="Y (mm)"
                        AxisBandsFill="Transparent"
                        TickTextBrush="Black"
                        FontSize="10"
                        TickLabelAlignment="Camera"
                                   GrowBy="0.1, 0.1"/>
            </s3D:SciChart3DSurface.ZAxis>

            <!-- Create Interactivity Modifiers for rotating camera -->
            <s3D:SciChart3DSurface.ChartModifier>
                <s3D:ModifierGroup3D>
                    <s3D:OrbitModifier3D ExecuteOn="MouseLeftButton" ExecuteWhen="None"/>
                    <s3D:MouseWheelZoomModifier3D MouseWheelSensitivity="90" />
                    <s3D:FreeLookModifier3D ExecuteOn="MouseRightButton"/>
                    <s3D:TooltipModifier3D IsEnabled="True" SourceMode="AllSeries" ShowTooltipOn="MouseOver"/>
                </s3D:ModifierGroup3D>
            </s3D:SciChart3DSurface.ChartModifier>
        </s3D:SciChart3DSurface>
    </Grid>
</UserControl>
And below I declare and define my scatter plot in the viewmodel (the scatterSeries is an XyzDataSeries3D set somewhere else) :
    PositionalErrorTestModel.RenderSeries3DViewModels = new ObservableCollection<IRenderableSeries3DViewModel>();
PositionalErrorTestModel.RenderSeries3DViewModels.Add(new ScatterRenderableSeries3DViewModel
            {
                PointMarker = new SpherePointMarker3D { Fill = System.Windows.Media.Color.FromRgb(0x78, 0xC3, 0), Size = 5, Opacity = 1 },
                DataSeries = scatterSeries
            });
The chart appears, but the data does not. Is there something I’m missing? Do I need to explicitly call an update to the chart? Because the page the chart is on and the chart does get loaded before the data is populated.
Please let me know if you need to know anymore information.
Thanks for any help you can provide!
- Andy Murray asked 4 years ago
- last active 4 years ago
Hi,
I’m experimenting with the LegendModifier and want to control which RenderableSeries are shown via the “LegendItemTemplate” approach. The idea is to add a specific tagging class to the RenderableSeries.DataSeries.Tag and use the content inside the LegendItemTemplate which I define in the Window.Resouces.
The tagging Class:
public class DataSeriesTag
{
    public string LegendText { get; set; }
    public bool ShowLegend { get; set; }
}
The LegendItemTemplate:
<Window.Resources>
<Grid.ColumnDefinitions>
</Grid.ColumnDefinitions>
            <!--<CheckBox Width="16" Margin="5,0,0,0"
                HorizontalAlignment="Left"
                VerticalAlignment="Center"
                IsChecked="{Binding RenderableSeries.IsVisible, Mode=TwoWay}"
                Visibility="{Binding RenderableSeries.DataSeries.Tag.ShowLegend, Converter={dxmvvm:BooleanToVisibilityConverter}}" />-->

            <s:PointMarker Grid.Column="1" Margin="5,0,0,0" Width="40" Height="10" VerticalAlignment="Center" HorizontalAlignment="Center"
              DataContext="{Binding RenderableSeries}"
              DeferredContent="{Binding LegendMarkerTemplate}"
              Visibility="{Binding ShowSeriesMarkers, RelativeSource={RelativeSource AncestorType=s:SciChartLegend}, Converter={dxmvvm:BooleanToVisibilityConverter}}" />

            <TextBlock Margin="5,0,5,0"
     Grid.Column="2"
     HorizontalAlignment="Left"
     Text="{Binding RenderableSeries.DataSeries.Tag.LegendText}" />

        </Grid>
    </DataTemplate>
</Window.Resources>
As long as I declare the SciChartSurface.ChartModifier in XAML, it works perfect.
The proplem raises when I bind the ModifierGroup to a ViewModel Property and try to build the LegendModifier there. How can I assign the LegendItemTemplate in the ViewModel?:
legendModifier = new LegendModifier(){
            ShowLegend = true,
            ShowVisibilityCheckboxes = false,
            LegendItemTemplate = ??????
        };
        TheModifiers.ChildModifiers.Add(legendModifier);
Kind regards
Martin
- Martin Mohr asked 4 years ago
- last active 4 years ago
Hi Sci Chart,
I am using WPF with MVVM.
What i want to achieve is by reading the rollover modifier current hit point data, when user click left click, i want to add VerticalSliceModifier in the graph based on the hit point.
Attach is my code from xaml and viewmodel.
I have two issues which are:
“if (DistanceSeriesData.SeriesInfo.Count > 0)”, i always get zero count of seriesinfo.
In DistanceVerticalLines?.Add(new VerticalLineAnnotation(), the added Distance Vertical Lines data did not reflect in graph.
- Chee Wei Liu asked 3 years ago
We’re using ReactiveUI and bindings in code-behind. We’re now upgrading from SciChart v3 to v6 and we’re wondering how to use the SeriesBinding in code-behind like this:
public partial class BarChartView : ReactiveUserControl<sBarChartViewModel>
{
    public BarChartView()
    {
        InitializeComponent();

        this.WhenActivated(disposable =>
        {
            this.OneWayBind(ViewModel,
                            vm => vm.SeriesSource,
                            view => view.BarChart.SeriesSource)
                .DisposeWith(disposable);

            this.OneWayBind(ViewModel,
                            vm => vm.LabelProvider,
                            view => view.FaciesAxis.LabelProvider)
                .DisposeWith(disposable);

            this.OneWayBind(ViewModel,
                            vm => vm.TooltipDataContext,
                            view => view.TooltipModifier.TooltipLabelDataContextSelector)
                .DisposeWith(disposable);

            this.OneWayBind(ViewModel,
                            vm => vm.XAxisRange,
                            view => view.FaciesAxis.VisibleRange)
                .DisposeWith(disposable);
        });
    }
}
Now the IChartSeriesViewModel and SciChartSurface.SeriesSource is deprecated so we have to move to IRenderableSeriesViewModel instead and then bind to SciChartSurface.RenderableSeries. But how can we convert from IRenderableSeriesViewModel to IRenderableSeries here?
- Tore Munch asked 3 years ago
- last active 2 years ago
Hi
I’m trying to use AvaloniaUI with .NET Core 3.1 to create an application using SciChart, but I get XAMLIL error when trying to add a SciChartSurface following the code from the tutorial. I used a standard Avalonia MVVM Application template when creating the project.
This is the code:
<UserControl xmlns="https://github.com/avaloniaui"
             xmlns:s="http://schemas.abtsoftware.co.uk/scichart"
             xmlns:x="http://schemas.microsoft.com/winfx/2006/xaml"
             xmlns:d="http://schemas.microsoft.com/expression/blend/2008"
             xmlns:mc="http://schemas.openxmlformats.org/markup-compatibility/2006"
             mc:Ignorable="d" d:DesignWidth="800" d:DesignHeight="450"
             x:Class="FF_DataVis_Avalonia_MVVM.Views.TabControlView">

    <Grid>
        <!-- Bind to ChartViewModel.ChartTitle etc -->
        <s:SciChartSurface ChartTitle="{Binding ChartTitle}">
            <s:SciChartSurface.XAxis>
                <s:NumericAxis AxisTitle="{Binding XAxisTitle}"/>
            </s:SciChartSurface.XAxis>
            <s:SciChartSurface.YAxis>
                <s:NumericAxis AxisTitle="{Binding YAxisTitle}"/>
            </s:SciChartSurface.YAxis>
        </s:SciChartSurface>
    </Grid>
</UserControl>
And the error I get is:
“XAMLIL: Unable to resolve type SciChartSurface from namespace http://schemas.abtsoftware.co.uk/scichart Line 27, position 4″
which is the first s:SciChartSurface entry.
Any ideas what might be wrong? Does SciChart not work with any framework regardless of using .NET Core 3.0?
I have tried changing between Core 3.0 and 3.1, which does nothing.
- Magnus Aarnes asked 3 years ago
- last active 4 months ago
Getting an exception when trying to add tooltip template MVVM style to a blox plot. The chart also contains a scatter plot which should not be styled. That works fine, hoverwer, when I move the mouse over a box in the box plot, the exception is thrown.
I want to keep the styling, I just want to write something different than the default text.
The template:
  <DataTemplate DataType="scalarPlot:ToolTipData" x:Key="BoxSeriesTooltipTemplate">
    <TextBlock>
      <Run Text="Max:      " />
      <Run Text="{Binding Maximum}" />
      <LineBreak />
      <Run Text="P90:       " />
      <Run Text="{Binding P90}" />
      <LineBreak />
      <Run Text="Median: " />
      <Run Text="{Binding Median}" />
      <LineBreak />
      <Run Text="P10:       " />
      <Run Text="{Binding P10}" />
      <LineBreak />
      <Run Text="Min:       " />
      <Run Text="{Binding Minimum}" />
      <LineBreak />
    </TextBlock>
  </DataTemplate>
The binding:
      <Style TargetType="s:BaseRenderableSeries" x:Key="BoxSeriesStyle">
        <Setter Property="s:TooltipModifier.TooltipTemplate" Value="{StaticResource BoxSeriesTooltipTemplate}"/>
        <Setter Property="s:TooltipModifier.IncludeSeries" Value="True"/>
      </Style>
The modifier:
<s:SciChartSurface.ChartModifier>
      <s:ModifierGroup>
        <s:TooltipModifier IsEnabled="True" ShowTooltipOn="Always" ReceiveHandledEvents="True" TooltipLabelDataContextSelector="{Binding ToolTipDataContext}"/>
      </s:ModifierGroup>
    </s:SciChartSurface.ChartModifier>
The view model:
    private static IRenderableSeriesViewModel CreateBoxPlotViewModel(BoxPlotDataSeries<int, float> boxPlotDataSeries)
    {
        return new BoxPlotRenderableSeriesViewModel
        {
            DataSeries = boxPlotDataSeries,
            Stroke = Colors.SteelBlue,
            Fill = new LinearGradientBrush(Colors.White, Colors.LightSteelBlue, new System.Windows.Point(0, 0), new System.Windows.Point(0.5, 1)),
            StyleKey = "BoxSeriesStyle"
        };
    }
The data context selector:
    public Func<SeriesInfo, object> ToolTipDataContext
    {
        get
        {
            return seriesInfo =>
                   {
                       return seriesInfo switch
                       {
                           BoxPlotSeriesInfo boxInfo =>
                               new ToolTipData
                               {
                                   Fill = seriesInfo.Fill,
                                   Stroke = seriesInfo.Stroke,
                                   Maximum = (float) boxInfo.MaximumValue,
                                   P90 = (float) boxInfo.UpperQuartileValue,
                                   Median = (float) boxInfo.MedianValue,
                                   P10 = (float) boxInfo.LowerQuartileValue,
                                   Minimum = (float) boxInfo.MinimumValue
                               },
                           _ => seriesInfo
                       };
                   };
        }
    }
- Tore Munch asked 3 years ago
- last active 3 years ago
Hi,
I am developing an MVVM WPF application and need to access the SelectedPointMarkers property of DataPointSelectionModifier from the ViewModel.
From looking at the DataPointSelectionModifier documentation (https://www.scichart.com/documentation/win/current/webframe.html#DataPoint%20Selection.html) I can see how you can get the X and Y coordinate values of a selected point in a view, by binding the PointMarkersSelectionModifier to a listbox.
However this doesn’t really help me, I need to get the coordinates of the SelectedPointMarker into a property inside the ViewModel that can be accessed, rather than just binding to a listbox in the view itself.
I’ve also looked at this similar post: (https://www.scichart.com/questions/wpf/i-want-to-bind-selectedpointmarkers-of-datapointselectionmodifier), but I had no luck getting Kenishis solution to work in my case.
How can i do this?
Thanks.
- Sean Connell asked 3 years ago
- last active 2 years ago
Hello,
I’m using SciChart in our WPF project. And we are Keeping Series and Annotations as RadObservableCollection(from Telerik) instead of ObservableCollection to get the benefits of RadObservableCollection. But when I’m adding or deleting data from RadObservableCollection it does not affect in charts. Does SciChart work with RadObservableCollection ? I’ve explored your examples and wasn’t able to found examples with RadObservableCollection.
- Lusine Torosyan asked 1 year ago
- last active 1 year ago
Hello,
I am trying to add a BoxAnnotation with MVVM pattern where the X-Axis is a DateTime axis. The annotation can be dragged into the X-direction. I need to know the DateTime of each position while dragging and also the final position(DateTime) of the BoxAnnotation when the drag Ended. I am listening to the DragDelta and DragEnded events in ViewModel. But here I couldn’t able to get the DateTime from X1 and X2 of that annotation model. I am sharing some snippets of my code. Can you please let me know how I can achieve this?
In xaml:
<Style x:Key="_boxAnnotationStyle" BasedOn="{StaticResource AnnotationBaseStyle}" TargetType="scichart:BoxAnnotation">
        <Setter Property="Template">
            <Setter.Value>
                <ControlTemplate TargetType="scichart:BoxAnnotation">
                    <Border x:Name="PART_BoxAnnotationRoot"
              Margin="{TemplateBinding Margin}"
              Background="{TemplateBinding Background}"
              BorderBrush="{TemplateBinding BorderBrush}"
              BorderThickness="{TemplateBinding BorderThickness}"
              CornerRadius="{TemplateBinding CornerRadius}" />
                </ControlTemplate>
            </Setter.Value>
        </Setter>
</Style>
<scichart:SciChartSurface x:Name="GraphSurface"
                 Annotations="{scichart:AnnotationsBinding ItsAnnotations}">

                <scichart:SciChartSurface.XAxis>
                    <scichart:DateTimeAxis x:Name="GraphXAxis"
                                           VisibleRange="{Binding ItsTimeVisibleRange, Mode=TwoWay}" />
                </scichart:SciChartSurface.XAxis>

                <scichart:SciChartSurface.YAxes>
                    <scichart:NumericAxis x:Name="GraphYAxis"
                                          VisibleRange="0, 10" />

                </scichart:SciChartSurface.YAxes>
 </scichart:SciChartSurface>
In ViewModel.cs
{
    private DateRange _timeVisibleRange;
    private ObservableCollection<IAnnotationViewModel> _annotations;
    private IAnnotationViewModel _boxAnnotation;
    public ObservableCollection<IAnnotationViewModel> ItsAnnotations
    {
        get
        {
            return _annotations;
        }
    }
    public DateRange ItsTimeVisibleRange
    {
        get { return _timeVisibleRange; }
        set
        {
            if (_timeVisibleRange == value) return;
            _timeVisibleRange = value;
            RaisePropertyChanged(() => ItsTimeVisibleRange);
        }
    }
    .
    .
    .
    _boxAnnotation = new BoxAnnotationViewModel()
        {
            IsEditable = true,
            DragDirections = SciChart.Charting.XyDirection.XDirection,
            X1 = DateTime.UtcNow.AddSeconds(300),
            X2 = DateTime.UtcNow,
            Y1 = 0,
            Y2 = 8,
            StyleKey = "_boxAnnotationStyle"
        };

     _annotations = new ObservableCollection<IAnnotationViewModel>() { };
     _annotations.Add(_boxAnnotation );

     _captureTimeRangeSelectorAnnotation.DragDelta += OnDrag;
     _captureTimeRangeSelectorAnnotation.DragEnded += DragEnded;
       .
       .
       .
    private void DragEnded(object sender, EventArgs e)
    {
         var boxAnnotationModel = sender as BoxAnnotationViewModel;
          // Need to know the DateTime value of X1 and X2
    }
    private void OnDrag(object sender, AnnotationDragDeltaEventArgs e)
    {
         var boxAnnotationModel = sender as BoxAnnotationViewModel;
         // Need to know the DateTime value of X1 and X2
    }
    .....
    .....
}
- Habibur Rahman asked 1 year ago
- last active 1 year ago
Is there a way to apply functionalities on signals as in average, slope, etc. ?
Thank you
Anders
- Anders Persson asked 2 years ago
- last active 2 years ago
Hello Andrew & Co.
I need some guidance in an attempt to add some required functionality to my SciChart application.
A requirement has been brought to my attention where a user wants to do a graph over lay from a different time snap shot . This is useful for comparison reasons, where the engineer wants to compare a previous successful execution of a process with a current running one.
- One part of the solution is to save the dataseries info from a finite
time period in the past. - Second part is that the overlaid trend (dataseries) need to be time
XAxis independent but YAxis relative.
I am looking at two different scenarios let me see what you guys think:
- Overlaid historic static trend on existing chart surface
- Historic static trend in a new chart surface (smaller format) on the
bottom of the current chart surface being displayed
How should I best approach such an implementation ? The application is using the MVVM pattern. I have adhered to the pattern pretty religiously so far
Hopefully that makes sense to describe what I am trying to accomplish.
Appreciate your support and expert guidance in this matter
Thanks
Anders
- Anders Persson asked 2 years ago
Hello,
I’ve got Annotations ViewModels collection (BoxAnnotationViewModel, VerticalLineAnnotationViewModel, LineAnnotationViewModel) bound by AnnotationsBinding. Every Annotation ViewModel has properties set to:
CoordinateMode = AnnotationCoordinateMode.Absolute
IsEditable = true
DragDirections = XyDirection.XYDirection
ResizeDirections = XyDirection.XYDirection
My goal is to move and resize every annotation on SciChart surface only by integer value. Is there any way to achieve this?
Best regards,
Anna
- Anna Kozłowska asked 2 years ago
- last active 1 year ago
Requirements:
- Main graph updates based on the data from the selected Item.
- The data and styling is independent and the style is dynamic global style for all Items.
- The data for the graphing that is Data Series is binded to DataSet which is of type XYDataSeries<DateTime, double>.
- DataSeries data is obtained from the datacontext which implements INotifyPropertyChanged
Problem:
- The databinding is not dynamic and the data series is not updated when the selection changes.
- The initial data selection is reflected but any subsequent data changes are not reflected on the sci chart surface.
- This behavior was only for the Dataseries binding and it was verified using a textbox which binds to the count of the DataSet and this updates as the selection changes but not the dataseries.
Please suggest a work around or an alternative solution so that I can predefine axes and series but swap out the data based on the selected Item. Please see the attached xaml code below.
        <Grid>
        <Grid DockPanel.Dock="Top">
            <chart:SciChartSurface x:Name="mainView"
                                   OnRenderException="MainView_OnRenderException"
                                   Loaded="MainView_Loaded">
                <chart:SciChartSurface.YAxes>
                    <chart:NumericAxis x:Name="AxisOne"
                                       Id="Id1"
                                       AxisAlignment="Left"/>

                    <chart:NumericAxis x:Name="AxisTwo"
                                       Id="Id2"
                                       AxisAlignment="Left"/>

                </chart:SciChartSurface.YAxes>
                <chart:SciChartSurface.XAxis>
                    <chart:DateTimeAxis x:Name="DateTimeAxis"/>
                </chart:SciChartSurface.XAxis>
                <chart:SciChartSurface.RenderableSeries>
                    <chart:FastLineRenderableSeries x:Name="DataSet1FS"
                                                    DataSeries="{Binding DataSet1}"
                                                    YAxisId="Id1"
                                                    Stroke="Yellow"/>
                </chart:SciChartSurface.RenderableSeries>
            </chart:SciChartSurface>
        </Grid>
        <TextBlock Text="{Binding Path=DataSet1.Count}"
                            Margin="0 -20 0 0"
                            HorizontalAlignment="Right"
                            VerticalAlignment="Top"
                            Height="20"
                            Width="200"
                            Background="White"
                            Foreground="Black"/>
    </Grid>
- Arjun Sivaprasadam asked 1 year ago
- last active 1 year ago
Hello Scichart Team,
Can you guys provide me with some guidance to implement a custom IRenderableSeriesViewModel implementation that is supported in MVVM binding in Scichartsurface? Specifically, I’m looking to create a chart series that can be bound to my ViewModel and support custom styling and data handling.
I have tried following the tutorial found here…
Worked Example – CustomRenderableSeries in MVVM
https://www.scichart.com/documentation/win/current/webframe.html#Worked%20Example%20-%20CustomRenderableSeries%20in%20MVVM.html
I was getting a cast error from scicharts. I have attached the picture showing the detailed error.
Concerning the XAML code I have tried both the normal Binding keyword and s:SeriesBinding keyword to the RenderableSeries in the SciChartSurface.
Let me know how to go about this!
- Arjun Sivaprasadam asked 1 year ago
- last active 1 year ago
Hello,
I’m currently rewriting a program in .net7 WPF using MVVM as much as possible.
In my MainViewModel:
I read data from a CSV file and transforming it into an ObservableCollection of LineRenderableSeriesViewModel (stored in the « RenderableSeriesViewModels » variable) . Additionally, the Y axes are transformed into ObservableCollection of IAxisViewModel (within the « Yaxes » variable).
Each series corresponds to a LineRenderableSeriesViewModel and each Y axis is represented as a NumericAxisViewModel. The X-axis is a DateTime common to all series and is declared only in XAML.
Within my view’s XAML:
I declare RenderableSeries=”{s:SeriesBinding RenderableSeriesViewModels}” and YAxes=”{s:AxesBinding YAxes}. I’ve defined a legend template to add several elements:
– DataContext=”{Binding RenderableSeries}”
– A checkbox to toggle serie visibility (IsVisible binding).
– A checkbox to toggle Y-axis visibility for the serie (YAxis.Visibility binding).
– A color picker to change the color of a serie, bound to “Stroke”, “YAxis.TickTextBrush”, and “YAxis.BorderBrush”
– A slider for adjusting serie thickness (StrokeThickness binding).
Results:
Each element acts on the graph as expected: RenderableSeries updates and the graph refreshes correctly.
In the MainViewModel, RenderableSeriesViewModels and YAxes are not updated for all elements:
– “IsVisible” and “StrokeThickness” for the concerned series are instantly modified in RenderableSeriesViewModels but “Stroke” is not.
– “YAxes” is not updated.
The code for the LegendTemplate and a screenshot of the resulting legend are in the attachements.
Could you please help me to understand what I do wrong?
- Nicolas MARTINEZ asked 6 months ago
- last active 5 months ago
We are using the VerticalLineAnnotation and want to change it’s location (X1 property) in the viewmodel.
Annotations are bound like this:
<s:SciChartSurface
           ...
           Annotations="{s:AnnotationsBinding Annotations}"
to the property:
public ObservableCollection<IAnnotationViewModel> Annotations { get; private set; }
The collection contains this association:
this.nowAnnotation = new VerticalLineAnnotationViewModelEx()
        {
            X1 = TimeSpan.FromSeconds(0),
            StyleKey = "NowAnnotationStyle"
        };
To change the location we change the value of X1:
nowAnnotation.X1 = value;
Calling that didn’t have a direct effect on the UI unless the user does any action which redraws the chart.
We created a style which sets an attached property to pass the VerticalLineAnnotation to the view model, this works fine.
<Style TargetType="s:VerticalLineAnnotation" x:Key="NowAnnotationStyle">
                    <Setter Property="viewModels:VerticalLineAnnotationViewModelEx.PassIAnnotation" Value="True" />
                </Style>
And we added a Refresh method to VerticalLineAnnotationViewModelEx and call it after setting X1:
nowAnnotation.X1 = value;
nowAnnotation.Refresh();
The first implementation of the Refresh method we did was:
public void Refresh()
    {
        this.Annotation.Refresh();
    }
From the documentation this should redraw the annotation without redrawing the whole chart, but it had no effect.
https://www.scichart.com/documentation/win/current/webframe.html#SciChart.Charting~SciChart.Charting.Visuals.Annotations.AnnotationBase~Refresh.html
It only started working after changing to this:
public void Refresh()
    {
        this.Annotation.ParentSurface.InvalidateElement();
    }
Is there a better way to do it, shouldn’t the first implementation work?
The complete code of VerticalLineAnnotationViewModelEx
public class VerticalLineAnnotationViewModelEx : VerticalLineAnnotationViewModel
{
    public static readonly DependencyProperty PassIAnnotationProperty = DependencyProperty.RegisterAttached(
        "PassIAnnotation", typeof(bool), typeof(VerticalLineAnnotationViewModelEx),
        new PropertyMetadata(default(bool), OnPassIAnnotationChanged));

    public IAnnotation Annotation { get; private set; }

    private static void OnPassIAnnotationChanged(DependencyObject d, DependencyPropertyChangedEventArgs e)
    {
        var verticalLineAnnotation = (VerticalLineAnnotation)d;
        ((VerticalLineAnnotationViewModelEx)verticalLineAnnotation.DataContext).Annotation = (IAnnotation)d;
    }

    public static void SetPassIAnnotation(DependencyObject element, bool value)
    {
        element.SetValue(PassIAnnotationProperty, value);
    }

    public static bool GetPassIAnnotation(DependencyObject element)
    {
        return (bool)element.GetValue(PassIAnnotationProperty);
    }

    public void Refresh()
    {
        //this.Annotation?.Refresh();
        this.Annotation?.ParentSurface.InvalidateElement();
    }
}
- AC42admin LMB asked 8 months ago
- last active 8 months ago
Good day,
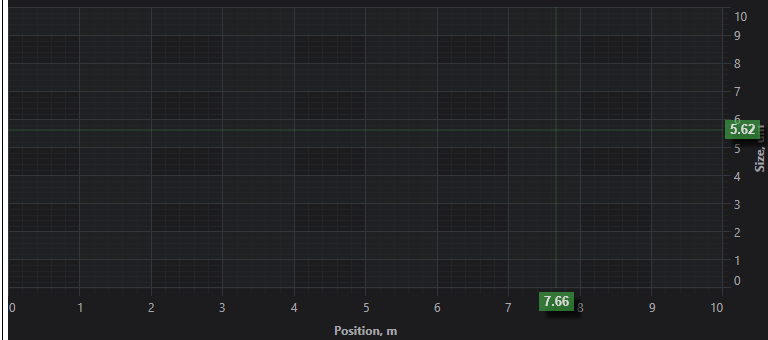
we are using the VerticalSliceModifier for sorted data and it works very good.
<local:VerticalSliceModifierExt x:Name="SliceModifier">
<s:VerticalSliceModifier.VerticalLines>
    <chartModifier:SnappyVerticalLine x:Name="VerticalLine"
                          ShowLabel="False"
                          X1="0"
                          Y1="0"
                          CoordinateMode="Absolute"
                          IsEditable="True">
    </chartModifier:SnappyVerticalLine>
</s:VerticalSliceModifier.VerticalLines>
Please see the image “Example Vertical Slice Modifier”.
The challange is to have something similar for unsorted data.
One of the issues are multiple intersections. Please see the image “Multiple Intersections” where i would like be able to select what intersections shall be highlighted.
The next challange is the usage of multiple series and synchronization based on a different property (t for time). Please see “Multiple Series” image.
We already have IPointMetadata with X,Y and t to be able to find the data point to highlight.
My question: Is there already some modifier chat can help with this requirements or what would be a clean solution if we need to develop a custom modifier.
Thank you in advance
Paul
- Paul Stempel asked 5 months ago
- last active 3 months ago
Hello.
I’m just started to use SciChart and I have a question. How I can mirror XAxis in order to values will be increased from right to left. It is not negative scale but this view is more familiar for users (now I remake the old application). P.S. And be the best if additionally you show me how to make static XAxis with chosen range. I see the example in demo’s “Create Realtime Charts” section (my chart will be real-time too), but my application created via MVVM and I think this example not fully applicable to my case (but I fink after some investigation I will can remake example, but if you help me it be easier).
- Fedor Iudin asked 4 months ago
- last active 4 months ago
Hello.
Thanks for previous answer but I can’t check how it work because of new problem. I develop WPF application and try to use MVVM as architecture pattern. In the Model part of my application I used a loop started in the new thread. In that loop I get some data which received to ViewModel and used as chart data. Looks as usual.
But then I tried to set visible range updated object which bound to axis I get exception ‘System.InvalidOperationException: ‘The calling thread cannot access this object because a different thread owns it.’ in my loop. I know it happens in WPF applications and need to use Dispatcher to solve it. But as I know if you try to use MVVM you not needed to use Dispatcher often because WPF-binding in most cases is thread-safe. That happend in my case? How to solve it?
Parts of my code:
XAML
<Window x:Class="HMI.MainWindow"
        xmlns="http://schemas.microsoft.com/winfx/2006/xaml/presentation"
        xmlns:x="http://schemas.microsoft.com/winfx/2006/xaml"
        xmlns:d="http://schemas.microsoft.com/expression/blend/2008"
        xmlns:mc="http://schemas.openxmlformats.org/markup-compatibility/2006"
        xmlns:s="http://schemas.abtsoftware.co.uk/scichart"
        xmlns:localVM="clr-namespace:MyCom.HMI.ViewModel"
        mc:Ignorable="d"
        Title="MainWindow" Height="450" Width="800">
    <Window.DataContext>
        <localVM:HMIViewModel/>
    </Window.DataContext>
    <Window.Resources>
        <localVM:InverseBooleanConverter x:Key="InverseBooleanConverter"/>
        <localVM:ProcessStateToColorConverter x:Key="ProcessStateToColorConverter"/>
        <localVM:ProcessStateToStartedConverter x:Key="ProcessStateToStartedConverter"/>
        <localVM:ProcessStateToStoppedConverter x:Key="ProcessStateToStoppedConverter"/>
    </Window.Resources>
    <DockPanel>
        <StackPanel DockPanel.Dock="Top" Orientation="Horizontal">
            <StackPanel DockPanel.Dock="Left" Orientation="Vertical" Width="520">
                <Border DockPanel.Dock="Top" Margin="5" Padding="5" BorderBrush="Black" BorderThickness="1,1,1,1" CornerRadius="5">
                    <StackPanel DockPanel.Dock="left" Orientation="Horizontal" Height="40">
                        <Ellipse Margin="5" Height="20" Width="20" HorizontalAlignment="Left" VerticalAlignment="Center" Stroke="Black" Fill="{Binding ProcessState, Converter={StaticResource ProcessStateToColorConverter}}"/>
                        <Label Content="State" Margin="5" Width="90" HorizontalContentAlignment="Left" VerticalContentAlignment="Center"/>
                    </StackPanel>
                </Border>
                <Border DockPanel.Dock="Top" Margin="5" Padding="5" BorderBrush="Black" BorderThickness="1,1,1,1" CornerRadius="5">
                    <Grid DockPanel.Dock="Left" Height="300">
                        <s:SciChartSurface ChartTitle="Profil" RenderableSeries="{s:SeriesBinding RenderableSeries}">
                            <s:SciChartSurface.XAxis>
                                <s:NumericAxis AxisTitle="Position, m" VisibleRange="{Binding XVisibleRange, Mode=TwoWay}"/>
                            </s:SciChartSurface.XAxis>
                            <s:SciChartSurface.YAxis>
                                <s:NumericAxis AxisTitle="Size, um" VisibleRange="{Binding YVisibleRange, Mode=TwoWay}"/>
                            </s:SciChartSurface.YAxis>
                        </s:SciChartSurface>
                    </Grid>
                </Border>
            </StackPanel>
...
ViewModel
namespace MyCom.HMI.ViewModel
{
    public class HMIViewModel : BindableBase
    {
        private readonly HMIModel _model = new();

        public HMIViewModel()
        {
            _renderableSeries = new ObservableCollection<IRenderableSeriesViewModel>();

            ((INotifyCollectionChanged)_model.TestControlData).CollectionChanged += (s, e) =>  { TestControlDataChanged(e); };

            InitCharts();
        }

...

        private ObservableCollection<IRenderableSeriesViewModel> _renderableSeries;
        public ObservableCollection<IRenderableSeriesViewModel> RenderableSeries
        {
            get { return _renderableSeries; }
            set
            {
                SetProperty(ref _renderableSeries, value, nameof(RenderableSeries));
            }
        }

        private IRange _xVisibleRange;
        public IRange XVisibleRange
        {
            get => _xVisibleRange;
            set
            {
                if (_xVisibleRange != value)
                {
                    SetProperty(ref _xVisibleRange, value, nameof(XVisibleRange));
                }
            }
        }

        private IRange _yVisibleRange;
        public IRange YVisibleRange
        {
            get => _yVisibleRange;
            set
            {
                if (_yVisibleRange != value)
                {
                    SetProperty(ref _yVisibleRange, value, nameof(YVisibleRange));
                }
            }
        }

        private XyDataSeries<double, double> _lineDataDiameter1;

...

        private void InitCharts()
        { // TODO
            _lineDataDiameter1 = new XyDataSeries<double, double>()
            {
                SeriesName = "Diameter1"
            };

            RenderableSeries.Add(new LineRenderableSeriesViewModel()
            {
                StrokeThickness = 2,
                Stroke = Colors.SteelBlue,
                DataSeries = _lineDataDiameter1,
                StyleKey = "LineSeriesStyle"
            });
        }

        private void TestControlDataChanged(NotifyCollectionChangedEventArgs args)
        {
            if (args.Action == NotifyCollectionChangedAction.Add && args.NewItems?.Count > 0)
            {
                var testControlActualState = args.NewItems.Cast<TestControlActualState>();

                List<double> xValues = new();
                List<double> yValuesDiameter1 = new();

                foreach (var item in testControlActualState)
                {
                    if (item.Diameter1 > 0f)
                    {
                        xValues.Add(item.FiberLength);
                        yValuesDiameter1.Add(item.Diameter1);
                    }
                }

                _lineDataDiameter1.Append(xValues, yValuesDiameter1);

                // TODO
                if (xValues.Count > 0)
                {
                    var cuurMaxValueX = xValues.Max();
                    XVisibleRange.Max = cuurMaxValueX;
                    XVisibleRange.Min = cuurMaxValueX - 7000f > 0 ? cuurMaxValueX - 7000f : 0;
                }

                // TODO
                if (yValuesDiameter1.Count > 0)
                {
                    var cuurMaxValueY = yValuesDiameter1.Max();
                    YVisibleRange.Max = cuurMaxValueY + 50;
                    YVisibleRange.Min = 0;
                }
            }
        }
Model
namespace MyCom.HMI.Model
{
    public class HMIModel : BindableBase, IDisposable
    {
        private readonly ObservableCollection<TestControlActualState> _testControlData;
        internal ReadOnlyObservableCollection<TestControlActualState> TestControlData { get; }

        public HMIModel()
        {
            _testControlData = new ObservableCollection<TestControlActualState>();
            TestControlData = new ReadOnlyObservableCollection<TestControlActualState>(_testControlData);
        }

...

        private void StartPollerThread()
        {
            _pollerCancellationToken ??= new CancellationTokenSource();

            if (!_pollerCancellationToken.IsCancellationRequested)
            {
                Task.Factory.StartNew(() => PollerDoWork(_pollerCancellationToken.Token), TaskCreationOptions.LongRunning);
            }
        }

        private void PollerDoWork(CancellationToken cancellationToken)
        {
            try
            {
                Thread.CurrentThread.Priority = ThreadPriority.Lowest;
                IsPollerStarted = true;

                while (!cancellationToken.IsCancellationRequested && (_isKeepConnection || _countOfTrying <= MAX_COUNT_OF_TRYING))
                {
                    try
                    {
                        _testControlData.Add(_emulator.GetTestControlActualState());

                        if (!_isKeepConnection && _countOfTrying > 0)
                        {
                            Thread.Sleep(_pollerTimeout / REASK_COEFICIENT);
                            continue;
                        }
                    }
                    catch
                    {
                        // Thread must be alive!!! ...ALWAYS!!!
                    }
                    Thread.Sleep(_pollerTimeout);
                }
            }
            finally
            {
                IsPollerStarted = false;
                _pollerCancellationToken = null;
            }
        }
- Fedor Iudin asked 4 months ago
- last active 4 months ago
Hello.
I’d checked examples from your Demo ‘SciChart.Examples.Demo’ and looks like the example “SciChart.Examples.Examples.CreateRealtimeChart.UsingSeriesValueModifier” is applicable for me because I need functionality like this.
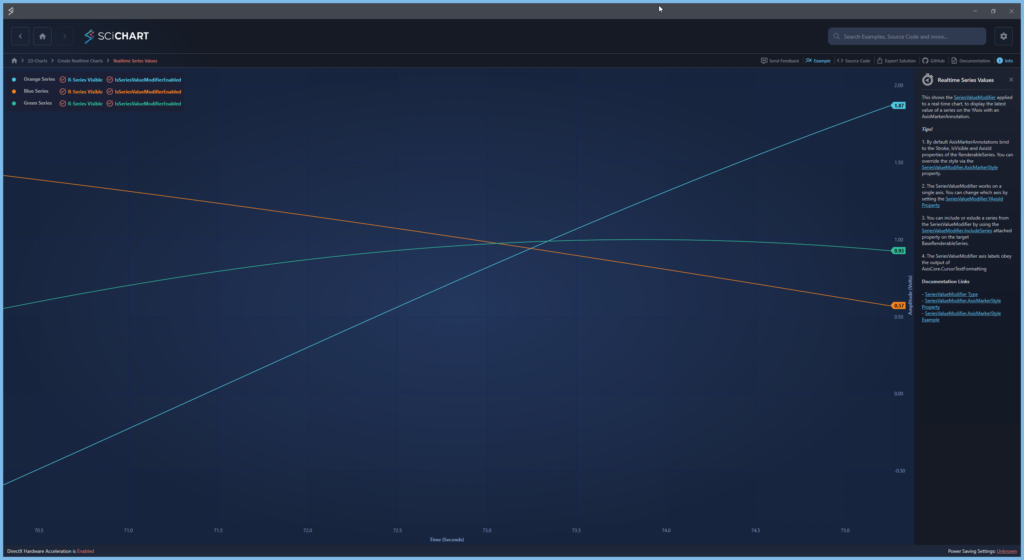
But as I understand Legend as LegendModifier component is a part of chart and it ‘know’ about chart data and can manipulate layout of it. In my application I want to have chart settings not in chart layout but in separate part of application. Can I bind chart settings with my custom controls? At start I want to set visibility for chart series which created in code
        private XyDataSeries<double, double> _lineDataDiameter1;
        private XyDataSeries<double, double> _lineDataDiameter2;
        private XyDataSeries<double, double> _lineDataCovering1;
        private XyDataSeries<double, double> _lineDataCovering2;
        private XyDataSeries<double, double> _lineDataCovering3;

private void InitCharts()
    { // TODO names and color maybe make as settings
        _lineDataDiameter1 = InitChart(new InitChartRequest() { ChartName = CHART_NAME_DIAMETER_1, LineColor = Colors.OrangeRed, ChartStyle = CHART_LINE_STYLE, LineThickness = CHART_LINE_THICKNESS });
        _lineDataDiameter2 = InitChart(new InitChartRequest() { ChartName = CHART_NAME_DIAMETER_2, LineColor = Colors.BlueViolet, ChartStyle = CHART_LINE_STYLE, LineThickness = CHART_LINE_THICKNESS });
        _lineDataCovering1 = InitChart(new InitChartRequest() { ChartName = CHART_NAME_COVERING_1, LineColor = Colors.LimeGreen, ChartStyle = CHART_LINE_STYLE, LineThickness = CHART_LINE_THICKNESS });
        _lineDataCovering2 = InitChart(new InitChartRequest() { ChartName = CHART_NAME_COVERING_2, LineColor = Colors.DeepSkyBlue, ChartStyle = CHART_LINE_STYLE, LineThickness = CHART_LINE_THICKNESS });
        _lineDataCovering3 = InitChart(new InitChartRequest() { ChartName = CHART_NAME_COVERING_3, LineColor = Colors.White, ChartStyle = CHART_LINE_STYLE, LineThickness = CHART_LINE_THICKNESS });
    }

    private XyDataSeries<double, double> InitChart(InitChartRequest request)
    {
        XyDataSeries<double, double> lineData = new()
        {
            SeriesName = request.ChartName,
        };

        RenderableSeries.Add(new LineRenderableSeriesViewModel()
        {
            StrokeThickness = request.LineThickness,
            Stroke = request.LineColor,
            DataSeries = lineData,
            StyleKey = request.ChartStyle,
        });

        return lineData;
    }
And additional little question. How can I make CursorModifier visible or not?
            <s:SciChartSurface.ChartModifier>
                <s:ModifierGroup>
                    <s:SeriesValueModifier/>
                    <s:CursorModifier/>
                </s:ModifierGroup>
            </s:SciChartSurface.ChartModifier>
Even if I make it like this
                <s:SciChartSurface.ChartModifier>
                    <s:ModifierGroup>
                        <s:SeriesValueModifier/>
                        <s:CursorModifier Visibility="Hidden"/>
                    </s:ModifierGroup>
                </s:SciChartSurface.ChartModifier>
I see it
- Fedor Iudin asked 3 months ago
- last active 2 months ago
Hello,
I have this
private readonly string CHART_MARKER_TEXT = "Marker";
private readonly string CHART_MARKER_STYLE = "VerticalLineAnnotationStyle"; // defined in Chart.xaml
AddVerticalLineAnnotation(new AnnotationRequest() { XValue = 3, LabelText = CHART_MARKER_TEXT, AnnotationStyle = CHART_MARKER_STYLE });
private void AddVerticalLineAnnotation(AnnotationRequest request)
{
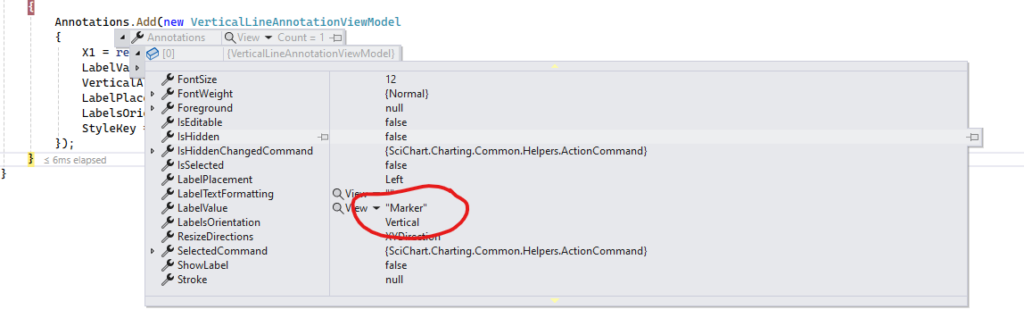
Annotations.Add(new VerticalLineAnnotationViewModel
{
X1 = request.XValue,
LabelValue = !string.IsNullOrEmpty(request.LabelText) ? request.LabelText : null,
VerticalAlignment = VerticalAlignment.Stretch,
LabelPlacement = LabelPlacement.Left,
LabelsOrientation = System.Windows.Controls.Orientation.Vertical,
StyleKey = request.AnnotationStyle,
});
}
And this
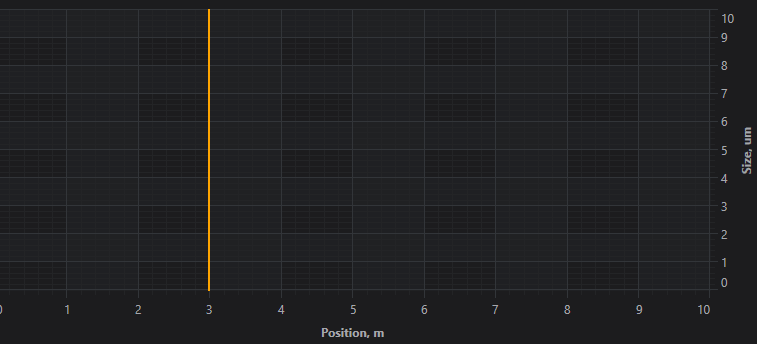
<Style x:Key="VerticalLineAnnotationStyle" TargetType="{x:Type s:VerticalLineAnnotation}">
    <Setter Property="Stroke" Value="Orange" />
    <Setter Property="StrokeThickness" Value="2" />
    <Setter Property="FontSize" Value="12" />
    <Setter Property="FontWeight" Value="Bold" />
</Style>
Why I can’t see Label?
- Fedor Iudin asked 3 months ago
- last active 3 months ago
There doesn’t seem to be a corresponding IRenderableSeries3DViewModel object like there is in the 2D charts. What am i suppose to bind to the RenderableSeries property of the SciChart3DSurface? If I bind to a
ObservableCollection<IRenderableSeriesViewModel>
object, then I don’t see a corresponding SurfaceMeshRenderableSeries3DViewModel object similar to LineRenderableSeriesViewModel for 2D?
A simple example of series binding using 3D charts would be great!
- Andy None asked 7 years ago
- last active 5 years ago
Hi,
I’m prototyping an application with two visible data series and an individual Y-axis for each data series. See the enclosed image.
The Stroke color of each data series, the TickTextBrush and the BorderBrush of the y-axis are updated by normal data Binding through the MVVM pattern.
The problem is that I am not able to data bind the Stroke property of the MajorTickLineStyle for the individual Y-axis.
Do You know if there is a workaround for this through data binding?
The project is enclosed.
- andreasrep asked 7 years ago
- last active 7 years ago
Hello
In Tutorial 06b – Realtime Updates, I want change the <s:SciChartSurface.XAxis> from <s:NumericAxis/> to <s:DateTimeAxis/> . I have tried a lot, but it still doesn’t work.
Could you please help me to do this work.
Thank you very much.
- Zhi Zhang asked 8 months ago
- last active 8 months ago
I have a TabControl that contains a dynamic number of chart panes via an ItemsControl. Inside the ItemsControl’s ItemsTemplate is a single ScichartSurface with bindings to the RenderableSeries, XAxis, YAxes, and VerticalChartGroup.
The xaml looks something like this:
<s:SciChartSurface name="Chart" RenderableSeries="{Binding rSeries}" XAxis={Binding xAxis} YAxes={Binding yAxes} s:SciChartGroup.VerticalChartGroup="{Binding vGroup}">
Within the surface, I have a ModifierGroup that contains (in order) a RubberbandXyZoomModifier (XAxisOnly), MouseWheelZoomModifier, ZoomPanModifier, ZoomExtentsModifier, and a custom mod call TimeSegmentSelectionModifier. All of these modifiers have their ReceiveHandledEvents property set to True, they are all under the same MouseEventGroup, and they all seem to work fine under normal circumstances.
Note: The Rubberband and TimeSegment modifiers are inversely set to Enabled. Meaning, only one of them functions at a time.
My issue is primarily with the RubberBand Mod:
Let’s say I have 5 chart panes being displayed and I want to zoom in; If I click and drag within the 3rd chart, every chart zooms correctly.
If I click withing the 3rd chart, drag the mouse outside of that chart (anywhere else on my screen) and let go, then only charts 1, 2, and 3 are zoomed correctly. Charts 4 and 5 won’t budge and act as if I had merely zoomed to extents.
This happens with any number of chart panes and the issue occurs on whatever pane I happened to be zooming in on.
I’ve been troubleshooting this issue for a few days now and I don’t know where else to look.
Any help is greatly appreciated.
- Chris Carberry asked 6 years ago
Hi, Support team.
I’m using MVVM pattern and trying to implement multi-chart which can insert Box Annotations at the same time into each chart .
So I’m testing in SciChart Example [“DigitalAnalyzerPerformanceDemo”] to know how to implement this.
But what i only got is just looping through and create annotation for each ChannelViewModels.
In the Demo, the VisibleRange ‘XRange’ is shared to all the ChannelViewModels by binding TwoWay-mode in ParentViewModel without looping for each ChildViewModels.
Like this, I wonder is there ways to apply BoxAnnotation all the ChannelViewModel at the same time by binding in ParentViewModel.
    <!-- BottomAxis -->
        <s:SciChartSurface Grid.Column="1">
            <s:SciChartSurface.XAxis>
                <s:NumericAxis Height="30"
                               AxisAlignment="Bottom"
                               VisibleRange="{Binding XRange, Mode=TwoWay}"
                               LabelProvider="{StaticResource TimeLabelProvider}"
                               MajorTickLineStyle="{StaticResource TimeAxisMajorTickLineStyle}"
                               MinorTickLineStyle="{StaticResource TimeAxisMinorTickLineStyle}"/>
            </s:SciChartSurface.XAxis>
            <s:SciChartSurface.YAxis>
                <s:NumericAxis Visibility="Collapsed"/>
            </s:SciChartSurface.YAxis>
        </s:SciChartSurface>
    </Grid>

    <!--  Create an X Axis with GrowBy  -->
     <s:SciChartSurface.XAxis>
           <s:NumericAxis Style="{StaticResource HiddenAxisStyle}"
                    VisibleRangeLimitMode="Min"
                    VisibleRangeLimit="0,0"
                    VisibleRange="{Binding DataContext.XRange, Mode=TwoWay, RelativeSource={RelativeSource AncestorType=ItemsControl, AncestorLevel=2}}"/>
     </s:SciChartSurface.XAxis>
I tried to bind annotation in ParentViewModel like XRange Binding method, But it doesn’t work.
This is View.xaml.
<Grid Grid.IsSharedSizeScope="True" IsEnabled="{Binding IsLoading, Converter={StaticResource InvertBooleanConverter}}">


    <!-- BottomAxis -->
        <s:SciChartSurface Grid.Column="1">
            <s:SciChartSurface.XAxis>
                <s:NumericAxis Height="30"
                               AxisAlignment="Bottom"
                               VisibleRange="{Binding XRange, Mode=TwoWay}"
                               LabelProvider="{StaticResource TimeLabelProvider}"
                               MajorTickLineStyle="{StaticResource TimeAxisMajorTickLineStyle}"
                               MinorTickLineStyle="{StaticResource TimeAxisMinorTickLineStyle}"/>
            </s:SciChartSurface.XAxis>
            <s:SciChartSurface.YAxis>
                <s:NumericAxis Visibility="Collapsed"/>
            </s:SciChartSurface.YAxis>
        </s:SciChartSurface>
    </Grid>

    <!-- Channels -->
        <ScrollViewer Background="#1C1C1E"
                      VerticalScrollBarVisibility="Auto"
                      HorizontalScrollBarVisibility="Disabled">

            <b:Interaction.Behaviors>
                <common:DigitalAnalyzerScrollBehavior ChannelHeightDelta="10" ChangeChannelHeightCommand="{Binding ChangeChannelHeightCommand}"/>
            </b:Interaction.Behaviors>

            <ItemsControl x:Name="chartItemsControl" ItemsSource="{Binding ChannelViewModels}">

                <b:Interaction.Behaviors>
                    <common:FocusedChannelScrollBehavior ScrollToFocusedChannel="False"/>
                </b:Interaction.Behaviors>

                <ItemsControl.ItemTemplate>
                    <DataTemplate DataType="{x:Type local:ChannelViewModel}">
                        <Grid Background="#2D2C32" Height="{Binding ChannelHeight, Mode=OneWay}" Focusable="False" UseLayoutRounding="False" >
                            <Grid.ColumnDefinitions>
                                <ColumnDefinition SharedSizeGroup="ChannelNames" />
                                <ColumnDefinition />
                            </Grid.ColumnDefinitions>

                            <Border BorderThickness="0,0,0,1" BorderBrush="#1C1C1E">
                                <DockPanel>
                                    <Border DockPanel.Dock="Left"
                                            Background="{Binding ChannelColor, Mode=OneWay}"
                                            Width="5"/>

                                    <TextBlock DockPanel.Dock="Left"
                                               Margin="10,5"
                                               VerticalAlignment="Center"
                                               Foreground="White"
                                               Text="{Binding ChannelName}"/>
                                </DockPanel>
                            </Border>

                            <s:SciChartSurface x:Name="channelSurface" Grid.Column="1"
                                               RenderableSeries="{Binding RenderableSeries}"
                                               Annotations="{s:AnnotationsBinding  DataContext.Annotations, Mode=TwoWay, RelativeSource={RelativeSource AncestorType=ItemsControl, AncestorLevel=2} }">

                                <!--  Create an X Axis with GrowBy  -->
                                <s:SciChartSurface.XAxis>
                                    <s:NumericAxis Style="{StaticResource HiddenAxisStyle}"
                                                   VisibleRangeLimitMode="Min"
                                                   VisibleRangeLimit="0,0"
                                                   VisibleRange="{Binding DataContext.XRange, Mode=TwoWay, RelativeSource={RelativeSource AncestorType=ItemsControl, AncestorLevel=2}}"/>
                                </s:SciChartSurface.XAxis>

                                <!--  Create a Y Axis with GrowBy. Optional bands give a cool look and feel for minimal performance impact  -->
                                <s:SciChartSurface.YAxis>
                                    <s:NumericAxis Style="{StaticResource HiddenAxisStyle}"
                                                   VisibleRange="{Binding YRange, Mode=OneWay}"/>
                                </s:SciChartSurface.YAxis>

                                <s:SciChartSurface.ChartModifier>
                                    <s:ModifierGroup s:MouseManager.MouseEventGroup="ChannelModifierGroup">
                                        <s:RubberBandXyZoomModifier IsAnimated="False" IsXAxisOnly="True" ZoomExtentsY="False" ReceiveHandledEvents="True" IsEnabled="{Binding IsChecked, Mode=OneWay, ElementName=IsZoomEnabled}"/>
                                        <s:ZoomPanModifier ZoomExtentsY="False" XyDirection="XDirection" IsEnabled="{Binding IsChecked, Mode=OneWay, ElementName=IsPanEnabled}"/>
                                        <s:ZoomExtentsModifier XyDirection="XDirection" IsAnimated="False" />
                                        <s:MouseWheelZoomModifier XyDirection="XDirection" />
                                    </s:ModifierGroup>
                                </s:SciChartSurface.ChartModifier>
                            </s:SciChartSurface>

                            <Border Grid.Column="1"
                                    BorderThickness="0,0,0,1"
                                    BorderBrush="#2D2C32"
                                    VerticalAlignment="Bottom"/>
                        </Grid>
                    </DataTemplate>
                </ItemsControl.ItemTemplate>
            </ItemsControl>
        </ScrollViewer>
    </Border>


</Grid>
This is ViewModel.cs
public class DigitalAnalyzerExampleViewModel : BaseViewModel
{
    private bool _isLoading;
    private DoubleRange _xRange;

    public DigitalAnalyzerExampleViewModel()
    {
        ChannelViewModels = new ObservableCollection<ChannelViewModel>();
        Annotations = new ObservableCollection<IAnnotationViewModel>();
        Annotations.Add(new BoxAnnotationViewModel() { X1 = 0, X2 = 1000, Y1 = 0, Y2 = 1 }); //I want to implement sharing annotation like this.

        SelectedChannelType = "Digital";
        SelectedChannelCount = 32;
        SelectedPointCount = 1000000;
        SelectedResamplingPrecision =ResamplingPrecision.Default;
        SelectedStrokeThickness = 1;

        ChangeChannelHeightCommand = new ActionCommand<object>((d) =>
        {
            var delta = (double)d;
            foreach (var channelViewModel in ChannelViewModels)
            {
                channelViewModel.SetChannelHeightDelta(delta);
            }
        });

        AddChannelCommand = new ActionCommand(async () =>
        {
            IsLoading = true;

            var isDigital = SelectedChannelType == "Digital";
            await AddChannels(isDigital ? 1 : 0, isDigital ? 0 : 1);

            IsLoading = false;
        });

        LoadChannelsCommand = new ActionCommand(async () =>
        {
            IsLoading = true;

            // Clear ViewModels
            foreach (var channelVm in ChannelViewModels)
            {
                channelVm.Clear();
            }
            ChannelViewModels.Clear();
            XRange = null;

            // Create a bunch of Digital channels
            await AddChannels(SelectedChannelCount, 0);

            XRange = new DoubleRange(0, SelectedPointCount);
            IsLoading = false;
        });

        LoadChannelsCommand.Execute(null);
    }


    public ObservableCollection<ChannelViewModel> ChannelViewModels { get; private set; }
    public ObservableCollection<IAnnotationViewModel> Annotations { get; private set; }

    public string SelectedChannelType { get; set; }


    public ResamplingPrecision SelectedResamplingPrecision { get; set; }

    public int SelectedChannelCount { get; set; }

    public ActionCommand<object> ChangeChannelHeightCommand { get; }

    public ActionCommand AddChannelCommand { get; }

    public ActionCommand LoadChannelsCommand { get; }

    public long TotalPoints => ChannelViewModels.Sum(c => (long)c.DataCount);

    public bool IsLoading
    {
        get => _isLoading;
        set
        {
            _isLoading = value;
            OnPropertyChanged(nameof(IsLoading));
        }
    }

    public bool IsEmpty => ChannelViewModels.Count <= 0;

    public DoubleRange XRange
    {
        get => _xRange;
        set
        {
            _xRange = value;
            OnPropertyChanged(nameof(XRange));
        }
    }
}
+Attached image below is what i want to implement.
++I also attached tried code in .zip .
- Hyunji Jeon asked 2 years ago
- last active 2 years ago
