I have a WPF TextBlock control that I want to set the foreground color for based on the colors in the current SciChart theme (I want to make it the same color as, say, the axis titles). How do I access the color values for the current theme?
- David Adams asked 9 years ago
- last active 9 years ago
I have a panel with two charts, that contains a OhlsDataSeries and theirs XAxis is DateTimeAxis. When it zooms i see a something strange:

My code:
<s:SciChartSurface SeriesSource="{Binding ChartSeriesViewModels}"
                   s:SciChartGroup.VerticalChartGroup="{Binding Parent.VerticalChartGroupId}"
                   ViewportManager="{Binding Parent.ViewportManager}">
    <s:SciChartSurface.ChartModifier>
        <s:ModifierGroup s:MouseManager.MouseEventGroup="23">
            <s:ZoomPanModifier ExecuteOn="MouseLeftButton"/>
            <s:MouseWheelZoomModifier />
            <s:CursorModifier ShowAxisLabels="True" UseInterpolation="False" UseLayoutRounding="True"  ReceiveHandledEvents="True"/>
            <s:YAxisDragModifier/>
            <s:XAxisDragModifier/>
            <s:ZoomExtentsModifier ExecuteOn="MouseDoubleClick"/>
        </s:ModifierGroup>
    </s:SciChartSurface.ChartModifier>

    <s:SciChartSurface.XAxis>
        <s:DateTimeAxis VisibleRange="{Binding Parent.VisibleRange, Mode=TwoWay}"
                        TextFormatting="hh:mm dd.MM.yyyy"
                        DrawMajorBands="True"
                        GrowBy="0.0, 0.1"/>
    </s:SciChartSurface.XAxis>

    <s:SciChartSurface.YAxis>
        <s:NumericAxis AutoRange="Always"
                       GrowBy="0.1, 0.1"/>
    </s:SciChartSurface.YAxis>

</s:SciChartSurface>
And second question:
Is there any way to make the cursor sticks to the points?
- l1pton17 asked 10 years ago
- last active 10 years ago
How can i change default chart title style? like margin,font size etc
- Raghupathy asked 10 years ago
- last active 10 years ago
Is it possible use SciChart to rotate the point markers on chart by a z value? I’d like to produce a chart similar to the attached wind chart sample from the weather underground website.
- wawr asked 9 years ago
- last active 9 years ago
I am trying to change the background color to match the background of the SciChartSurface but it just doesn’t want to change colors. I have a property bound to enable and disable the legend and that works fine. I tried doing the same for the “Background” property for SciChartLegend but nothing works. Even hard coding a brush doesn’t work. What am I missing?
I am using SciChart v3.42.0.6778
SciChartSurface instantiation in XAML. I am using the BrightSpark default theme.
<s:SciChartSurface Name="SciChartSurface"
Grid.Row="0"
Background="{Binding BackgroundColor, Converter={StaticResource ColorToSolidColorBrushConverter}}"
ChartTitle="{Binding GraphTitle}"
SeriesSource="{Binding GraphRenderModels}"
s:ThemeManager.Theme="BrightSpark">
Modifiers
<s:SciChartSurface.ChartModifier>
<s:ModifierGroup>
    <s:RubberBandXyZoomModifier IsAnimated="True"
                                IsEnabled="True"
                                IsXAxisOnly="False"
                                RubberBandFill="#99AAAAAA"
                                ZoomExtentsY="False" />
    <s:ZoomPanModifier ExecuteOn="MouseMiddleButton" IsEnabled="True" />
    <s:ZoomExtentsModifier ExecuteOn="MouseDoubleClick"
                           IsEnabled="True"
                           XyDirection="XDirection" />
    <s:MouseWheelZoomModifier IsEnabled="True" XyDirection="YDirection" />
    <s:YAxisDragModifier AxisId="LeftAxis" />
    <s:YAxisDragModifier AxisId="RightAxis" />
    <s:XAxisDragModifier ClipModeX="None" />
    <s:CursorModifier Name="CursorModifier" IsEnabled="{Binding ShowCursors, Mode=TwoWay}">
        <s:CursorModifier.LineOverlayStyle>
            <Style TargetType="Line">
                <Setter Property="Stroke" Value="LightGray" />
            </Style>
        </s:CursorModifier.LineOverlayStyle>
    </s:CursorModifier>
    <s:LegendModifier Margin="6"
                      GetLegendDataFor="AllSeries"
                      LegendPlacement="Inside"
                      Orientation="Horizontal"
                      ShowLegend="{Binding ShowLegend}"
                      ShowVisibilityCheckboxes="False" />
</s:ModifierGroup>
</s:SciChartSurface.ChartModifier>
When I attempt to change the background, I use the following:
<s:LegendModifier Margin="6"
GetLegendDataFor="AllSeries"
LegendPlacement="Inside"
Orientation="Horizontal"
    Background="{Binding BackgroundColor, Converter={StaticResource ColorToSolidColorBrushConverter}}"
ShowLegend="{Binding ShowLegend}"
ShowVisibilityCheckboxes="False" />
Which doesn’t work, though other color bindings in XAML work fine. If I change the color directly, say Background=”Red” or Background=”#FF0000″ It does not change either.
- Alex Helms asked 9 years ago
- last active 9 years ago
Hello!
I’ m working with big number of annotations. They’re creating an image of earth section profile. We need to recreate them everytime, when visible range changed. For these purposes we use MouseWheelZoom and ZoomPanModifier. And when go to another region of our image or zoom it,it flickers. I had a thought that the problem was that I deleted all annotations and the duration between deleting old and creating new was that flicker. I rewrited the code so he added annotation at first and then deleted old annotations. Here is it:
            foreach (var mainSectLine in mainSectLines)
            {
                Color tempColor = new Color();
                double temp = mainSectLine.val/maxValueForPainting;
                if (temp < 0.2) tempColor = Colors.Blue;
                else
                {
                    if (temp < 0.4) tempColor = Colors.Green;
                    else
                    {
                        if (temp < 0.6) tempColor = Colors.Yellow;
                        else
                        {
                            if (temp < 0.8) tempColor = Colors.Orange;
                            else
                            {
                                tempColor = Colors.Red;
                            }
                        }
                    }
                }

                var tempBrush = new SolidColorBrush(tempColor);
                if (tempBrush.CanFreeze)
                {
                    tempBrush.Freeze();
                }
                LineAnnotationItem lineAnnotation = new LineAnnotationItem()
                {
                    Index = Index,
                    X1 = mainSectLine.THL1,
                    X2 = mainSectLine.THL2,
                    Y1 = -mainSectLine.TVD1,
                    Y2 = -mainSectLine.TVD2,
                    YAxisId = textOfYAxis,
                    Stroke = tempBrush,
                    AnnotationCanvas = AnnotationCanvas.BelowChart,
                };
                AnnotationCollection.Add(lineAnnotation);
            }
            List<IAnnotation> annotationsToDelete =
                AnnotationCollection.Where(q => q.GetType() == typeof (LineAnnotationItem)&&((LineAnnotationItem)q).Index==Index-1).ToList();
            foreach (IAnnotation annotation in annotationsToDelete)
            {
                AnnotationCollection.Remove(annotation);
            }
But that does not make a sense. So it also took a lot of time to detach and attach annotations. To solve that trouble, I rewrited function:
List<IAnnotation> annotations =
                AnnotationCollection.Where(q => q.GetType() != typeof (LineAnnotationItem)).ToList();
            AnnotationCollection tempAnnotationCollection=new AnnotationCollection();
            foreach (var mainSectLine in mainSectLines)
            {
                Color tempColor = new Color();
                double temp = mainSectLine.val/maxValueForPainting;
                if (temp < 0.2) tempColor = Colors.Blue;
                else
                {
                    if (temp < 0.4) tempColor = Colors.Green;
                    else
                    {
                        if (temp < 0.6) tempColor = Colors.Yellow;
                        else
                        {
                            if (temp < 0.8) tempColor = Colors.Orange;
                            else
                            {
                                tempColor = Colors.Red;
                            }
                        }
                    }
                }

                var tempBrush = new SolidColorBrush(tempColor);
                if (tempBrush.CanFreeze)
                {
                    tempBrush.Freeze();
                }
                LineAnnotationItem lineAnnotation = new LineAnnotationItem()
                {
                    Index = Index,
                    X1 = mainSectLine.THL1,
                    X2 = mainSectLine.THL2,
                    Y1 = -mainSectLine.TVD1,
                    Y2 = -mainSectLine.TVD2,
                    YAxisId = textOfYAxis,
                    Stroke = tempBrush,
                    AnnotationCanvas = AnnotationCanvas.BelowChart,
                };
                tempAnnotationCollection.Add(lineAnnotation);
            }
            AnnotationCollection = tempAnnotationCollection;
            foreach (IAnnotation annotation in annotations)
            {
                AnnotationCollection.Add(annotation);
            }
But there are still flickers when pan or zoom, but it works a bit faster.
So how can I eliminate these flickers? What can I do to speed up adding and deleting annotations?
- ilyas asked 10 years ago
I was trying to figure out why I couldn’t get minor tick marks to appear on my axes and then I realized it’s because of the theme I was using (BrightSpark). Just a heads up to anyone else who may run into this.
IMO themes should not hide chart features such as tick marks.
- David Adams asked 9 years ago
- last active 9 years ago
Hello,
i have a realtime chart and per default there should be AutoRange=true.
Now the user want to zoom in – the autorange prevent this.
I think, I have to switch off the AutoRange when the user zoom in and switch on AutoRange when the user doubleclick (zoomextendsmodifier). But how can I identify if the user has zoomed?
Or is there another solution?
- miri asked 11 years ago
- last active 8 years ago
Hi
I have to build a financial chart, and the Y label must be always multiplied by 0.25 , as you can see in the image attached.
I didn’t find how to reach this goal in the documentation and in the knowledgebase articles either.
Could you please help me?
- lorenzo522 asked 8 years ago
- last active 8 years ago
Hey there!
How do I set the interval between grid lines to be a fixed value?
For example, my xAxis is a DateTimeAxis and I want a grid line drawn at one hour intervals, regardless of zooming.
Same goes for my yAxis (NumericAxis)
Thanks
- catalin asked 12 years ago
I am currently adding line to a chart to show when a value is ON and using the gap in a series feature to indicate when the value is OFF. In order for this to work I need to update the chart every few seconds when the value is ON; however, I do not want to add additional points; instead I want to either update a point in the line series or I want to remove a point and then add a new point. In my case its the x-axis value that I need to change.
Can you please suggest if this is possible?
If yes I am also wondering how to best find a specific point in a line series.
- sdemooy asked 12 years ago
Request for enhancement to polar charts to allow for rotation of the X axis. I want to use this chart type with compass directions. Therefore a range of 0-360 with 0 at the top of the chart.
I was able to use the workaround for rotation here:
https://www.scichart.com/questions/question/polar-chart-x-axis-starting-point-and-direction
However as the OP on that question noted there are several drawbacks to simply rotating the entire chart surface.
Also I found that at run-time rotating the chart surface is inaccurate as in this example:
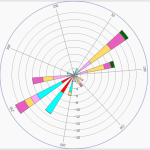
As you can see the 100 degree mark is not in the correct location. Directly right should be 90.
In the designer the chart axis looks as it should:
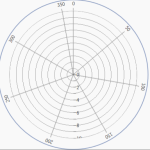
- wawr asked 9 years ago
- last active 5 years ago
Hi all,
I developed my application in real time where i introduce my WPF in winforms
So i developed the class Graph.xaml.cs where i defined my function :
public void CreateDataSetAndSeries(List lstX, List lstY)
{
series0 = new XyDataSeries<DateTime, double>();
using (this.sciChartSurface.SuspendUpdates())
{
series0.Append(lstX, lstY);
}
lineSeries.DataSeries = series0;
sciChartSurface.ZoomExtentsY();
}
i don’t make the code of charting in the constructor also not in the function sciChartSurface_Loaded() because i must filling those list from the winforms frame after this i make the code for zooming in the Graph.xaml :
<SciChart:SciChartSurface.ChartModifier>
<SciChart:RubberBandXyZoomModifier/>
                <SciChart:ZoomPanModifier ExecuteOn="MouseRightButton"/>
                    <SciChart:ZoomExtentsModifier ExecuteOn="MouseDoubleClick"/>

                <SciChart:CursorModifier ReceiveHandledEvents="True" ShowAxisLabels="True"  ShowTooltip="True" ShowTooltipOn="MouseRightButtonDown"/>
But the problem i have the two cursor (like the picture) but i can’t did the zoom pan (also i put stop for my application to make a Zoom but i have the same problem ) !! i am blocked in this step someone can help me it’s urgent ! and Thank you !
- sahar Les asked 9 years ago
- last active 9 years ago
I’m new to SciChart and I’m trying to play with stockcharts now. In the file ‘SciChart Class Library.chm’ in some places description is missing for example in DataSeries.Append Method I see [Missing documentation for “M:Abt.Controls.SciChart.DataSeries2.Append(0,`1[])”].
This is slows the progress to get clear understanding how things works. Is there any full description of the library, maybe I’m missing something?
- ivankostin asked 11 years ago
- last active 7 years ago
Hi!
Our Designer wants the LineGraphs to continue under the axis and the gridlines area not to have a border, to accomplish some kind of “open” look&feel.
To get this working, i think i need to template the scichartsurface and put the axis over the gridlinesarea.
I did not find any hints on templating the surface itself, only other parts.
In the example styles you only change colors and borders, but not the template itself.
Can you give me some advice? Am i even on the right track?
Thanks,
Claudius
- Claudius Hagen asked 10 years ago
- last active 2 years ago
Hi,
i use a ZoomPanModifier so that the user can drag the chart with the right mouse. First, XyDirection was not set, so the user could drag in X and Y direction.
I wanted to change this behaviour so that the modifier works like the RubberBandXyZoomModifier (with ZoomExtentsY = false). That means, only moving the chart in X-Direction, but not Y.
So i set XyDirection of the ZoomPanModifier to “XDirection”. Now, the user can’t scroll in Y. So far so good. But now the chart is autoscaled in Y direction on the first X-Movement, even with AutoRange turned off! Is this a bug? If not, what can i do to prevent this unwanted auto scaling?
Best regards,
Robin
- Andreas Mueller-Bluemlein asked 11 years ago
I’m trying to have a two charts which have a x-axis points (datetime) that doesn’t intersect. And i want charts was synchronized like this:

How you can see here upper chart doesn’t have a point at 10.12.2013, but lower has. Can i reach same effect by SciChart?
- l1pton17 asked 10 years ago
- last active 10 years ago
Hi,
I need to implement a chart that looks pretty much like the attached one. The chart has the following requirements:
– the x-axis position is always at value 0.0
– the length (in pixel) the x-axis must always have the same length as the positive part of the y-axis
– the displayed data range on the y-axis must always be twice as much as on the x-axis (e.g 0-5 on x-axis means 0-10 on y-axis). So if the charts updates the visible range on the y-axis, the x-axis range must be updates as well and and vice versa.
I really don’t know if that’s even possible with Scichart? If yes could you please give me some initial help how to get this done?
Thx
Joerg
- Joerg Hoehn asked 11 years ago
- last active 10 years ago
I created a very simple project with a single grid and one element which is the scichart. Everything renders normally when the program first starts. If I make the window smaller vertically by dragging, everything continues to render correctly, but when I increase the height of the window by dragging, the vertical axis value label (4000.00) gets clipped if I go about 50 pixels more than the original window height specified.
Note: the clipping is all at once, if I go one pixel too far, the labels clip as shown. If I make the window one pixel smaller, they appear normally again.
What can I do?

- Joseph Zarycki asked 9 years ago
- last active 9 years ago
Hi
In terms of a oscilloscope for instance you can calculate what the time per division (time/div) is for the y-axis and the volts per division for the x-axis. This changes when you zoom in and out.
My question is how can I calculate these in the simplest way possible to calculate the volts per division according to the current zoom level?
You will obviously have inputs of the start frequency and amplitude when the application start or whenever these inputs changes on the units side.
But when you zoom in and out depending on whether you are zooming the y-axis or x-axis or both the time / div and volts / div needs to be calculated.
Thanks a lot Gert
- Gertdt76 asked 10 years ago
- last active 10 years ago
Hello guys,
Do series have some property of it renderable type?
I founded in ‘AddRemoveSeries’ example this line
// dataSeries.RenderAs = new LineSeries() { SeriesColor = DataManager.Instance.GetRandomColor() };
Or can you tell how can i add/remove/change series and its renderable style dinamically ?
Im using this code to replace series
void Create (OhlcDataSeries<DateTime, double> ser, SeriesType s …)
{
var renderseries = new FastCandlestickRenderableSeries { };
ChartControl.RenderableSeries.Add(renderseries);
ChartData.Add (ser);
}
void Replace (OhlcDataSeries<DateTime, double> ser, …)
{
int k = GetIndex ();
 ChartData.RemoveAt(k);
 ChartControl.RenderableSeries.RemoveAt (k);
 Create (ser, type ..);
}
Is it right way? looks like pornography
I think there will be some problems with overview
Example:
we got 2 series (price(candles) and ema (line)) overview shows price chart and after we change price series type to line, overview will show ema series, not price
- VRueda asked 11 years ago
Hi,
I wonder, if it’s possible to force the SciChartSurface control to resize itself depending on a size of the actual data area, given that axis are in the auto-range mode. For example, when the Y range is large than X range, the entire control resizes into the portrait orientation, thus keeping square pixels in the data area.
Thank you in advance!
Ilia
- corvex asked 9 years ago
- last active 9 years ago
Hi,
Can you tell me if it is possible to make a contour plot like on the image i have attached?
I cant seem to find a way to do that.
Best regards,
Jeppe
- Unisense A/S Tueager asked 10 years ago
I made an example based on the “Vertically Stacked Axes” from SciChart Examples. The main difference is that I can add DataSeries / YAxes on the fly.
The problem is that when DrawMajorGridLines, DrawMinorGridLines are turned ON the are drawn only at the first trace.
- Jan Kaiser asked 10 years ago
- last active 9 years ago
Hello,
I am currently evaluating the chart library, and plotting a FastLineRenderableSeries with an Ellipse PointMarker.
This displays exactly the graph I want. However, I would like that when the user hovers over a point, the point would highlight and he can see a tooltip showing what is the exact X value and the exact Y value.
Example of what I would like : http://www.highcharts.com/demo/line-basic
Would be even better if when hovering over the line the “nearest” actual point were highlighted with the tooltip.
I have tried a quick search and haven’t come up with the solution yet, note I am new to the library.
Thanks
- Jean-Jacques Bouzaglou asked 8 years ago
- last active 8 years ago
On priority support tickets, a user just asked us how to show and hide the AxisTitle TextBlock without changing the AxisTitle.Text to string.Empty.
The solution uses attached properties and a small custom style, so we thought we’d post it below
- Andrew Burnett-Thompson asked 9 years ago
- last active 9 years ago
Hi sciChart,
I create a custom annotation base type BoxAnnotation.
<s:BoxAnnotation x:Class="ChartComponent.Annotations.TowLines"
xmlns=" http://schemas.microsoft.com/winfx/2006/xaml/presentation"
xmlns:x=" http://schemas.microsoft.com/winfx/2006/xaml"
xmlns:s=" http://schemas.abtsoftware.co.uk/scichart">
</s:BoxAnnotation>
I use style
<Style BasedOn="{StaticResource AnnotationBaseStyle}" TargetType="Annotations:TowLines">
<Setter Property="Template">
<Setter.Value>
<ControlTemplate TargetType="s:BoxAnnotation">
<Border x:Name="PART_BoxAnnotationRoot"
Margin="{TemplateBinding Margin}"
Background="{TemplateBinding Background}"
BorderBrush="{TemplateBinding BorderBrush}"
BorderThickness="{TemplateBinding BorderThickness}"
CornerRadius="{TemplateBinding CornerRadius}">
<Grid>
<Grid.RowDefinitions>
<RowDefinition Height="2"/>
<RowDefinition Height=""/>
<RowDefinition Height="2"/>
</Grid.RowDefinitions>
<Grid.ColumnDefinitions>
<ColumnDefinition Width=""/>
                            </Grid.ColumnDefinitions>
                            <s:HorizontalLineAnnotation Grid.Row="0" Grid.Column="0" VerticalContentAlignment="Top" Stroke="Blue" Margin="0,0,50,0" StrokeThickness="2">
                                <s:AnnotationLabel LabelPlacement="Right" FontSize="10" Foreground="White"/>
                            </s:HorizontalLineAnnotation>
                            <s:HorizontalLineAnnotation Grid.Row="2" Grid.Column="0" VerticalContentAlignment="Bottom" Stroke="Red" Margin="0,0,50,0" StrokeThickness="2">
                                <s:AnnotationLabel LabelPlacement="Right" FontSize="10" Foreground="White"/>
                            </s:HorizontalLineAnnotation>
                        </Grid>
                    </Border>
                </ControlTemplate>
            </Setter.Value>
        </Setter>
    </Style>
The label of HorizontalLineAnnotation in custom annotation not show.
- shiwa asked 11 years ago
Hi,
I have some plots that lay vertically, and I want them align well, how to sync the Y Axis that is located at left width to have same width of X Axis which is located at the bottom.
Thanks.
- mingfang asked 11 years ago
I am trying to implement the DigitalFastLine Series from the example given in ‘http://support.scichart.com/index.php?/Knowledgebase/Article/View/17224/37/how-to-make-line-series-draw-to-the-right-edge-of-the-chart’
public class LinesEnumerable : IEnumerable<Point>
{
    protected readonly IPointSeries _pointSeries;
    protected readonly ICoordinateCalculator<double> _xCoordinateCalculator;
    protected readonly ICoordinateCalculator<double> _yCoordinateCalculator;
    protected readonly bool _isDigitalLine;

    /// <summary>
    /// Initializes a new instance of the <see cref="LinesEnumerable" /> class.
    /// </summary>
    /// <param name="pointSeries">The point series.</param>
    /// <param name="xCoordinateCalculator">The x coordinate calculator.</param>
    /// <param name="yCoordinateCalculator">The y coordinate calculator.</param>
    /// <param name="isDigitalLine">if set to <c>true</c> return a digital line .</param>
    public LinesEnumerable(IPointSeries pointSeries, ICoordinateCalculator<double> xCoordinateCalculator, ICoordinateCalculator<double> yCoordinateCalculator, bool isDigitalLine)
    {
        _pointSeries = pointSeries;
        _xCoordinateCalculator = xCoordinateCalculator;
        _yCoordinateCalculator = yCoordinateCalculator;
        _isDigitalLine = isDigitalLine;
    }

    /// <summary>
    /// Returns an enumerator that iterates through a collection.
    /// </summary>
    /// <returns>
    /// An <see cref="T:System.Collections.IEnumerator" /> object that can be used to iterate through the collection.
    /// </returns>
    public virtual IEnumerator<Point> GetEnumerator()
    {
        return _isDigitalLine ?
            (IEnumerator<Point>)new DigitalLinesIterator(_pointSeries, _xCoordinateCalculator, _yCoordinateCalculator) :
            new LinesIterator(_pointSeries, _xCoordinateCalculator, _yCoordinateCalculator);
    }

    /// <summary>
    /// Returns an enumerator that iterates through a collection.
    /// </summary>
    /// <returns>
    /// An <see cref="T:System.Collections.IEnumerator" /> object that can be used to iterate through the collection.
    /// </returns>
    IEnumerator IEnumerable.GetEnumerator()
    {
        return GetEnumerator();
    }
}
However, when I try to do the following:
linesEnumerable = linesEnumerable.Concat(new[] { new Point(viewportWidth, lastYCoordinate) });
it says ‘System.Collections.IEnumerable’ does not contain a definition for ‘Concat’ and the best extension method overload ‘System.Linq.Queryable.Concat(System.Linq.IQueryable, System.Collections.Generic.IEnumerable)’ has some invalid arguments
I already have System.Linq and Collections namespace added
using System;
using System.Data;
using System.Linq;
using System.ComponentModel;
using System.Collections;
using System.Collections.Generic;
using System.Net;
using System.Windows;
using System.Windows.Controls;
using System.Windows.Documents;
using System.Windows.Ink;
using System.Windows.Input;
using System.Windows.Media;
using System.Windows.Media.Animation;
using System.Windows.Shapes;
using Abt.Controls.SciChart;
using Abt.Controls.SciChart.Model.DataSeries;
using Abt.Controls.SciChart.Utility;
using Abt.Controls.SciChart.Visuals;
using Abt.Controls.SciChart.Visuals.Axes;
using Abt.Controls.SciChart.Visuals.RenderableSeries;
using System.Globalization;
using System.Windows.Data;
using Abt.Controls.SciChart.Rendering.Common;
using Abt.Controls.SciChart.Numerics.CoordinateCalculators;
What’s going on here? Can you improve your sample?
Thanks!
- Azrin Sani asked 9 years ago
- last active 9 years ago
I deleted my prior question and instead provide code that reproduces the error. I just whipped up two SciChartSurfaces in xaml and bind to properties provided in code behind. Can you please take a look and see whether you also can RubberBandXyZoom but not correctly use ZoomPan? ZoomPan is not synced between the two charts. Its been a very frustrating couple hours….without finding the bug.
public partial class TestControl : UserControl
{
    private ILabelProvider _xAxisFormat;
    private string yAxisFormat;
    private ObservableCollection<IChartSeriesViewModel> _series1;
    private ObservableCollection<IChartSeriesViewModel> _series2;
    private DateRange _sharedXRange;

    public TestControl()
    {
        //SciChartSurface.SetLicenseKey(
        //    @"
        //    <LicenseContract>
        //      ....License Code goes here
        //    </LicenseContract>

        //    ");

        XAxisFormat = new DateTimeLabelProvider();
        YAxisFormat = "0.00";

        Series1 = new ObservableCollection<IChartSeriesViewModel>(new List<IChartSeriesViewModel>() { GenerateSampleLineSeries() });
        Series2 = new ObservableCollection<IChartSeriesViewModel>(new List<IChartSeriesViewModel>() { GenerateSampleLineSeries() });

        //set shared xRange
        SharedXRange = new DateRange((DateTime) Series1.First().DataSeries.XMin, (DateTime) Series1.First().DataSeries.XMax);

        InitializeComponent();
    }

    public ObservableCollection<IChartSeriesViewModel> Series1
    {
        get { return _series1; }
        set
        {
            _series1 = value;
        }
    }

    public ObservableCollection<IChartSeriesViewModel> Series2
    {
        get { return _series2; }
        set
        {
            _series2 = value;
        }
    }

    public DateRange SharedXRange
    {
        get { return _sharedXRange; }
        set
        {
            _sharedXRange = value;
        }
    }

    public ILabelProvider XAxisFormat
    {
        get { return _xAxisFormat; }
        set
        {
            _xAxisFormat = value;
        }
    }

    public string YAxisFormat
    {
        get { return yAxisFormat; }
        set
        {
            yAxisFormat = value;
        }
    }

    private IChartSeriesViewModel GenerateSampleLineSeries()
    {
        var seriesName = "TestLineSeries" + (new Random((int)DateTime.Now.Ticks)).Next();
        List<DateTime> timeStamps = new List<DateTime>();
        List<double> values = new List<double>();
        Random rand = new Random((int)DateTime.Now.Ticks);
        DateTime currentDt = DateTime.Now;
        double currentValue = 0;

        for (int index = 0; index < 1000; index++)
        {
            currentDt = currentDt.AddMinutes(1);
            currentValue = currentValue + (rand.NextDouble() - 0.5);

            timeStamps.Add(currentDt);
            values.Add(currentValue);
        }

        var dataSeries = new XyDataSeries<DateTime, double>();
        dataSeries.SeriesName = seriesName;
        dataSeries.Append(timeStamps, values);


        var renderSeries = new FastLineRenderableSeries() { Name = dataSeries.SeriesName, DataSeries = dataSeries, AntiAliasing = false, StrokeThickness = 2 };

        return new ChartSeriesViewModel(dataSeries, renderSeries);
    }
}


<UserControl x:Class="MattLibrary.ChartLibrary.Views.TestControl"
         xmlns="http://schemas.microsoft.com/winfx/2006/xaml/presentation"
         xmlns:x="http://schemas.microsoft.com/winfx/2006/xaml"
         xmlns:mc="http://schemas.openxmlformats.org/markup-compatibility/2006"
         xmlns:d="http://schemas.microsoft.com/expression/blend/2008"
         xmlns:s="http://schemas.abtsoftware.co.uk/scichart"
         mc:Ignorable="d"
         d:DesignHeight="300" d:DesignWidth="300"
         DataContext="{Binding RelativeSource={RelativeSource Self}}">
<Grid>

    <Grid.RowDefinitions>
        <RowDefinition Height="1*"/>
        <RowDefinition Height="1*"/>
    </Grid.RowDefinitions>

    <s:SciChartSurface Grid.Row="0" SeriesSource="{Binding Series1}">

        <s:SciChartSurface.XAxis>
            <s:DateTimeAxis
                            Visibility="Visible"
                            LabelProvider="{Binding XAxisFormat}"
                            VisibleRange="{Binding SharedXRange}"
                            GrowBy="0.01, 0.01"/>
        </s:SciChartSurface.XAxis>

        <s:SciChartSurface.YAxis>
            <s:NumericAxis
                            Visibility="Visible"
                            AxisAlignment="Right"
                            TextFormatting="{Binding YAxisFormat}"
                            GrowBy="0.03, 0.03"
                            AutoRange="Always"/>
        </s:SciChartSurface.YAxis>

        <s:SciChartSurface.ChartModifier>

            <s:ModifierGroup s:MouseManager.MouseEventGroup="SharedMouseGroup">

                <s:ZoomPanModifier IsEnabled="True" ReceiveHandledEvents="True" XyDirection="XDirection" ExecuteOn ="MouseLeftButton"/>
                <s:RubberBandXyZoomModifier IsEnabled="True" ReceiveHandledEvents="True" IsXAxisOnly="True" ExecuteOn="MouseRightButton"/>

            </s:ModifierGroup>
        </s:SciChartSurface.ChartModifier>

    </s:SciChartSurface>


    <s:SciChartSurface Grid.Row="1" SeriesSource="{Binding Series2}">

        <s:SciChartSurface.XAxis>
            <s:DateTimeAxis
                            Visibility="Visible"
                            LabelProvider="{Binding XAxisFormat}"
                            VisibleRange="{Binding SharedXRange}"
                            GrowBy="0.01, 0.01"/>
        </s:SciChartSurface.XAxis>

        <s:SciChartSurface.YAxis>
            <s:NumericAxis
                            Visibility="Visible"
                            AxisAlignment="Right"
                            TextFormatting="{Binding YAxisFormat}"
                            GrowBy="0.03, 0.03"
                            AutoRange="Always"/>
        </s:SciChartSurface.YAxis>

        <s:SciChartSurface.ChartModifier>

            <s:ModifierGroup s:MouseManager.MouseEventGroup="SharedMouseGroup">

                <s:ZoomPanModifier IsEnabled="True" ReceiveHandledEvents="True" XyDirection="XDirection" ExecuteOn ="MouseLeftButton"/>
                <s:RubberBandXyZoomModifier IsEnabled="True" ReceiveHandledEvents="True" IsXAxisOnly="True" ExecuteOn="MouseRightButton"/>

            </s:ModifierGroup>
        </s:SciChartSurface.ChartModifier>


    </s:SciChartSurface>

</Grid>
- bbmat asked 8 years ago
- last active 8 years ago
I would like to apply a custom style to all tooltips, but I can’t seem to figure out how to do so. I’ve followed the custom tooltip example, but find that applying the same style to all series becomes very verbose when we have many series on the same chart. From the example:
<s:SciChartSurface.RenderableSeries>
    <s:FastLineRenderableSeries
        Stroke="#ff6495ed"
        StrokeThickness="2"
        s:CursorModifier.TooltipTemplate="{StaticResource CursorTooltipTemplate1}"
        s:RolloverModifier.TooltipContainerStyle="{StaticResource TooltipStyle1}"
        s:RolloverModifier.TooltipTemplate="{StaticResource RolloverTooltipTemplate1}"
        s:TooltipModifier.TooltipContainerStyle="{StaticResource TooltipStyle1}"
        s:TooltipModifier.TooltipTemplate="{StaticResource TooltipTemplate1}"
        s:VerticalSliceModifier.TooltipContainerStyle="{StaticResource TooltipStyle1}"
        s:VerticalSliceModifier.TooltipTemplate="{StaticResource VerticalSliceTooltipTemplate1}" />
    <s:FastLineRenderableSeries
        Stroke="#ffe2460c"
        StrokeThickness="2"
        s:CursorModifier.TooltipTemplate="{StaticResource CursorTooltipTemplate2}"
        s:RolloverModifier.TooltipContainerStyle="{StaticResource TooltipStyle2}"
        s:RolloverModifier.TooltipTemplate="{StaticResource RolloverTooltipTemplate2}"
        s:TooltipModifier.TooltipContainerStyle="{StaticResource TooltipStyle2}"
        s:TooltipModifier.TooltipTemplate="{StaticResource TooltipTemplate2}"
        s:VerticalSliceModifier.TooltipContainerStyle="{StaticResource TooltipStyle2}"
        s:VerticalSliceModifier.TooltipTemplate="{StaticResource VerticalSliceTooltipTemplate2}" />
</s:SciChartSurface.RenderableSeries>
My target style is the same for all types of series, so I don’t need to customize them beyond overriding the default style. I’ve tried removing the “x:key” attribute from my custom tooltip style (to make it apply to all unstyled tooltips), but it doesn’t work as I had hoped. So I’m guessing that they’re being styled in some way at lower levels that prevent this from working. Is there a way to style the tooltips globally or is the method shown in this example the best approach?
- w b asked 8 years ago
- last active 8 years ago
Hello guys, what would be the best option for aligning the axes vertically in the case when there are at least two y axes?
What I mean by vertical alignment:
The value 0 should be on the same grid line for both axes
The major ticks for both axes should snap to the grid lines
Btw, SciChart is awesome!
- Straliciuc asked 12 years ago
Hi there
I got 2(or more) charts, and want to make line annotation on both
So i create 2 or more annotationCreationModifier, and want to releaseMouseCapture after the first point of line is placed at any of charts, for this im using SciChartSurface.MouseDown event
    List<AnnotationCreationModifier> AnnotationCreatorsList = new List<AnnotationCreationModifier>();

    public void LineAnotationCreaterModifier()
    {
        AnnotationCreatorsList.Clear();

        AnnotationCreater = new AnnotationCreationModifier() { AnnotationType = typeof(LineAnnotation) };
        AnnotationCreater.AnnotationCreated += new EventHandler(AnnotationCreater_LineAnnotationCreated);
        PriceChart.ChartControl.ChartModifier = AnnotationCreater;
        PriceChart.ChartControl.MouseDown += new MouseButtonEventHandler(ChartControl_MouseDown);


        AnnotationCreatorsList.Add(AnnotationCreater);

        foreach (ChartArea a in SecondaryCharts)
        {
            AnnotationCreater = new AnnotationCreationModifier() { AnnotationType = typeof(LineAnnotation) };
            AnnotationCreater.AnnotationCreated += new EventHandler(AnnotationCreater_LineAnnotationCreated);
            a.ChartControl.MouseDown += new MouseButtonEventHandler(ChartControl_MouseDown);
            a.ChartControl.ChartModifier = AnnotationCreater;
            AnnotationCreatorsList.Add(AnnotationCreater);
        }
    }


    void ChartControl_MouseDown(object sender, MouseButtonEventArgs e)
    {
        PriceChart.ChartControl.MouseDown -= new MouseButtonEventHandler(ChartControl_MouseDown);
        foreach (ChartArea a in SecondaryCharts)
        {
            a.ChartControl.MouseDown -= new MouseButtonEventHandler(ChartControl_MouseDown);
        }

        if (e.ChangedButton == MouseButton.Left)
        {
            var area = sender as SciChartSurface;

            foreach (var ancr in AnnotationCreatorsList)
            {
                if (ancr.ParentSurface == area) { }
                else { ancr.ReleaseMouseCapture(); }
            }
        }
    }
But i cant understand when mousedown event executes
It allways executes when i click on a board
And sometimes executes at the second click (after first click, when the first point is placed)
I made video, and will post it
Here is link for video:
[video] https://http://www.youtube.com/watch?v=p9z0K09xRGI [/video]- VRueda asked 11 years ago
I’m trying to MouseEventGroup:
<s:ModifierGroup s:MouseManager.MouseEventGroup="{Binding SharedMouseGroupId}">
Where SharedMouseGroupId is
    private String sharedMouseGroupId;
    public String SharedMouseGroupId
    {
        get { return this.sharedMouseGroupId; }
        set
        {
            this.sharedMouseGroupId = value;
            RaisePropertyChanged(() => SharedMouseGroupId);
        }
    }
And init:
SharedMouseGroupId = Guid.NewGuid().ToString();
But this doesn’t work.
If i subscribe on Loaded event of surface and manually set MouseEventGroup, this work.
MouseManager.SetMouseEventGroup((DependencyObject)c.ChartModifier, ViewModel.Parent.SharedMouseGroupId);
- l1pton17 asked 10 years ago
Hi I currently do need to get two things for which I currently have no clue how to get it.
I’m using FastLineRenderableSeries and XyDataSeries<double,double> in SciChart 2D.
1st: The absolute min and max values from an curve.
What I found is that I can get the YMax/YMin and XMax/XMin, but that is not what I need.
-> I need to get the “Point” (x, and y value) where the maximum/minimum is.
2nd: I Need the X-value of an Y-Value (or the list of x-values if the y-value does exist more than once).
Lets say I have the y-Value “5” and want to know at which x-value this is.
Is there a fast and elegant way to get this information from existing RenderableSeries via the SciChart API, or Do I need to get this information from my data source before appending the curves?
Thanks,
Ben
- Bernd Held asked 7 years ago
- last active 7 years ago
Hey guys,
i’m evaluating some wpf chart frameworks for our company.
Our goal is to get a heatmap with a custom image as background (e.g. a sports ground). Is there any possibility to achive this goal with scichart?
thx
Daniel
- schulz.d asked 10 years ago
- last active 2 years ago
Good day everybody!
I have got a problem. I need to place axis title above axis ticks. But I can’t find any method to do it. Could you help me?
Thank in advance.
- Egor asked 10 years ago
- last active 10 years ago
How to move chart scroll by arrow key? For example, When I pressed the Right Arrow Key, the bars in the chart will move Right one Bar position, vice versa. Thanks.
- fxchenlin asked 11 years ago
- last active 9 years ago
How to create custom annotation which has BoxAnnotation with a VerticalLine Annotation at one end.
At present I’m achieving this by creating both annotations and synchronizing them in ChartModifier.
Look at the attached image where you can see two BoxAnnotations both having a VerticalLineAnnotation at one end. I’m disabling editing for BoxAnnotation and enabling editing only for VerticalLineAnnotation.
When VerticalLineAnnotation is dragged in X-Direction, I get the X1 value from it and manually set it to BoxAnnotations X2.
This is not good implementation. I can see lag between sync events. Is it possible to create a custom annotation which incorporates both Box and Vertical line annotations ? Or is it possible to set IsEditing for BoxAnnotations One End only ?
- Matthias Kientz asked 9 years ago
- last active 9 years ago
Why there are no points and line appear when I try to plot the graph in real time?
I also have verify with an example “Creates Real-time Charts” but still no lines appear.The graph is moving but to points and line appear.
Using
SciChar v2.2.3441 and v1.7.1.2560
Win 7 Enterprise Service Pack 1
.Net 4.5 installed
Thanks,
basalode
- basalode asked 10 years ago
- last active 10 years ago
I have a chart with multiple dataseries, with each dataseries having annotations on top (like in the Trade Markers example). I have a legend which already shows or hides dataseries using a checkbox, but how can I make this checkbox also show or hide the annotations for that dataseries? Can I hook an event when this checkbox is triggered, or when the dataseries visibility changes?
- Robert Evans asked 9 years ago
- last active 9 years ago
I have a situation where I need to have a lot of independent realtime charts rendered on the screen at the same time. I have put a scichart into a user control and that user control into a list so I can reuse my configuration.
Unfortunately, the behavior I am seeing is that when I have more than 5 charts, the charts stutter really badly. I’m using the SciChartPerformanceOverlay to determine what the FPS is of each of the charts.
I can see that in my 5 chart situation, if my mouse cursor is NOT over the window or NOT moving on the window, each chart has an FPS of ~18 for SciChartSurface and an FPS of >500 for Composition Target. When I start to move the mouse around on top of the window, the SciChartSurface FPS value drops to < 5 and the Composition Target drops to ~300.
I’ve got no mouse events hooked up, I’ve set TryApplyDirectXRenderer to true and it seems to accept it. I’ve double-checked the following values:
Direct3D10CompatibilityHelper.HasDirectX10CapableGpu: True
Direct3D10CompatibilityHelper.HasDirectX10RuntimeInstalled: True
Direct3D10CompatibilityHelper.IsSupportedOperatingSystem: True
Direct3D10CompatibilityHelper.SupportsDirectX10: True
I’m suspending the chart before adding points. Each chart only has 1000 points inside a XyDataSeries<int, double> that is databound to a FastLineRenderableSeries. I’m even using Update instead of Append to try to reuse the same memory, in case that makes a difference.
I’ve played with the MaxFrameRate and nothing seems to help.
My dev machine is a bit old and the graphics card is Intel-based, but I never imagined the performance would get so bad so quickly. I’m hoping there’s something I’m missing here as I’ve read such good things about SciChart.
Please let me know if there’s any advice.
Thanks
- Brian Estey asked 8 years ago
- last active 10 months ago
Hello,
In one use case of our application it is desired to keep the sizes of lines and shapes constant even when the viewport size is changing. On resizing, just a differnt portion of the same content is shown as we are used from office writers etc.
What is the most simple way to achieve this behavior?
Thanks very much!
Thoralf
- ThoralfB asked 10 years ago
- last active 2 years ago
Hi,
I’ve got a collection on FastLineRenderableSeries which are set to Visible true/false based for some boolean properties. At the moment I’ve been using IsVisible property and apparently it’s not working very reliably. Most of the time it works without issue. But time to time chart comes to a stage which it does not respect IsVisible property and make all series are Visible. It’s quite difficult to identify reproducible steps and it occurs randomly.
<visuals:SciChartSurface.RenderableSeries>
                                <renderableSeries:FastLineRenderableSeries x:Name="vaSeries" DataSeries="{Binding Path= Series[0], Mode=OneWay}"
                                                                IsVisible="{Binding ElementName=ChkVa, Path=IsChecked, Mode=OneWay}"
                                                                SeriesColor="{StaticResource VaColor}" Style="{StaticResource SeriesStyleWithPoints}" />
                                <renderableSeries:FastLineRenderableSeries DataSeries="{Binding Series[1], Mode=OneWay}"
                                                                IsVisible="{Binding ElementName=ChkVb, Path=IsChecked, Mode=OneWay}"
                                                                SeriesColor="{StaticResource VbColor}" Style="{StaticResource SeriesStyleWithPoints}" />
                                <renderableSeries:FastLineRenderableSeries DataSeries="{Binding Series[2], Mode=OneWay}"
                                                                IsVisible="{Binding ElementName=ChkVc, Path=IsChecked, Mode=OneWay}"
                                                                SeriesColor="{StaticResource VcColor}" Style="{StaticResource SeriesStyleWithPoints}" />
                                <renderableSeries:FastLineRenderableSeries DataSeries="{Binding Series[3], Mode=OneWay}"
                                                                IsVisible="{Binding ElementName=ChkVr, Path=IsChecked, Mode=OneWay}"
                                                                SeriesColor="{StaticResource VrColor}" Style="{StaticResource SeriesStyleWithPoints}" />
                                <renderableSeries:FastLineRenderableSeries DataSeries="{Binding Series[4], Mode=OneWay}"
                                                                IsVisible="{Binding ElementName=ChkVs, Path=IsChecked, Mode=OneWay}"
                                                                SeriesColor="{StaticResource VsColor}" Style="{StaticResource SeriesStyleWithPoints}" />
                                <renderableSeries:FastLineRenderableSeries DataSeries="{Binding Series[5], Mode=OneWay}"
                                                                IsVisible="{Binding ElementName=ChkVt, Path=IsChecked, Mode=OneWay}"
                                                                SeriesColor="{StaticResource VtColor}" Style="{StaticResource SeriesStyleWithPoints}" />
                            </visuals:SciChartSurface.RenderableSeries>
- Any idea how this could happen?
- Noticed that there two properties for the purpose of making its visibility ‘IsVisible’ and ‘Visibility’. What is the most reliable property to use for setting Visibility of FastLineRenderable series?
Thanks!
Charith
- Charith Jayasundara asked 11 years ago
Hi, I have a problem with Scrollbar at custom overview surface. I’ve made bigger grips to easy catch on smartphone / tablet but now it is really annoying that under viewport I don’t see the same thing that at main surface (part of chart is cover by grip). Viewport is bound to center of grip. Is it possible to bound viewport to internal grip borders?
Pawel
- Paweł Panasiuk asked 8 years ago
Hello,
I’m developing the WPF charts application in C#. I have an activated developer license.
When I compile my code with DUBUG mode, XamlParseException occurred. (In release mode, there are no exception)
That only happened in my new SciChart project, old one never happened.
I already reference the library like SciChart.Charting and the runtime license key is included in App.xaml.cs.
- Hackjin Lee asked 7 years ago
- last active 7 years ago
Hello again. We have an application that has many tabs with scichart surface. Our goal is creating a report: screenshots of all scichart surfaces in tabs. But we found out, when scichartsurface was not active, all tick labels didn’t render on screenshots.
Here is our code snippet for creating screenshot:
double actualHeight = source.RenderSize.Height;
            double actualWidth = source.RenderSize.Width;
            double renderHeight = actualHeight * scale;
            double renderWidth = actualWidth * scale;

            RenderTargetBitmap renderTarget = new RenderTargetBitmap((int)renderWidth, (int)renderHeight, 96, 96, PixelFormats.Pbgra32);
            VisualBrush sourceBrush = new VisualBrush(source);
            DrawingVisual drawingVisual = new DrawingVisual();

            using (var drawingContext = drawingVisual.RenderOpen())
            {
                drawingContext.PushTransform(new ScaleTransform(scale, scale));
                drawingContext.DrawRectangle(sourceBrush, null, new Rect(new Point(0, 0), new Point(actualWidth, actualHeight)));
            }
            renderTarget.Render(drawingVisual);
            JpegBitmapEncoder jpgEncoder = new JpegBitmapEncoder();
            jpgEncoder.QualityLevel = quality;
            jpgEncoder.Frames.Add(BitmapFrame.Create(renderTarget));

            Byte[] _imageArray;
            using (MemoryStream outputStream = new MemoryStream())
            {
                jpgEncoder.Save(outputStream);
                _imageArray = outputStream.ToArray();
            }
            return _imageArray;
How can we fix it?
Thanks in advance
- Egor asked 8 years ago
It seems that if the axis is collapsed, all associated annotation labels are not visible (but their annotation line is visible).
Is there property or the like that will allow labels to be shown which are associated with a collapsed axis?
- Riley Huddleston asked 7 years ago
- last active 7 years ago
Is there a way to have axis X placed vertically and Y horizontally? Other words rotate chart 90 degrees to the left or right.
- sdvinin asked 12 years ago
- last active 8 years ago
