In the example code below, we attach two RenderableSeries to a single SciChartSurface.
The first RenderableSeries adds data from surface.suspendUpdates, and the second RenderableSeries adds data from setVisibleRangeChangeListener, which causes the chart to freeze.
The chart freezes even when I take actions such as using suspendUpdates in setVisibleRangeChangeListener, or adding data after performing a check such as Axis.isAttached.
However, if I run the code related to the dataSeries in the main thread, as shown in the code, the freezing goes away. Is this the correct way to perform changes to the dataSeries in the setVisibleRangeChangeListener?
import android.view.View
import com.scichart.charting.Direction2D
import com.scichart.charting.modifiers.AxisDragModifierBase
import com.scichart.charting.visuals.SciChartSurface
import com.scichart.charting.visuals.axes.AutoRange
import com.scichart.charting.visuals.axes.AxisAlignment
import com.scichart.charting.visuals.renderableSeries.FastCandlestickRenderableSeries
import com.scichart.core.model.DateValues
import com.scichart.core.model.DoubleValues
import com.scichart.data.model.DoubleRange
import com.scichart.examples.utils.scichartExtensions.OhlcDataSeries
import com.scichart.examples.utils.scichartExtensions.XyDataSeries
import com.scichart.examples.utils.scichartExtensions.categoryDateAxis
import com.scichart.examples.utils.scichartExtensions.chartModifiers
import com.scichart.examples.utils.scichartExtensions.fastColumnRenderableSeries
import com.scichart.examples.utils.scichartExtensions.numericAxis
import com.scichart.examples.utils.scichartExtensions.pinchZoomModifier
import com.scichart.examples.utils.scichartExtensions.renderableSeries
import com.scichart.examples.utils.scichartExtensions.rolloverModifier
import com.scichart.examples.utils.scichartExtensions.suspendUpdates
import com.scichart.examples.utils.scichartExtensions.xAxes
import com.scichart.examples.utils.scichartExtensions.xAxisDragModifier
import com.scichart.examples.utils.scichartExtensions.yAxes
import com.scichart.examples.utils.scichartExtensions.zoomPanModifier
import java.util.Date

fun initSampleCode(surface: SciChartSurface, ) {
surface.suspendUpdates {
    val ohlcDataSeries = OhlcDataSeries<Date, Double>()
    val ohlcRenderableSeries = FastCandlestickRenderableSeries().apply {
        dataSeries = ohlcDataSeries
    }
    val volumeDataSeries = XyDataSeries<Double, Double>("volume series")

    val sharedYRange = DoubleRange(0.0, 10.0)
    val volumeProfileXRange = DoubleRange(0.0, 10.0)

    renderableSeries {
        fastColumnRenderableSeries {
            dataSeries = volumeDataSeries
            xAxisId = "column-xAxis"
            yAxisId = "column-yAxis"

            dataPointWidth = 1.0
        }
        add(ohlcRenderableSeries)
    }

    xAxes {
        // 캔들
        categoryDateAxis {
//                axisId = "date-xAxis"
            cursorTextFormatting = "yyyy.MM"
            textFormatting = "yyyy.MM"

            setVisibleRangeChangeListener { axis, oldRange, newRange, isAnimate ->
                val columnYDoubleValues = DoubleValues()
                columnYDoubleValues.add(1.0)
                columnYDoubleValues.add(2.0)
                columnYDoubleValues.add(3.0)
                columnYDoubleValues.add(4.0)
                columnYDoubleValues.add(5.0)
                columnYDoubleValues.add(6.0)
                columnYDoubleValues.add(7.0)
                columnYDoubleValues.add(8.0)
                columnYDoubleValues.add(9.0)
                columnYDoubleValues.add(10.0)

                val columnXDoubleValues = DoubleValues()
                columnXDoubleValues.add(725_000.0)
                columnXDoubleValues.add(736_000.0)
                columnXDoubleValues.add(747_000.0)
                columnXDoubleValues.add(758_000.0)
                columnXDoubleValues.add(769_000.0)
                columnXDoubleValues.add(770_000.0)
                columnXDoubleValues.add(781_000.0)
                columnXDoubleValues.add(792_000.0)
                columnXDoubleValues.add(803_000.0)

                // !!CHART FREEZED!!
                volumeDataSeries.clear()
                volumeDataSeries.append(columnXDoubleValues, columnYDoubleValues)

                // NOT FREEZED
//                    CoroutineScope(Dispatchers.Main).launch {
//                        volumeDataSeries.clear()
//                        volumeDataSeries.append(columnXDoubleValues, columnYDoubleValues)
//                    }
            }
        }
        numericAxis {
            axisId = "column-xAxis"
            autoRange = AutoRange.Never
            axisAlignment = AxisAlignment.Right
            visibility = View.GONE

            this.flipCoordinates = true

            visibleRange = sharedYRange
        }
    }
    yAxes {
        numericAxis {
            // axisId = "price-yAxis"
            autoRange = AutoRange.Always
            growBy = DoubleRange(0.2, 0.2)
            cursorTextFormatting = "###,###"
            textFormatting = "###,###"

            visibleRange = sharedYRange
        }
        numericAxis {
            axisId = "column-yAxis"
            axisAlignment = AxisAlignment.Bottom
            // visibility = View.GONE

            visibleRange = volumeProfileXRange
        }
    }

    chartModifiers {
        xAxisDragModifier {
            receiveHandledEvents = true
            dragMode = AxisDragModifierBase.AxisDragMode.Pan
        }
        pinchZoomModifier {
            receiveHandledEvents = true
            direction = Direction2D.XDirection
        }
        zoomPanModifier {
            receiveHandledEvents = true
        }
        rolloverModifier()
    }

    val sampleDateValues = DateValues()
    sampleDateValues.add(
        arrayOf(
            Date(1388070000000),
            Date(1388156400000),
            Date(1388242800000),
            Date(1388329200000),
            Date(1388415600000),
            Date(1388502000000),
            Date(1388588400000),
            Date(1388674800000),
            Date(1388761200000),
        )
    )
    val sampleOpenValues = DoubleValues()
    sampleOpenValues.add(
        doubleArrayOf(
            737000.0,
            750000.0,
            750000.0,
            740000.0,
            768000.0,
            768000.0,
            776000.0,
            778000.0,
            831000.0,
        )
    )
    val sampleHighValues = DoubleValues()
    sampleHighValues.add(
        doubleArrayOf(
            755000.0,
            750000.0,
            750000.0,
            772000.0,
            800000.0,
            795000.0,
            788000.0,
            840000.0,
            846000.0
        )
    )
    val sampleLowValues = DoubleValues()
    sampleLowValues.add(
        doubleArrayOf(
            737000.0,
            750000.0,
            728000.0,
            740000.0,
            763000.0,
            765000.0,
            773000.0,
            774000.0,
            819000.0,
        )
    )
    val sampleCloseValues = DoubleValues()
    sampleCloseValues.add(
        doubleArrayOf(
            755000.0,
            750000.0,
            739000.0,
            768000.0,
            768000.0,
            777000.0,
            778000.0,
            834000.0,
            846000.0
        )
    )

    ohlcDataSeries.clear()
    ohlcDataSeries.append(sampleDateValues, sampleOpenValues, sampleHighValues, sampleLowValues, sampleCloseValues)
}
}
- JAIHOON PARK asked 3 months ago
- last active 3 months ago
How to move date labels to the middle of the day ?
val xAxis = DateAxis(applicationContext).apply {
        drawLabels = true
        autoFitMarginalLabels = true
        axisTitle = "X Date Axis"
        axisAlignment = AxisAlignment.Bottom
        drawMajorBands = false
        drawMinorGridLines = false
        drawMajorGridLines = true
    }
- Artem Mkrtchyan asked 4 years ago
- last active 4 years ago
Hello,
I’m trying to figure out how to apply a consistent gradient to the areas underneath my line charts. For example, if I have chart with Y values 0-10, I might want the area corresponding to 0 to be white, and 10 to be black, regardless of what values are currently panned or zoomed onto the screen. From what I have seen so far, SciChart gradients are based on the current screen values, so if I were zoomed into an area that was only 0-5, it would should a white to black gradient (not what I want), whereas I need a white to grey variant (reserving the black for 10’s). I hope that makes sense.
Thank you.
- C Bolton asked 4 years ago
- last active 4 years ago
Hi!
I’ve put a couple of charts in a recyclerview based on this example. I’m using a custome theme that’s basically just a white background and grey gridlines. When the charts get recycled (after scrolling them out of view and then back) they start to look weird. Does anyone know what is causing this behavior? I’ve tried two different versions of SciChart, screenshots attached below. Additionally I used to only get some random black squares like this in version 2.0.0.1654, but I can’t seem to reproduce that now.
Chart normally:

After recycle in version 2.0.0.1654:

After recycle in version 2.5.0.2540:

- Konrad Morzkowski asked 5 years ago
- last active 5 years ago
Hi, I would like to ask how can I draw Renko and 3 Line Break Chart using SciChart API ? thanks.
- Ray Hung asked 7 years ago
- last active 7 years ago
Hi,
How can I programmatically prevent panning, zooming, yaw, pitch movements on the screen whenever I want?
Best regards…
- MUSTAFA KELSAKA asked 3 years ago
- last active 3 years ago
Now we have 24 channels added to one graph which is visible in one page or one screen of the mobile. Can we make it two pages or add a scroll bar and devide the channels into 12 each without two different scichart components
- Aditya Kadambi asked 2 years ago
- last active 2 years ago
Hi
I have added 24 Line graphs for EEG. Now I want to display the name of each channels against each graph. I am using Y steeped graph which you are using for Vital signs display in example code. Can you please let me know how to t to display the name of each channels against each graph
Best Regards,
Aditya
- Aditya Kadambi asked 3 years ago
- last active 3 years ago
Referring to the stacked column side by side example in the android examples collection, if someone clicks on a column/series in that chart, how could i identify which the of columns has been selected (usa, china, india, etc).
- Marcus Maringer asked 3 years ago
- last active 3 years ago
Hello, we are trying to add HotizontalLineAnnotations to our candlestick chart on tap. But we’ve got the following error :
mView does not exist, so discard the remaining points. java.lang.NullPointerException: Attempt to invoke interface method ‘java.lang.Comparable com.scichart.charting.visuals.axes.IAxis.getDataValue(float)’ on a null object reference
I’ve tried to set axisIds for annotations, but it seems that it doesn’t help. Could you please help me with this issue?
 val annotationCreationModifier = AnnotationCreationModifier()
    val annotationFactory = DefaultAnnotationFactory()

    annotationCreationModifier.annotationType = 6 // Horizontal Line
    annotationCreationModifier.annotationFactory = annotationFactory
    annotationCreationModifier.setAnnotationCreationListener {
        it.setIsEditable(true)
    }

    candleChartSurface.chartModifiers.add(sciChartBuilder
            .newModifierGroup()
            .withModifier(annotationCreationModifier)
            .build()
    )
- Dok God asked 4 years ago
I set the theme is: SciChart_Bright_Spark, but in Android 4.4 mobile phone, chart often display the grid interval display black box, how to solve?
- Huang haiyan asked 7 years ago
- last active 7 years ago
Hello,
As you have already the examples of the EEG -50 channel, Is it possible to set the sensitivity factor for the channels to show the graph.
Basically, this will set the amplitude based on the frequency variation example 7micro volts/millimeter (7microvolts/mm) for each channel. Is there any way we can do it using Scichart, please let us know.
Appreciate your help
Regards,
Aditya
- Aditya Kadambi asked 3 years ago
- last active 3 years ago
Hello!
We are using SciChart in our Android application, and our Crashlytics reports that it crashes:
Fatal Exception: java.lang.OutOfMemoryError
Failed to allocate a 4581372 byte allocation with 8664 free bytes and 8KB until OOM
dalvik.system.VMRuntime.newNonMovableArray (VMRuntime.java)
android.graphics.Bitmap.createBitmap (Bitmap.java:727)
com.scichart.drawing.utility.BitmapUtil.createFrom (SourceFile:46)
com.scichart.drawing.opengl.aa. (SourceFile:113)
com.scichart.drawing.opengl.n.createTexture (SourceFile:130)
com.scichart.drawing.common.AssetManagerBase.createTexture (SourceFile:158)
com.scichart.charting.visuals.rendering.a.a (SourceFile:84)
com.scichart.charting.visuals.rendering.a.a (SourceFile:54)
com.scichart.charting.visuals.rendering.RenderSurfaceRenderer.b (SourceFile:364)
com.scichart.charting.visuals.rendering.RenderSurfaceRenderer.a (SourceFile:357)
com.scichart.charting.visuals.rendering.RenderSurfaceRenderer.a (SourceFile:134)
com.scichart.charting.visuals.rendering.RenderSurfaceRenderer.onDraw (SourceFile:123)
com.scichart.drawing.opengl.RenderSurfaceGL$a.onDraw (SourceFile:228)
com.scichart.drawing.opengl.MyGLRenderer.b (SourceFile:293)
com.scichart.drawing.opengl.MyGLRenderer.onDrawFrame (SourceFile:277)
android.opengl.GLSurfaceView$GLThread.guardedRun (GLSurfaceView.java:1548)
android.opengl.GLSurfaceView$GLThread.run (GLSurfaceView.java:1259)
Can anyone help please?
- Andrii Vovk asked 6 years ago
- last active 6 years ago
issue resolved….it happened due to late initialization of super class instance for context.
- Praween Kumar asked 5 years ago
- last active 5 years ago

I have 3 separate line series and 1 column bar series. Whenever I switch between activities, Column bar data and range persist but not for the line series.
Whenever I return back from activityB to ActivityA it never calls restoreInstanceState. How can I persist the states of these graph?
Snap short attached for reference.
—–code,
initChartUI() {
    SciChartBuilder.init(mContext)
    sciChartBuilder = SciChartBuilder.instance()

    xyIapDataSeries =
            sciChartBuilder.newXyDataSeries(Date::class.javaObjectType, Short::class.javaObjectType)
                .withSeriesName(getString(R.string.label_iap)).build()

    xyTempDataSeries =
            sciChartBuilder.newXyDataSeries(Date::class.javaObjectType, Short::class.javaObjectType)
                .withSeriesName(getString(R.string.label_temperature)).build()

    xyUoDataSeries =
            sciChartBuilder.newXyDataSeries(Date::class.javaObjectType, Short::class.javaObjectType)
                .withSeriesName(getString(R.string.label_uo)).build()

    xyRrDataSeries =
            sciChartBuilder.newXyDataSeries(Date::class.javaObjectType, Short::class.javaObjectType)
                .withSeriesName(getString(R.string.label_respiratory_rate)).build()

    initChartIap(iap_chart)
    initChartUo(uo_chart)
    initChartTemp(temperature_chart)
    initChartRR(resp_rate_chart)
}
private fun initChartIap(surface: SciChartSurface) {
val xAxis = sciChartBuilder.newCategoryDateAxis()
.withBarTimeFrame(SECONDS_IN_FIVE_MINUTES.toDouble())
.withDrawMinorGridLines(false)
.withGrowBy(0.0, 0.5)
.build()
val yAxis = sciChartBuilder.newNumericAxis().withAutoRangeMode(AutoRange.Always).build()
    val line = sciChartBuilder.newLineSeries().withStrokeStyle(R.color.accuryn_blue, STROKE_THICKNESS)
        .withDataSeries(xyIapDataSeries).build()

    // Create a Stroke Pen and assign it
    val strokePen = SolidPenStyle(resources.getColor(R.color.accuryn_blue, null), true, 2f, null)
    line.strokeStyle = strokePen

    UpdateSuspender.using(surface) {
        Collections.addAll(surface.xAxes, xAxis)
        Collections.addAll(surface.yAxes, yAxis)
        Collections.addAll<BaseRenderableSeries>(surface.renderableSeries, line)
        Collections.addAll<AxisMarkerAnnotation>(surface.annotations, iapAxisMarker)
        Collections.addAll(
            surface.chartModifiers, sciChartBuilder.newModifierGroup()
                .withXAxisDragModifier().build()
                .withZoomPanModifier().withReceiveHandledEvents(true).withXyDirection(Direction2D.XDirection).build()
                .withPinchZoomModifier().build()
                .build()
        )
    }
……
rest 3 other types….
…..
override fun onSaveInstanceState(outState: Bundle) {
    outState.run {
        putInt("count", xyIapDataSeries.count)
        putInt("uoCount", xyUoDataSeries.count)
        putInt("tempCount", xyTempDataSeries.count)
        putInt("rrCount", xyRrDataSeries.count)

        val iapRange = iap_chart.xAxes[0].visibleRange
        val uoRange = uo_chart.xAxes[0].visibleRange
        val tempRange = temperature_chart.xAxes[0].visibleRange
        val rrRange = resp_rate_chart.xAxes[0].visibleRange

        putDouble("rangeIapMin", iapRange.getMinAsDouble())
        putDouble("rangeIapMax", iapRange.getMaxAsDouble())
        putDouble("rangeUoMin", uoRange.getMinAsDouble())
        putDouble("rangeUoMax", uoRange.getMaxAsDouble())
        putDouble("rangeTempMin", tempRange.getMinAsDouble())
        putDouble("rangeTempMax", tempRange.getMaxAsDouble())
        putDouble("rangeRrMin", rrRange.getMinAsDouble())
        putDouble("rangeRrMax", rrRange.getMaxAsDouble())
    }
    super.onSaveInstanceState(outState)
}
override fun onPostCreate(savedInstanceState: Bundle?) {
super.onPostCreate(savedInstanceState)
    updateIapData(savedInstanceState)
    updateUoData(savedInstanceState)
    updateTempData(savedInstanceState)
    updateRRData(savedInstanceState)
}

override fun onRestoreInstanceState(savedInstanceState: Bundle?) {
    super.onRestoreInstanceState(savedInstanceState)
     updateIapData(savedInstanceState)
    updateUoData(savedInstanceState)
    updateTempData(savedInstanceState)
    updateRRData(savedInstanceState)
}
private fun updateIapData(savedInstanceState: Bundle?) {
UpdateSuspender.using(iap_chart) {
var count = DEFAULT_POINT_COUNT
if (savedInstanceState != null) {
count = savedInstanceState.getInt(“count”)
            val rangeMin = savedInstanceState.getDouble("rangeIapMin")
            val rangeMax = savedInstanceState.getDouble("rangeIapMax")

            iap_chart.xAxes[0].visibleRange.setMinMaxDouble(rangeMin, rangeMax)
        }

        val iap = mutableListOf<Short>()
        val date = mutableListOf<Date>()
        for (entry in mSimplifiedDataList) {
            if (entry.emr.iap > 0) {
                iap.add(entry.emr.iap)
                date.add(Date(DateTimeUtils.toEpochMilli(entry.getRtcTimeStamp())))
            } else {
                iap.add(0)
                date.add(Date(DateTimeUtils.toEpochMilli(entry.getRtcTimeStamp())))
            }
        }
        tv_iap_input_data.text = iap[iap.size.minus(1)].toString()
        xyIapDataSeries.append(date, iap)
    }
}
……rest other for updating data over UI.
- Praween Kumar asked 5 years ago
- last active 5 years ago
Hi,
I have a line chart and I want to colour the space bellow the line chart with a colour that is different form the background colour. I am not sure what API does that. Please advice.
- Vidya Sagar Mohanraj asked 6 years ago
- last active 6 years ago
HI,
I’m trying to go through the “Your First App” tutorials
I’ve completed the first one:
“Creating your First SciChart Android App – Part 1”:
https://www.scichart.com/documentation/android/current/webframe.html#Creating%20your%20First%20SciChart%20Android%20App%20-%20Part%201.html
which seems fine.
I then go to
“Creating your First SciChart Android App – Part 2”:
https://www.scichart.com/documentation/android/current/webframe.html#Creating%20your%20First%20SciChart%20Android%20App%20-%20Part%202.html
Unfortunately, I don’t see the SciChart items in the Palette when I scroll down to the Custom section.
Could you point to how I can make SciChart available please?
Screen shots attached.
Thank you,
Ed
- Ed Sykes asked 4 years ago
- last active 4 years ago
We are working on an android based ELD application. We are looking for a ELD graph. Is it possible to accomplish this using SCICHART?
- saiesh raut asked 2 years ago
- last active 4 months ago
Hello
My question is, if I buy a program license, where should I put the license ? If I statically place it in the application class, it can be easily accessed by decompiling the apk file and it can be stolen by others.
- kaftar paris asked 2 years ago
- last active 2 years ago
I used box annotation like pic
in a boxAnnotation I used
.withIsEditable(true)
.withPosition(1,-2, 0, 2)
.withBackgroundDrawableId(R.drawable.example_box_annotation_background_4)
.withResizingGrip(customIResizingGrip)
.withAnnotationDragListener(customIAnnotationSelectionDrawable)
.withResizeDirections(Direction2D.XDirection)
.withDragDirections(Direction2D.XDirection)
.build();
and i made a 2 box like pic
i use box for drag one side to make a box big or small
the first box which is left doesn’t move anywhere.
it just can only drag that i want
but the second box, the box moves when i drag after first touch
the left box never moves on but right box moves first drags
just move first time not sometimes
am i wrong something?
- Justin Lee asked 4 years ago
- last active 4 years ago
Hi,
i have some candles and i want to force the chart for removing candles with
open = Double.NaN
high = Double.NaN
low = Double.NaN
close = Double.NaN
openTime – special day (timestamp)
What I see:
- Vahid Garousi asked 1 year ago
- last active 5 months ago
Hello,
I’m creating a chart where the x-axis are dates. I want to load more (past) data when a button is clicked or when the visible range satisfies some condition. I have been able to do that using the InsertData function with index = 0 (in order to insert in the beginning of the series), but my problem now is how to keep the position I had before inserting the new data. Right now, after the insertion, the x-axis visible range’s indexes are the same instead of being moved to the right in order to show the same part of the data as before.
I have tried different ways to modify the visible range (by moving the range taking into account the new data size) but none of them have performed well.
I would like to display the same before and after inserting the previous data, so when the user scrolls he can find more data on the left but he is shown the same range of data as before.
I’m using the CategoryDateAxis as x-axis and the NumericAxis as y-axis (you can see the configuration of those axis below). The renderable series is a FastCandlestickRenderableSeries and the data series is an OhlcDataSeries<DateTime, double>.
Btw, I’m using the Xamarin wrapper for Android.
Could you help me with this issue?
Thanks!
var yAxis = new NumericAxis(this.Context)
{
        GrowBy = new DoubleRange(0, 0.1),
        AutoRange = AutoRange.Always
};

var xAxis = new CategoryDateAxis(this.Context)
{
       GrowBy = new DoubleRange(0, 0.1),
       VisibleRange = new DoubleRange(dataCount - InitialCandlesShown, dataCount + RightCandlesMargin),
       VisibleRangeLimit = new DoubleRange(-2.0, dataCount + RightCandlesMargin),
       MinimalZoomConstrain = new Java.Lang.Double(MinimumCandlesShown)
 };
- Arnau Blanch asked 6 years ago
- last active 6 years ago
I am trying to use SciChart library for my project and find out whether it satisfy all requirements.
I am currently trying to display the ECG signal. Therefore the data is coming in realtime.
I have the following configuration
 final NumericAxis xAxis = mSciChartBuilder
                .newNumericAxis()
                .withAxisTitle("Time (seconds)")
                .withDrawLabels(false)
                .withDrawMajorTicks(false)
                .withDrawMinorTicks(false)
                .withDrawMajorBands(false)
                .withDrawMajorGridLines(false)
                .withDrawMinorGridLines(false)
               // .withVisibleRange(0, 2040)
                .withAutoRangeMode(AutoRange.Always)
                //.withAutoRangeMode(AutoRange.Never)
                .build();
        final NumericAxis yAxis = mSciChartBuilder
                .newNumericAxis()
                .withAxisTitle("Voltage (mV)")
                //    .withGrowBy(0.1d, 0.1d)
                .withDrawLabels(false)
                .withDrawMajorTicks(false)
                .withDrawMinorTicks(false)
                .withDrawMajorBands(false)
                .withDrawMajorGridLines(false)
                .withDrawMinorGridLines(false)
                .withVisibleRange(Short.MIN_VALUE, Short.MAX_VALUE)
                .build();
It works but the X axis a little bit scaled/compress.
Here is the result
enter image description here
I need to make it a bit wider.
How can I do this ?
I have tried to set range manually like that
.withVisibleRange(0, 2040)
However in this case it doesn’t show anything.
I would be grateful for any help.
UPDATE
https://drive.google.com/file/d/17p1E-Z_YxiVh_JtwEvlM1PaTVyJ7eyz7/view
- Durian Odour asked 6 years ago
- last active 6 years ago
I have this strict mode configuration:
StrictMode.setThreadPolicy(new StrictMode.ThreadPolicy.Builder()
            .detectDiskReads()
            .detectDiskWrites()
            .detectNetwork()
            .penaltyLog()
            .build());

StrictMode.setVmPolicy(new StrictMode.VmPolicy.Builder()
            .detectLeakedSqlLiteObjects()
            .detectLeakedClosableObjects()
            .penaltyLog()
            .penaltyDeath()
            .build());
I have an error when I rotate screen:
 03-15 09:40:24.215 29914-29923 E/StrictMode: A resource was acquired at attached stack trace but never released. See java.io.Closeable for information on avoiding resource leaks.
   java.lang.Throwable: Explicit termination method 'release' not called
       at dalvik.system.CloseGuard.open(CloseGuard.java:223)
       at android.view.Surface.setNativeObjectLocked(Surface.java:554)
       at android.view.Surface.<init>(Surface.java:187)
       at com.scichart.drawing.opengl.ac.<init>(SourceFile:69)
       at com.scichart.drawing.opengl.n.createCanvasTexture(SourceFile:140)
       at com.scichart.charting.visuals.axes.AxisTickLabelsRendererComponent.onDraw(SourceFile:120)
       at com.scichart.charting.visuals.axes.AxisTickLabelsRendererComponent$HorizontalAxisTickLabelsRendererComponent.onDraw(SourceFile:278)
       at com.scichart.charting.visuals.axes.f.onDraw(SourceFile:182)
       at com.scichart.charting.visuals.axes.AxisBase.onDraw(SourceFile:866)
       at com.scichart.charting.visuals.rendering.RenderSurfaceRenderer.a(SourceFile:491)
       at com.scichart.charting.visuals.rendering.RenderSurfaceRenderer.g(SourceFile:485)
       at com.scichart.charting.visuals.rendering.RenderSurfaceRenderer.a(SourceFile:359)
       at com.scichart.charting.visuals.rendering.RenderSurfaceRenderer.a(SourceFile:134)
       at com.scichart.charting.visuals.rendering.RenderSurfaceRenderer.onDraw(SourceFile:123)
       at com.scichart.drawing.opengl.RenderSurfaceGL$a.onDraw(SourceFile:228)
       at com.scichart.drawing.opengl.MyGLRenderer.b(SourceFile:299)
       at com.scichart.drawing.opengl.MyGLRenderer.onDrawFrame(SourceFile:283)
       at android.opengl.GLSurfaceView$GLThread.guardedRun(GLSurfaceView.java:1571)
       at android.opengl.GLSurfaceView$GLThread.run(GLSurfaceView.java:1270)
- Evgeny Khramov asked 6 years ago
- last active 6 years ago
I need to create a multi line chart along with a seekbar at bottom and If user moves the seekbar then line chart should show a tooltip or marker view at that point.
- satyam kamboj asked 1 year ago
- last active 1 year ago
Hello,
I have added a HorizontalLineAnnotation successfully on my android app.
However, when data changes, I want to update the position (and the label) of it but I don’t see any method of class HorizontalLineAnnotation to do it.
Can someone help me?
Thank you
- Vo Hoa asked 6 years ago
- last active 2 years ago
When I run the LegendModifier example from tutorial, I just got an error
FATAL EXCEPTION: main
Process: br.cta.ipev.scicharttutorial, PID: 16941
java.lang.NoClassDefFoundError: com.scichart.charting.visuals.legend.SciChartLegend$LegendItemViewHolderAdapter*
ModifierGroup legendModifier = sciChartBuilder.newModifierGroup()
.withLegendModifier().withOrientation(Orientation.HORIZONTAL).withPosition(Gravity.TOP | Gravity.START, 16).build()
.build();
surface.getChartModifiers().add(legendModifier);
- Wagner Lima asked 5 years ago
We’d like to customize the look of our legends. We have 4 legends displaying different data, but right now the only thing we can change is the Theme. Is there any way to customize the legend items, like add some icons, change the point marker shape and size, change the check box icon etc…
P.S.: I’m not a trial user. We have an iOS, Android and WPF licenses purchased.
Project info:
Xamarin.Android
SciChart.Android 2.2.2.854
Version
2.2.2.854
- Ilija Kocev asked 5 years ago
- last active 5 years ago
Hello everyone,
We have started receiving crash reports in our Crashlytics regarding SciChart initialization. Currently, we have a lot of crashes only on Samsung Galaxy A13 (not rooted) devices with Android 12, but we can’t reproduce them ourselves.
Could you please suggest what might be happening here and how to fix it? Is it possible that upgrading our SciChart version could solve this issue?
Thanks.
Fatal Exception: java.lang.UnsatisfiedLinkError: dlopen failed: library "/data/app/~~qqqqq==/xxx.yyy.zzz/lib/armeabi-v7a/libcore.so" not found
       at java.lang.Runtime.loadLibrary0(Runtime.java:1077)
       at java.lang.Runtime.loadLibrary0(Runtime.java:998)
       at java.lang.System.loadLibrary(System.java:1656)
       at com.scichart.core.utility.NativeLibraryHelper.tryLoadLibrary(:39)
       at com.scichart.core.licensing.LibsodiumNativeWrapper.<clinit>(:29)
       at com.scichart.core.licensing.Decoder.<init>(:159)
       at com.scichart.core.licensing.Credentials.setRuntimeLicenseKey(:55)
       at com.scichart.charting.visuals.SciChartSurface.setRuntimeLicenseKey(:247)
       at com.scichart.charting.visuals.SciChartSurface.setRuntimeLicenseKeyFromResource(:275)
       at com.scichart.charting.visuals.SciChartSurface.setRuntimeLicenseKeyFromResource(:261)
       at android.app.Instrumentation.callApplicationOnCreate(Instrumentation.java:1211)
       at android.app.ActivityThread.handleBindApplication(ActivityThread.java:7588)
       at android.app.ActivityThread.access$1600(ActivityThread.java:315)
       at android.app.ActivityThread$H.handleMessage(ActivityThread.java:2286)
       at android.os.Handler.dispatchMessage(Handler.java:106)
       at android.os.Looper.loopOnce(Looper.java:226)
       at android.os.Looper.loop(Looper.java:313)
       at android.app.ActivityThread.main(ActivityThread.java:8751)
       at java.lang.reflect.Method.invoke(Method.java)
       at com.android.internal.os.RuntimeInit$MethodAndArgsCaller.run(RuntimeInit.java:571)
       at com.android.internal.os.ZygoteInit.main(ZygoteInit.java:1135)
- Igor Viter asked 4 months ago
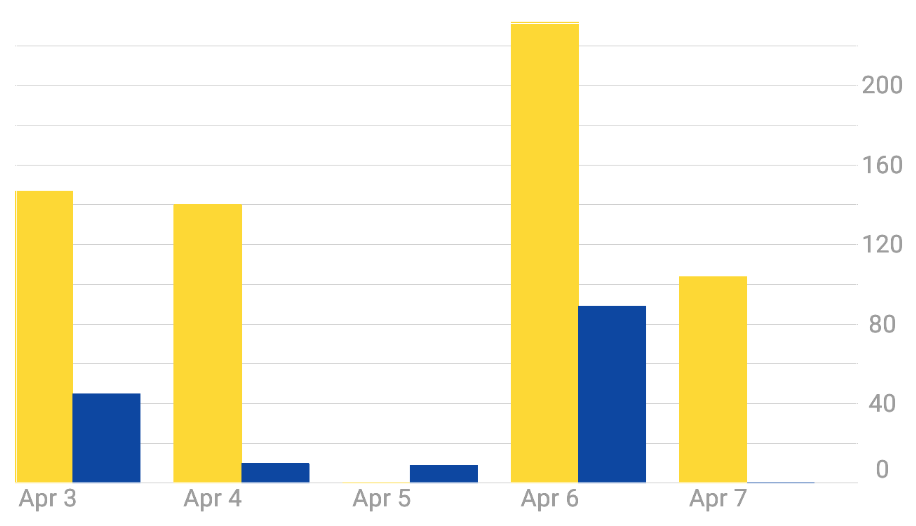
I have a basic StackedColumnRenderableSeries using a HorizontallyStackedColumnCollection, which has 2 DataSeries in it. The chart renders fine, and for each point on the x axis, I see the 2 bars. However, the labels on the x Axis are left aligned (relative to the bars). How do I get the labels to be centered under the bars? See the image below for reference. Note how the labels appear left aligned under the yellow bars… I’d like them to be center aligned, in the middle of the yellow and blue bars.
- Brad Ball asked 4 years ago
- last active 4 years ago
I am using SCICHART in my project on Xamarin.Android, but the default them show some themes but I would like to change the background grid color of the reports. Please any can help me ?.
- JORGE CASTILLO asked 7 years ago
- last active 6 years ago
Hi,
Sorry for my understanding but I am trying to achieve a solution where I want to render real time line/bar data on 10ms interval. However, is there a way to cache data max till last 72 hrs and user can drag the chart or Zoom out to check after pausing the graph.
- Praween Kumar asked 5 years ago
- last active 5 years ago
Hi, I want to color the axis label by its value,
eg. value< 0 -> show with red color
value = 0 -> show grey color
value > 0 -> show green color
similar to this question, but in android platform, it seems the LabelProvider has function related to the value(string) formatting only. Is there any ways to styling the label? Thanks!
- may lym asked 6 years ago
- last active 6 years ago
This is stackTrace:
E/Axis: VisibleRange was restored to its last valid value. The range class com.scichart.data.model.DoubleRange (Min = 27748.0, Max = 32248.0) either is not valid or it doesn’t satisfy MinimalZoomConstrain or MaximumZoomConstrain. To provide fallback value please override AxisCore#coerceVisibleRange(IRange) method
- abolfazl ghanbari asked 4 years ago
- last active 4 years ago
Hi,
I am trying to implement pan and zoom functionalities for real time charts present in Sci chart demo application
Can any one please suggest me on how to implement the same
Thanks in advance
- PANIRANGANATH KORALAHALLI asked 7 years ago
- last active 7 years ago
Hi,
I am following this https://www.scichart.com/example/android-chart-custom-series-spline-line/ to implement spline for a realtime mountain series but the thing is the render series is shown for an instant and then disappears. And also I am not able to get the areaStyle to work. Please advice.
import android.content.Context
import android.util.DisplayMetrics
import com.scichart.charting.model.dataSeries.IDataSeries
import com.scichart.charting.visuals.pointmarkers.IPointMarker
import com.scichart.charting.visuals.renderableSeries.BaseMountainRenderableSeries
import com.scichart.charting.visuals.renderableSeries.ISeriesDrawingManager
import com.scichart.charting.visuals.renderableSeries.data.ISeriesRenderPassData
import com.scichart.charting.visuals.renderableSeries.data.MountainRenderPassData
import com.scichart.charting.visuals.renderableSeries.hitTest.*
import com.scichart.core.framework.SmartPropertyBoolean
import com.scichart.core.framework.SmartPropertyInteger
import com.scichart.core.model.FloatValues
import com.scichart.core.utility.SciChartDebugLogger
import com.scichart.drawing.common.DrawingContextFactory
import com.scichart.drawing.common.IAssetManager2D
import com.scichart.drawing.common.IRenderContext2D
import com.scichart.drawing.common.LinearGradientBrushStyle
import com.scichart.extensions.builders.PenStyleBuilder.SolidPenStyleBuilder

class BezelMountainSeries(currentRenderPassData: MountainRenderPassData, hitProvider: IHitProvider, nearestPointProvider: INearestPointProvider) :
BaseMountainRenderableSeries(currentRenderPassData, hitProvider, nearestPointProvider) {

protected val isSplineEnabledProperty = SmartPropertyBoolean(SmartPropertyBoolean.IPropertyChangeListener { oldValue, newValue -> invalidateElement() }, true)

protected val upSampleFactorProperty = SmartPropertyInteger(SmartPropertyInteger.IPropertyChangeListener { oldValue, newValue -> invalidateElement() }, 10)

private val splineXCoords = FloatValues()
private val splineYCoords = FloatValues()

var isSplineEnabled: Boolean
    get() = isSplineEnabledProperty.value
    set(isSplineEnabled) = isSplineEnabledProperty.setStrongValue(isSplineEnabled)

var upSampleFactor: Int
    get() = upSampleFactorProperty.value
    set(upSampleFactor) = upSampleFactorProperty.setStrongValue(upSampleFactor)

init {

    seriesInfoProvider = LerpXySeriesInfoProvider()
}

override fun disposeCachedData() {
    super.disposeCachedData()

    splineXCoords.disposeItems()
    splineYCoords.disposeItems()
}

override fun internalDraw(renderContext: IRenderContext2D, assetManager: IAssetManager2D, renderPassData: ISeriesRenderPassData) {
    // Don't draw transparent series
    val opacity = opacity
    if (opacity == 0f) return

    val strokeStyle = strokeStyle
    if (strokeStyle == null || !strokeStyle.isVisible) return

    val currentRenderPassData = renderPassData as MountainRenderPassData

    computeSplineSeries(splineXCoords, splineYCoords, currentRenderPassData, isSplineEnabled, upSampleFactor)

    val linesStripDrawingContext = DrawingContextFactory.LINES_STRIP_DRAWING_CONTEXT

    val pen = assetManager.createPen(strokeStyle, opacity)

    val digitalLine = currentRenderPassData.isDigitalLine
    val closeGaps = currentRenderPassData.closeGaps

    val drawingManager = services.getService(ISeriesDrawingManager::class.java)
    drawingManager.beginDraw(renderContext, currentRenderPassData)

    drawingManager.iterateLines(linesStripDrawingContext, pen, splineXCoords, splineYCoords, digitalLine, closeGaps)

    drawingManager.endDraw()

    drawPointMarkers(renderContext, assetManager, currentRenderPassData.xCoords, currentRenderPassData.yCoords)
}

/**
 * Cubic Spline interpolation: http://www.codeproject.com/Articles/560163/Csharp-Cubic-Spline-Interpolation
 */
private fun computeSplineSeries(splineXCoords: FloatValues, splineYCoords: FloatValues, currentRenderPassData: MountainRenderPassData, isSplineEnabled: Boolean, upSampleFactor: Int) {
    if (!isSplineEnabled) return

    // Spline enabled
    val size = currentRenderPassData.pointsCount()
    val splineSize = size * 5

    splineXCoords.setSize(splineSize)
    splineYCoords.setSize(splineSize)

    val x = currentRenderPassData.xCoords.itemsArray
    val y = currentRenderPassData.yCoords.itemsArray

    val xs = splineXCoords.itemsArray
    val stepSize = (x[size - 1] - x[0]) / (splineSize - 1)

    // set spline xCo-ordinates
    for (i in 0 until splineSize) {
        xs[i] = x[0] + i * stepSize
    }
    var ys = FloatArray(0)

    try {
        val cubicSpline = CubicSpline()
        ys = cubicSpline.fitAndEval(x, y, size, xs, java.lang.Float.NaN, java.lang.Float.NaN, true)
    } catch (e: Exception) {
        SciChartDebugLogger.instance().handleException(e)
    }

    // copy spline yCo-ordinates
    System.arraycopy(ys, 0, splineYCoords.itemsArray, 0, splineSize)
}

class BezelMountainRenderableSeriesBuilder(context: Context) {
    private val displayMetrics: DisplayMetrics = context.resources.displayMetrics
    private val renderableSeries: BezelMountainSeries = BezelMountainSeries(MountainRenderPassData(), CompositeHitProvider(PointMarkerHitProvider(), MountainHitProvider()), NearestXyPointProvider())

    fun withDataSeries(dataSeries: IDataSeries<*, *>): BezelMountainRenderableSeriesBuilder {
        renderableSeries.dataSeries = dataSeries
        return this
    }

    fun withStrokeStyle(seriesColor: Int, strokeThickness: Float, antiAliasing: Boolean): BezelMountainRenderableSeriesBuilder {
        renderableSeries.strokeStyle = SolidPenStyleBuilder(displayMetrics).withThickness(strokeThickness).withColor(seriesColor).withAntiAliasing(antiAliasing).build()
        return this
    }

    fun withAreaStyle(x0 : Float, y0 : Float, x1 : Float , y1 : Float, startColor : Int , endColor : Int) : BezelMountainRenderableSeriesBuilder {
        renderableSeries.areaStyle = LinearGradientBrushStyle(x0, y0, x1, y1, startColor, endColor)
        return this
    }

    fun withPointMarker(pointMarker: IPointMarker): BezelMountainRenderableSeriesBuilder {
        renderableSeries.pointMarker = pointMarker
        return this
    }

    fun withUpSampleFactor(upSampleFactor: Int): BezelMountainRenderableSeriesBuilder {
        this.renderableSeries.upSampleFactor = upSampleFactor
        return this
    }

    fun withIsSplineEnabled(isSplineEnabled: Boolean): BezelMountainRenderableSeriesBuilder {
        this.renderableSeries.isSplineEnabled = isSplineEnabled
        return this
    }

    fun build(): BezelMountainSeries {
        return renderableSeries
    }
}
}
The CubicSpline and TriDiagonalMatrixF implementation are the same as the example with no alterations.
- Vidya Sagar Mohanraj asked 6 years ago
- last active 6 years ago
On VS2017, in LineChartFragment.cs, I am trying to use VerticalSliceModifier, but it is not found.
var verticalSliceModifier = new VerticalSliceModifier();
Thank for your help.
- Lubac Dominique asked 7 years ago
- last active 7 years ago
Does Scichart Android have a function to import 3D models (.obj, .cad…)?
- Hyunji Jeon asked 2 years ago
Hi,
I have issue with export SciChart to Bitamp. I have to generate pdf report from data. Report contains two charts.
It is possible to render chart in memory and export to bitmap? I know it is possible in WPF but I couldn’t achive this in Android.
Now my solution is that I render this charts on fragments and wait 1s on each to render and then save chart. But this solution is not good. For slower devices chart is not exported correctly.
For example on one device have strange grid (only exported bitmap, fragment with this chart looks good):

- Marcin K asked 6 years ago
- last active 6 years ago
Hi SciChart Team,
Thank you all for your help and support.
I finally got the multiple symbols on the stock chart with reference to this and with this clear explanation
IAnnotation annotation = builder.newCustomAnnotation().withContent(R.layout.example_custom_annotation_view).withYAxisId(PRICES).withPosition(i, prices.getHighData().get(i)).withVerticalAnchorPoint(VerticalAnchorPoint.Bottom).build();

this.annotations.add(annotation);
The above code worked for me and hope it helps to others too who all are trying this.
Thanks,
Ghousia
- Ghousia Begum asked 7 years ago
- last active 7 years ago
I’m trying to implement sciChart to flutter app (Android). It gets pretty confusing when trying to make it work. Anyone have examples how to make SciChart to work on Flutter? Adding the license works just fine. Only need for ECG chart for now. Thanks.
- Valeri Haataja asked 3 years ago
- last active 5 months ago
Or say, how can I prevent movement of HorizontalLineAnnotation when dragging the grip of X1(typically the left grip)?
- zhengyang qu asked 5 years ago
- last active 5 years ago
Hello,
I want to use SubDayTextFormatting in android so that when the visible range reaches the same day, e.g. as I zoom, it switches from dd:MMM:yyyy to HH:mm.
How can I do that?
- sci chart asked 4 years ago
Hello,
How would one implement X- or Y-Value animations for a simple line chart?
I don’t need real time value animations like in the demo but I have all the data at once and want to animate the X-values when drawing the chart. In MPAndroidChart this is done with a single line specifying the duration and the interpolator:
mChart.animateY(3000, Easing.EasingOption.EaseOutBack);
So long!
- Patrick Venturini asked 6 years ago
- last active 6 years ago
Hi,
I am trying to implement an improvement for my app where the chart is hidden if the licence key is invalid. But I can’t find how to do that. If I enter an invalid key like shown in examples, the code never ends up in the catch clause. Is there any other way? Or is this a bug?
try {
    SciChartSurface.setRuntimeLicenseKey(getString(R.string.sci_chart_runtime_licence_key));
} catch (Exception e) {
    Elog.e("SciChart Error when setting the license", e);
}
- Evado Dev asked 1 year ago
- last active 1 year ago
Dear All,
I would like to ask are there any method to draw a line (or annotation) by user touch event ?
For example user touch the chart to set the starting point of the line and then touch/drag to another point to draw the line.
Thanks.
- Ray Hung asked 7 years ago
- last active 5 years ago
On Android, the docs say that AnnotationSurfaceEnum should have the “BelowChart” enum case, but it is actually missing in the code. It is there on iOS but not on Android.
I need this particular enum case, because otherwise the annotation boxes are hiding the data series and the grid lines.
What should I do?
- Wil O asked 4 years ago
- last active 4 years ago
Hi,
I,ve added ZoomExtentsModifier(), PinchZoomModifier() to the chart modifier.I want these modifiers on Xaxis only not on YAxis.Is possible to remove these modifiers on one axis.My requirement is that, during pinchzoom yaxis value needs to be constant
- Vinu Gilbert asked 3 years ago
- last active 3 years ago
Dear Sir,
Warm Greetings!
Sir, could you give some tips how we can draw circle or ellipse in the SciChart?
Your swift reply will be deeply appreciated.
Thank you and kind regards,
Team Solmitech
- sw developer solmitech asked 7 years ago
- last active 7 years ago
Hi
I have a line chart that has already been drawn and synced with a sound.
when we play sound, chart begin to scroll horizontally.
but problem is lagging when scrolling chart.
Is there a way to fix this problem?
private Runnable mRunnable = new Runnable() {
    @Override
    public void run() {
        forceRunInPauseMode = false;

        getActivity().runOnUiThread(() -> {
            currentTime = (int) exoPlayer.getCurrentPosition();
            binding.tvCurrentDuration.setText(MiliToTimeConverter.milliToTime(currentTime));
        });

        int currentRange = currentTime * 2;


        if (!isDraw) {
            DoubleValues xValues = new DoubleValues(Arrays.copyOfRange(xDoubleArray, 0, xDoubleArray.length - 1));
            DoubleValues yValues = new DoubleValues(Arrays.copyOfRange(yDoubleArray, 0, yDoubleArray.length - 1));
            DoubleSeries doubleSeries = new DoubleSeries(xValues, yValues);
            lineData.append(doubleSeries.getxValues(), doubleSeries.getyValues());
            isDraw = true;
        }
        xVisibleRange.setMinMax(currentRange - visibleInterval / 2, currentRange + visibleInterval / 2);
    }
};

private void updateChart() {
    schedule = scheduledExecutorService.scheduleWithFixedDelay(() -> {
        if (!isPlaying && !forceRunInPauseMode)
            return;
        UpdateSuspender.using(binding.sciChart, mRunnable);
    }, 0, TIME_INTERVAL, TimeUnit.MILLISECONDS);
}


private void pause() {
    exoPlayer.setPlayWhenReady(false);
    binding.ivPlay.setImageResource(R.drawable.ic_play);
    if (schedule != null)
        schedule.cancel(false);
}

private void initSciChart() {

    isChartConfigured = true;
    SciChartBuilder.init(getContext());
    binding.sciChart.setBackgroundColor(getResources().getColor(R.color.colorTransparent));

    // Obtain the SciChartBuilder instance
    SciChartBuilder mSciChartBuilder = SciChartBuilder.instance();

    //set border style
    binding.sciChart.setRenderableSeriesAreaBorderStyle(null);

    xVisibleRange = new DoubleRange();

    // Create a numeric X axis
    final IAxis xAxis = mSciChartBuilder.newNumericAxis()
            .withVisibleRange(xVisibleRange)
            .withGrowBy(new DoubleRange(0.25d * visibleInterval / totalDuration, 0.25d * visibleInterval / totalDuration))
            .withAutoRangeMode(AutoRange.Never)
            .build();

    final IAxis yAxis = mSciChartBuilder.newNumericAxis()
            .withVisibleRange(-1d, 1d)
            .withAutoRangeMode(AutoRange.Never)
            .build();

    xAxis.setVisibleRangeChangeListener((iAxisCore, oldRange, newRange, isAnimating) -> {
        if (!isPlaying) {
            double c = ((newRange.getMinAsDouble() + newRange.getMaxAsDouble()) / 4);
            getActivity().runOnUiThread(() -> binding.tvCurrentDuration.setText(MiliToTimeConverter.milliToTime((long) c)));
        }
    });


    xAxis.setDrawMajorGridLines(false);
    xAxis.setDrawMinorGridLines(false);
    xAxis.setDrawMajorBands(false);
    xAxis.setDrawMajorTicks(true);
    xAxis.setDrawMinorTicks(true);
    xAxis.setTickProvider(new CustomTickProvider());
    xAxis.setMaxAutoTicks(MAX_AUTO_TICKS);
    xAxis.setMinorsPerMajor(MINOR_PER_MAJOR);
    xAxis.setVisibility(View.GONE);


    yAxis.setDrawMajorGridLines(false);
    yAxis.setDrawMinorGridLines(false);
    yAxis.setDrawMajorBands(false);
    yAxis.setDrawMajorTicks(false);
    yAxis.setDrawMinorTicks(false);
    yAxis.setTickProvider(new CustomTickProvider());
    yAxis.setMaxAutoTicks(MAX_AUTO_TICKS);
    yAxis.setMinorsPerMajor(MINOR_PER_MAJOR);
    yAxis.setVisibility(View.GONE);


    VerticalLineAnnotation verticalLine = mSciChartBuilder.newVerticalLineAnnotation()
            .withX1(0.5)   // black
            .withStroke(new SolidPenStyle(ColorUtil.argb(250, 120, 126, 136), true, 1f, null))
            .withCoordinateMode(AnnotationCoordinateMode.RelativeX)
            .build();

    ModifierGroup chartModifiers = mSciChartBuilder.newModifierGroup()
            .withModifier(new GestureModifierBase() {
                @Override
                public void detach() {
                    super.detach();
                }

                @Override
                public boolean onFling(MotionEvent e1, MotionEvent e2, float velocityX, float velocityY) {
                    return false;
                }

                @Override
                public boolean onScroll(MotionEvent e1, MotionEvent e2, float distanceX, float distanceY) {
                    // Scroll X
                    xAxis.scroll((-distanceX/2), ClipMode.ClipAtExtents);

                    return true;
                }
            })
            .build();

    lineData = mSciChartBuilder.newXyDataSeries(Double.class, Double.class).build();
    XyDataSeries staticData = mSciChartBuilder.newXyDataSeries(Double.class, Double.class).build();

    final FastLineRenderableSeries lineSeries = mSciChartBuilder.newLineSeries()
            .withDataSeries(lineData)
            //.withPointMarker(mSciChartBuilder.newPointMarker(new EllipsePointMarker()).withSize(7, 7).withStroke(0xFF006400, 1).withFill(0xFFFFFFFF).build())
            .withPaletteProvider(new XYCustomPaletteProvider(ColorUtil.argb(255, 50, 153, 0))) // green
            .withStrokeStyle(ColorUtil.argb(250, 120, 126, 136), 1f, true) // black
            .build();

    final IRenderableSeries staticLineSeries = mSciChartBuilder.newLineSeries()
            .withDataSeries(staticData)
            .withPaletteProvider(new XYCustomPaletteProvider(ColorUtil.argb(255, 50, 153, 0))) // green
            .withStrokeStyle(ColorUtil.argb(250, 120, 126, 136), 1f, true) // black
            .build();

    DoubleValues xValues = new DoubleValues(Arrays.copyOfRange(xDoubleArray, 0, totalRange));
    DoubleValues yValues = new DoubleValues(Arrays.copyOfRange(yDoubleArray, 0, totalRange));
    DoubleSeries doubleSeries = new DoubleSeries(xValues, yValues);

    binding.sciChart.getRenderableSeries().add(lineSeries);
    binding.sciChart.getRenderableSeries().add(staticLineSeries);

    binding.sciChart.setRenderSurface(new RenderSurface(getContext()));

    Collections.addAll(binding.sciChart.getYAxes(), yAxis);
    Collections.addAll(binding.sciChart.getXAxes(), xAxis);
    Collections.addAll(binding.sciChart.getChartModifiers(), chartModifiers);
    Collections.addAll(binding.sciChart.getAnnotations(), verticalLine);

    staticData.append(doubleSeries.getxValues(), doubleSeries.getyValues());
    lineData.setAcceptsUnsortedData(true);

    begin();
}
- abolfazl ghanbari asked 4 years ago
- last active 4 years ago
