The project is developed on SciChart JS.
The x axis is date time numeric and y axis is numeric.
There is a option for the user to select the x axis interval. The interval values are 5 Min, 10 Min, 15 Min, 30 Min, 1 Hour, 6 Hour, 12 Hour, Days, Weeks, Months & Years.
When the user the selects a interval in the select option, the x axis should be updated with the selected interval.
For Example, If the user selects the 5 Min in the select option, then the x axis interval should be 5 Min.
For 5 Min X Axis Interval
16-Jan-2023 07:00
16-Jan-2023 07:05
16-Jan-2023 07:10
16-Jan-2023 07:15
16-Jan-2023 07:20
16-Jan-2023 07:25
16-Jan-2023 07:30
For 1 Hour X Axis Interval
16-Jan-2023 07:00
16-Jan-2023 08:00
16-Jan-2023 09:00
16-Jan-2023 10:00
16-Jan-2023 11:00
16-Jan-2023 12:00
16-Jan-2023 13:00
16-Jan-2023 14:00
So let me know how to change the interval in the x axis (date time numeric) based on the selection.
I have attached the zip file which contains the HTML file.
- Leo Leslin asked 1 year ago
- last active 6 months ago
Hi,
We use SciChart extensively in our WPF applications and make use of CustomRenderableSeries, writing all kinds of different lines and bitmaps directly to the IRenderContext2D depending on the point metadata.
We’re now looking at doing something similar in JavaScript, but can’t find any examples of this kind of customisation in the documentation. In the JavaScript library, is it possible to draw directly to a ‘canvas’ in the same way as in the WPF version? If so, could you please point to an example?
Many thanks,
Graham.
- Graham Stoneman asked 1 year ago
- last active 1 year ago
Hi,
I just registered here.
I want to use your tool to create one graph. But licence is too expensive for me. May I create graph during trial mode and use it?
What if trial licence expired? Already created graph will still working or not?
Thanks
- stevo paradox asked 1 year ago
- last active 1 year ago
Hello,
I am currently developing an application using Electron (v. 8.3.0), React (v. 17.0.1), and TypeScript (v. 4.0.5). I have created a simple demo app (see attached) to test this software, and I found that whenever the application window is resized, there is an “Uncaught null” error from scichart2d.js caught by the console. I also found that at some window dimensions, it even seems that the chart cannot properly be displayed and it will try to constantly rerender, quickly filling up the console with the same error.
A couple of notes:
- I currently am using a trial key.
- I am compiling this application using electron-webpack (https://webpack.electron.build/). It has a few built-in tools that ease the compilation/app creation process when combining Electron with other frameworks. This means some of the webpack API being used is abstracted, but we can append our own (see webpack.renderer.additions.js), more information can also be found at https://webpack.electron.build/modifying-webpack-configurations.
- Electron v. 8.3.0 uses Chromium 80, so all features should be supported.
- Drew Afshari asked 4 years ago
- last active 3 years ago
A client responded that the line diagram drawn by scient.js on the mobile phone could not be seen.
We follow the user’s log and find that there is such content
2022/09/21 07:02:27.981 exception thrown: RuntimeError: function signature mismatch,RuntimeError: function signature mismatch
            at <anonymous>:wasm-function[2101]:0x5fc72
            at <anonymous>:wasm-function[1355]:0x2a029
            at <anonymous>:wasm-function[2409]:0x7ef3a
            at Ch (<anonymous>:wasm-function[4028]:0x12f27f)
            at r._main (<anonymous>:16:687711)
            at Object.Ma [as callMain] (<anonymous>:16:688823)
            at <anonymous>:16:565075

2022/09/21 07:02:27.981 Could not load SciChart WebAssembly module.
            Check your build process and ensure that your scichart2d.wasm, scichart2d.data and scichart2d.js files are from the same version
.
We try to reproduce many different devices. At present, it seems that only the device will happen. The following is the information of the device
- chinghung lai asked 2 years ago
- last active 1 year ago
I was looking over Tutorial 07 – Tooltips and Legends and the Chart Legends API demo, and noticed that the checkboxes and legend font had some styling applied. But, when I implement a legend on my own it uses the default font (or whatever global font style I used) and the default HTML checkbox styling. I was wondering if you had modified the styling using an outside CSS file, if there is an API endpoint for modifying the styling of the legend, or if this is possibly a bug. I did see that there was an applyTheme() method available, but I thought that it might not apply to this situation. I also tried to look through the example code provided for the Chart API Demo, but I couldn’t find anything that pointed one way or the other.
I have attached screenshots of what the legend looks like in the two examples, as well as a screenshot of what the legend looks like when I implement it on my own. I have also included a zip file with the demo application I created.
Thanks,
Drew
- Drew Afshari asked 3 years ago
- last active 12 months ago
After moving from version: 1.4.1575 to version: 1.4.1611 we are seeing the the Cursor modifier replicating across all the charts in our dashboard. Obviously this is not desirable. I’ve attached screenshots to show this.
Please could you advise?
- Henrique Rodrigues asked 3 years ago
I have issues with the selection box of the textannotation in firefox.
Code for the annotation:
    return new TextAnnotation({
    id,
    text: text,
    verticalAnchorPoint: EVerticalAnchorPoint.Center,
    horizontalAnchorPoint: EHorizontalAnchorPoint.Left,
    xCoordinateMode: ECoordinateMode.DataValue,
    yCoordinateMode: ECoordinateMode.DataValue,
    x1: x1,
    y1: y1,
    fontSize: 16,
    fontWeight: "Bold",
    textColor: annotation.color,
    isEditable: isEditable,
    annotationLayer: EAnnotationLayer.AboveChart
})
Please see the differences in the images attached. In the Firefox browser it seems that the svg takes on the size of the scichart surface. Can you help me to fix this problem? The parameters selectionBoxDelta and selectionBoxThickness work in both browsers but do not fix the problem.
Thank you.
- Tobias Lettner asked 1 year ago
I have XyDataSeries with 50 data points and I’m trying to insert another 50 data points to index 5. The same values can be inserted as a range to the beginning of the data series or inserted one by one starting from index 5. But they fail with “RuntimeError: memory access out of bounds” whenever I try to insert them as a range from index 5.
Code snippet:
const { xValues, yValues } = generateData(50);
const dataSeries = new XyDataSeries(wasmContext, { xValues, yValues, isSorted: false });
sciChartSurface.renderableSeries.add(new FastLineRenderableSeries(wasmContext, { dataSeries }));

// this works
dataSeries.insertRange(0, xValues, yValues);
// this works
for (let i = 0; i < xValues.length; i++) {
  dataSeries.insert(i + 5, xValues[i], yValues[i]);
}
// this fails
dataSeries.insertRange(5, xValues, yValues);
Codesandbox link: https://codesandbox.io/s/scichart-js-boilerplate-forked-hokfcn
I wonder if I’m doing something wrong or if this is an actual issue?
Side note: Index 5 is just an example, because it seems I can use the insertRange method when inserting to index 0-2, but it fails when inserting to index 3+ (in case of a chart with 50 existing data points)
- Timo Betina asked 1 year ago
- last active 1 year ago
I would like to create an arc annotation as shown in the attached image in Scichart JavaScript.
Please guide me on what will be the best way.
- Ramesh Sippy asked 2 years ago
- last active 2 years ago
We are having the first experiences with SCIchart. Could someone help with this problem we are experiencing?
[ encore ] ERROR Failed to compile with 1 errors14:42:33 [ encore ]
Module build failed: Module not found: [ encore ]
“./node_modules/scichart/_wasm/scichart2d.wasm” contains a reference
to the file “a”. This file can not be found, please check it for typos
or update it if the file got moved. [ encore ] ERROR in
./resources/js/Pages/Home.vue?vue&type=template&id=6a63e488&scoped=true&ts=true
(./node_modules/unplugin/dist/webpack/loaders/transform.js?unpluginName=unplugin-vue-components!./node_modules/vue-loader/dist/templateLoader.js??ruleSet[1].rules[3]!./node_modules/vue-loader/dist/index.js??ruleSet[0].use[0]!./resources/js/Pages/Home.vue?vue&type=template&id=6a63e488&scoped=true&ts=true)
10:27 Module parse failed: Unexpected token (10:27) File was processed
with these loaders: *
./node_modules/unplugin/dist/webpack/loaders/transform.js *
./node_modules/unplugin/dist/webpack/loaders/transform.js *
./node_modules/vue-loader/dist/templateLoader.js *
./node_modules/vue-loader/dist/index.js You may need an additional
loader to handle the result of these loaders. | }, null, -1 /* HOISTED
*/)) |export function render(_ctx: any,_cache: any,$props: any,$setup: any,$data: any,$options: any) { | return (_openBlock(),
_createElementBlock(“div”, _hoisted_1, [ | _createElementVNode(“h1”, null, _toDisplayString(_ctx.msg), 1 /* TEXT */),ERROR in ./node_modules/scichart/_wasm/scichart2d.wasm Module not
found: Error: Can’t resolve ‘a’ in
‘C:\Users\clo\fr\Projeto\chart\App\node_modules\scichart_wasm’ERROR in ./node_modules/scichart/_wasm/scichart3d.wasm Module not
found: Error: Can’t resolve ‘a’ in
‘C:\Users\clo\fr\Projeto\chart\App\node_modules\scichart_wasm’webpack compiled with 3 errors
- Marcelo Wanderley asked 1 year ago
- last active 5 months ago
Hi,
On RubberBandXyZoomModifier i am using the YDirection zoom. When i click and drag out side the area of sci chart and leave the mouse click. Then again click inside the scichart, it showing the selection area and not disappear after new selection of zoom or pan the chart. the selected area is still showing as selected.
- Arun Surendran asked 3 years ago
Hi,
I have added a data series and also a custom box annotation which is overlapping the data series.
But the question is I am trying to move the box annotation which drag and drop but have to clip on the data series as well.
May I know if is scichart js able to do so? Or best if I just convert it into svg and make it drag and drop will do?
- eva yeoh asked 1 year ago
- last active 1 year ago
Hi,
Is it possible to add the scrollbar in the chart. If the visibleRangeLimit is set is it possible to add the normal scrollbar in the side of the chart.
- Mathew George asked 4 months ago
- last active 4 months ago
Hi,
I’ve got some questions to expand on this topic: https://www.scichart.com/questions/js/how-do-you-export-or-save-a-chart-as-an-image-in-js-library
1) Can you export areas of a chart that are not visible on the screen? I have a large line chart, like a seismograph, that is never fully displayed on the screen because it is too long.
2) Can you export from a chart that is not visible on the screen?
Thank you
- max keirn asked 1 month ago
- last active 3 days ago
From what I’ve read into chrome’s roadmap, everything seems on track for a webgpu release in May.
Is scichart taking this into account and planning to add webgpu support?
I suspect this would make quite an impact on performance, so it would be a great addition.
Thanks!
- João Velasques asked 1 year ago
- last active 1 year ago
I am getting an error trying to initialize chart inside the shadow root element:
sciChartInitCommon.js:224 Chart div element with the ID "my-unique-chart-id is not present in the DOM
or
sciChartInitCommon.js:43 Uncaught (in promise) Error: Check div element with id "my-unique-chart-id" exists
Is there overrides for SciChartSurface.create method to pass target html node instead of it`s ID? Or maybe I have missed any other built-in way to use SC inside shadow DOM? Thanks for the advise.
- Sergey Chernyakov asked 2 years ago
- last active 2 years ago
Can SciChart be used in Qt? If so, is there a demo available for reference, or can you provide guidance on how to use it?
- Allen Nee asked 1 year ago
- last active 1 year ago
I have a simple need to display a horizontal heatmap based on values along the x-axis. So if value on x-axis is 1, color shown on the heatmap should be orange, if the next value is 2, red color bar appears to next the previous orange etc. Something like this (see attached graphic also):
Heatmap: [=orange=red=green]
values along x-axis: [22.05, 24.00, 30.00 ]
So the code I am trying is as follows:
export async function renderHeatMap(element)
{
    const { sciChartSurface, wasmContext } = await SciChartSurface.create(element);

    sciChartSurface.xAxes.add(new NumericAxis(wasmContext));
    sciChartSurface.yAxes.add(new NumericAxis(wasmContext));

    var heatMapData = zeroArray2D([1, 5]);
    heatMapData[0][0] = 22.05; //should appear as color1 in heatmap
    heatMapData[0][1] = 24.00; //...
    heatMapData[0][2] = 30.00; //should appear as color2 in heatmap
    heatMapData[0][3] = 26.75;
    heatMapData[0][4] = 30.00; //should appear as color3 in heatmap

    const heatmapDataSeries = new UniformHeatmapDataSeries(wasmContext, 0, 1, 0, 1, heatMapData);

    const heatmapSeries = new UniformHeatmapRenderableSeries(wasmContext, {
        dataSeries: heatmapDataSeries,
        colorMap: new HeatmapColorMap({
            minimum: 20, // min value in the zValues (data) to map to offset 0 in the colormap
            maximum: 30, // max value in the zValues (data) to map to offset 1 in the colormap
            gradientStops: [
                { offset: 0, color: "#00008B" },
                { offset: 0.3, color: "#7FFF00" },
                { offset: 0.7, color: "#FFFF00" },
                { offset: 1.0, color: "#FF0000" },
            ],
        }),
    });

    sciChartSurface.renderableSeries.add(heatmapSeries);
}
But this only displays an empty grid. I don’t see a heatmap. Anyone can point out what may be wrong? Not even the axis is showing up correctly.
- Joel Roberts asked 2 years ago
- last active 5 months ago
Hi, we are using CategoryAxis to display stock data, however, as you can see in the image below, within the “same” candle or volume, divergent information is displayed.
am I doing something wrong?
- rocket trade asked 5 months ago
- last active 5 months ago
RubberBandXyZoomModifier Zoom visibleRangeChanged not hitting when zooming. Can you check this? or any callback function when zooming the chart?
import {SciChartSurface} from "scichart/Charting/Visuals/SciChartSurface";
import {NumericAxis} from "scichart/Charting/Visuals/Axis/NumericAxis";
import {XyDataSeries} from "scichart/Charting/Model/XyDataSeries";
import {FastLineRenderableSeries} from "scichart/Charting/Visuals/RenderableSeries/FastLineRenderableSeries";
import {XyScatterRenderableSeries} from "scichart/Charting/Visuals/RenderableSeries/XyScatterRenderableSeries";
import {EllipsePointMarker} from "scichart/Charting/Visuals/PointMarkers/EllipsePointMarker";
import {NumberRange} from "scichart/Core/NumberRange";
import {RubberBandXyZoomModifier} from "scichart/Charting/ChartModifiers/RubberBandXyZoomModifier";
import {ZoomExtentsModifier} from "scichart/Charting/ChartModifiers/ZoomExtentsModifier";
import {ZoomPanModifier} from "scichart/Charting/ChartModifiers/ZoomPanModifier";
import {EZoomState} from "scichart/types/ZoomState";
import { EExecuteOn } from "scichart/types/ExecuteOn";
import { EXyDirection } from "scichart/types/XyDirection";


async function initSciChart() {
    const {sciChartSurface, wasmContext} = await SciChartSurface.create("scichart-root");
    const xAxis = new NumericAxis(wasmContext);
    const yAxis = new NumericAxis(wasmContext);
    xAxis.visibleRangeChanged.subscribe((args) => {
        console.log("X Axis changed");
    });
    yAxis.visibleRangeChanged.subscribe((args) => {
        console.log("Y Axis changed");
    });
    sciChartSurface.xAxes.add(xAxis);
    sciChartSurface.yAxes.add(yAxis);
    const scatterSeries = new XyScatterRenderableSeries(wasmContext, {
        pointMarker: new EllipsePointMarker(wasmContext, {width: 7, height: 7, fill: "White", stroke: "SteelBlue"}),
    });
    const lineSeries = new FastLineRenderableSeries(wasmContext, {stroke: "#4083B7", strokeThickness: 2});
    sciChartSurface.renderableSeries.add(lineSeries, scatterSeries);
    const scatterData = new XyDataSeries(wasmContext, {dataSeriesName: "Cos(x)"});
    const lineData = new XyDataSeries(wasmContext, {dataSeriesName: "Sin(x)"});

    for (let i = 0; i < 1000; i++) {
        lineData.append(i, Math.sin(i * 0.1));
        scatterData.append(i, Math.cos(i * 0.1));
    }
    scatterSeries.dataSeries = scatterData;
    lineSeries.dataSeries = lineData;

    sciChartSurface.chartModifiers.add(new RubberBandXyZoomModifier({
        xyDirection: EXyDirection.XDirection
    }));
    const updateDataFunc = () => {
        const i = lineData.count();
        lineData.append(i, Math.sin(i * 0.1));
        scatterData.append(i, Math.cos(i * 0.1));
        if (sciChartSurface.zoomState !== EZoomState.UserZooming) {
            xAxis.visibleRange = new NumberRange(i - 1000, i);
        }
        setTimeout(updateDataFunc, 1 / 60);
    };
    updateDataFunc();
}

initSciChart();
Please check the example with v2.0.2146. Its working with older version and now its not working.
On the example the first time it will print the console. after that when zooming the change callback is not hitting.
- Arun Surendran asked 2 years ago
- last active 2 years ago
Codesandbox link: https://codesandbox.io/p/sandbox/vertically-stacked-axes-forked-pd3h7g?file=%2Fsrc%2FApp.tsx%3A133%2C25
I put the first box annotation to be from -5 to 6 and the x-axis range is from 0 to 10, so that mean some portion of the first box annotation is out of the chart. And there is a click event on the box annotation and console log whenever it is clicked on, and when I click outside of the chart box/square and align it to the box annotation, it is registering the click.
- Nung Khual asked 4 months ago
- last active 4 months ago
Hi there,
I got a error message, please tell me what’s wrong about my code ?
Please check the image, thank
Best Regards.
Yen Wen
- YEN-WEN WANG asked 3 years ago
- last active 3 years ago
Do scichart supports microsoft blazor ?
If yes, Any examples available ?
- Abhilash R asked 3 years ago
- last active 2 years ago
Dear Andrew,
Thank you for the past answers. I have a new question. I have a heatmap with 2 line charts at its left aand top position. the top line chart plot the horizontal values where the mouse if hovering and left chart displays vertical values from the mouse position.
This is working great, but the issue is the heatmap is not always square and I am trying the aligh the line charts with the heatmap dimensions
two issues,
-
the heatmap X/Y dimension are not always same, in fact I have a function which listens to the changing heatmap zoom factor and makes sure the X/Y are always “square” as we want to show the heatmap with square pixels. (see video #2) https://youtu.be/wXStF-7bWsw
-
As I dynamically chage the size of the plot the… the proportion of actual chart area to axis lable changes thus varying the overlap. (see video #1) https://youtu.be/loAVpYSRJ38
Let me know if you need more information,
Best,
Pramod
- pramod butte asked 8 months ago
- last active 8 months ago
Hello, I just started evaluating your 2D JS chart library and am running into an error (below) and don’t know what I should do to continue forward:
Error:
wasm streaming compile failed: TypeError: Failed to execute ‘compile’
on ‘WebAssembly’: Incorrect response MIME type. Expected
‘application/wasm’.falling back to ArrayBuffer instantiation
failed to asynchronously prepare wasm: CompileError: WebAssembly.instantiate(): expected magic word 00 61 73 6d, found 3c 21 44 4f @+0
CompileError: WebAssembly.instantiate(): expected magic word 00 61 73 6d, found 3c 21 44 4f @+0
Could not load SciChart WebAssembly module.
Check your build process and ensure that your scichart2d.wasm, scichart2d.data and scichart2d.js files are from the same versionUncaught (in promise) Could not load SciChart WebAssembly module.
Check your build process and ensure that your scichart2d.wasm, scichart2d.data and scichart2d.js files are from the same version
I am copying the scichart2d.data and scichart2d.wasm in my webpack config as follows (according to your tutorials):
config.plugins.push(
    new CopyPlugin({
        patterns: [
            // {
            //     from: 'src/index.html',
            //     to: '',
            // },
            {
                from: 'node_modules/scichart/_wasm/scichart2d.data',
                to: '',
            },
            {
                from: 'node_modules/scichart/_wasm/scichart2d.wasm',
                to: '',
            },
        ],
    })
I have since then done the following but to no avail:
- Restart my webpack-dev-server -> In chrome, “Empty cache and refresh”
- Delete my node_modules folder -> yarn install -> yarn start
Can someone please help me with this issue at an earliest convenience.
- sachin patel asked 2 years ago
- last active 5 months ago
Hi everyone! We have a problem, the chart does not start on macOS and Windows 11 operating systems – a black screen is displayed.
I have a license (javascript): The javascript license must work on all Windows/Linux/macOS browsers.
also for mobile browsers.
The problem is displayed in any browser.
The parameters of the MacBook on which the chart does not start are attached below in the screenshot.
What could be the problem?

- Alexandr Zhuk asked 2 years ago
- last active 10 months ago
I am trying to add an axis annotation to a heatmap legend. When this annotation is dragged, the color mapping of the heatmap series and the heatmap legend will be changed. How can I modify the colorMap.gradientStops of the heatmap series and the heatmap legend while the chart is running?
- Quyen Sy asked 1 year ago
- last active 1 year ago
@TypeScriptError Getting an 800A0404 error when opening any javascript file. This is happening in the Windows Script Host panel. Telling me that I have bad code, that’s not bad. This has been happening since upgrading my Java Version.
- julie diane asked 2 years ago
- last active 2 years ago
There seems to be no documentation on how to configure scichart when using app router with nextJS, and I am running into an error.
I have followed a combination of this tutorial, and additional setup for nextJS found here, specifically the next.config.js file, copy-files-from-to.json, and additions to package.json. But I continue to get the error: ‘Module has already been declared’. (first/second pics in PDF)
I have attached a photos inside the pdf, including my project structure, and a zip with the files to duplicate.
Steps to replicate:
1) extract files and add root package.json to a directory of your choice
2) from within this directory, use ‘yarn create next-app scichart-prototype’ (use set-up options from 4th image in PDF)
3) Replace root layout.tsx and page.tsx with files in zip, add SciChartDemo directory and add page.tsx from that (also in zip)
4) replace the next.config.mjs file with the next.config.mjs file from the zip
5) add the copy-files-from-to.json from the zip
6) replace the package.json file in scichart-prototype directory with file from the zip.
7) run ‘yarn install’ to add packages
8) run ‘turbo dev’
9) after visiting localhost:3000/ click the Sci Chart Demo link to see error.
Thanks for taking a look.
- max keirn asked 3 months ago
- last active 2 months ago
Hello I have been having a difficult time getting the correct time displayed on my xAxis and labels.
Passing in an xValue to an OHLC data series of 60 and the setting cursorLabelFormat: ENumericFormat.Date_DDMMHHMM this should produce a label “01/01 00:01” With the year as 1970.
When the computers timezone is set to UTC + 0 this behaves as expected.
However when the computers timezone is set to anything negative (UTC – 7) the label is formatted as “31/12 00:01” with the year 1969. If scichart is trying to convert to local time I would expect a reading of “31/12 17:01” 1969.
And when the timezone is set to anything positive (UTC + 7) the label is formatted as it is UTC +0 “01/01 00:01” 1970 again I would expect the hour to corrispond to the UTC offset if scichart is trying to convert to local time.
Looking at the later case I would assume that no time conversion is taking place which is what I would prefer. But looking at the former case (UTC -X) there appears to be some manipulation happening somewhere, I just have not been able to find any documentation explaining this. Am I missing something to get this to work properly out of the box without a custom label provider?
Thank you,
Update:
I do not want to worry about timezones. I want sciChart to plot the time that I give it. Again this is acting as expected when the computer timezone is in anything greater than UTC 0. But when the computer timezone is less than UTC 0 the label and axes are showing a date 24 hours prior to what I give it.
See attached images for the error. Note the only change that is happening is changing the computer timezone from UTC – 4 to UTC + 4.
See below for code setting up the chart.
Why is changing the computer timezone affecting the data labels?
export async function example(element) {
    let { sciChartSurface, wasmContext } = chartInstances.hasOwnProperty(element.id) && chartInstances[element.id];

    // initialize sciChart and add created chart to chartInstances
    if (sciChartSurface === undefined) {
        const newContext = await SciChartSurface.create(element.id);
        sciChartSurface = newContext.sciChartSurface;
        wasmContext = newContext.wasmContext;
        chartInstances[element.id] = { sciChartSurface, wasmContext };
    }

    //create and add xAxis
    let xAxis = new CategoryAxis(wasmContext, {
        drawLabels: true,
        drawMajorTickLines: true,
        drawMinorTickLines: true,
        axisAlignment: EAxisAlignment.Bottom,
        autoRange: EAutoRange.Once,
        cursorLabelFormat: ENumericFormat.Date_DDMMHHMM,
        labelFormat: ENumericFormat.Date_DDMMYYYY,
    });

    sciChartSurface.xAxes.add(xAxis);

    //create and add yAxis
    let yAxis = new NumericAxis(wasmContext, {
        maxAutoTicks: 5,
        autoRange: EAutoRange.Always,
        growBy: new NumberRange(0.3, 0.11),
        axisAlignment: EAxisAlignment.Right,
        labelPrecision: 4
    });
    sciChartSurface.yAxes.add(yAxis);

    //add chart modifiers
    sciChartSurface.chartModifiers.add(new ZoomPanModifier({ xyDirection: EXyDirection.XDirection }));
    sciChartSurface.chartModifiers.add(new ZoomExtentsModifier({ xyDirection: EXyDirection.XDirection }));
    sciChartSurface.chartModifiers.add(new MouseWheelZoomModifier({ xyDirection: EXyDirection.XDirection }));
    sciChartSurface.chartModifiers.add(new RolloverModifier({ modifierGroup: "first", showTooltip: false }));
    sciChartSurface.chartModifiers.add(new CursorModifier(
        {
            crosshairStroke: "#9598a1",
            crosshairStrokeDashArray: [10, 5],
        }));

    //apply desired theme
    sciChartSurface.applyTheme(new SciChartJSDarkTheme());

    //create three bars
    _ohlcDataSeries = new OhlcDataSeries(wasmContext, {
        xValues: [60,120,180], //1 min, 2 min, 3 min post epoch
        openValues: [10,10,10],
        highValues: [15,15,15],
        lowValues: [5,5,5],
        closeValues: [11,11,11],
        dataSeriesName: "PriceDataSeries"
    });

    //create and style fastCandRendSeries
    const fcRendSeries = new FastCandlestickRenderableSeries(wasmContext,
        {
            dataSeries: _ohlcDataSeries,
            strokeThickness: 1,
            dataPointWidth: 0.5,
            brushUp: "#50ff50B2",
            brushDown: "#ff5050B2",
            strokeUp: "#50ff50",
            strokeDown: "#ff5050",
            animation: new WaveAnimation({ fadeEffect: true, duration: 800 })
        });
    sciChartSurface.renderableSeries.add(fcRendSeries);
}
- Leland asked 2 years ago
- last active 2 years ago
Hi!
Currently, I’m using Axis Layout – vertically stacked axes。When I use vertically stacked axes, click on a certain area, can I get on that axis? It’s from click on a certain area, not the series. I know the series can it.
can you give me some help?
- Jiawei Zhang asked 1 year ago
- last active 8 months ago
Hi There,
I’m new to SciChart, I have a question regarding DateTimeAxis that is it possible to display the date when plotting data based on hours for multiple days?
For example, I’m plotting data for Aug/07, Aug/06, and Aug/05, so I have 72 data points to display, but the problem is the user can see all the data based on hours however, they will not be able to see when the day has changed. Is there any way I can achieve this.
- Umer Nawaz asked 2 years ago
- last active 2 years ago
I used NPM to complete the deployment and development validation of SCICHART JS, and I completed the demo as follows:
At present, I have two unresolved issues that we will make a purchase decision after they are resolved:
1、How to set the sampling rate for chart?
Using the wpf control, the sampling rate can be set through the “FifoCapacity” property of XyDataSeries, but I did not find this property in the JS control.
2、How to hide the preview of the SciChartOverview control?
I don't want to display the data of the bound chart
- max tu asked 1 year ago
- last active 1 year ago
Greetings,
i have three Series in a SciChart.js (Community-Version) Surface.
The Legend i added shows me all three of them and their names and checkboxes do hide or show the series.
Here is my problem: Is there a way to hide one Series (a FastCandlestickRenderableSeries) from the Legend? I only want to show the other two Series (FastLinerenderableSeries).
Somethin like a Parameter “showInLegend: false,”? I did not find something like this in the documentation(https://www.scichart.com/documentation/js/current/typedoc/classes/legendmodifier.html).
Thank you
- Sebastian Affeld asked 9 months ago
- last active 9 months ago
If I have a use case, where heatmap data can be sparse in time, and I’m zooming around and panning trough the chart, it is quite possible to end up missing heatmap data, because at certain zoom levels, the heatmap lines just disappear.
Any tips to make this not happen?
Codepen showing the issue: https://codepen.io/jrfv/full/KKbrBdN
Make sure to zoom out slowly, and/or pan around, you should see one, or both lines disappearing.
I would post a video, but doesn’t seem to be allowed here, I’ll post 2 images at slightly different zoom levels then
- João Velasques asked 8 months ago
- last active 8 months ago
I see in the documentation that I need to set the boolean to true/false. But my question is how do I do this after the series has been rendered? I am using a custom legend and need to be able to toggle visibility.
  export default function Chart() {
  const [sciChartSurface, setSciChartSurface] = React.useState<SciChartSurface>();
  const [wasmContext, setWasmContext] = React.useState<TSciChart>();

  const dataSeriesMapRef = React.useRef<Map<keyof typeof chartData, XyDataSeries>>();

  React.useEffect(() => {
    (async () => {
      const { sciChartSurface, wasmContext } = await drawChart(theme, chartType);
      setSciChartSurface(sciChartSurface);
      setWasmContext(wasmContext);
    })();

    dataSeriesMapRef.current = new Map<keyof typeof chartData, XyDataSeries>();

    return () => sciChartSurface?.delete();
  }, [chartType]); // make sure the chart is initialized only once

  React.useEffect(() => {
    if (dataSeriesMapRef.current && sciChartSurface && wasmContext && !isLoading) {
      // const currentSeries = sciChartSurface.renderableSeries.asArray();
      // if (currentSeries) sciChartSurface.renderableSeries.clear();
      updateChartWithData(dataSeriesMapRef.current, theme, wasmContext, sciChartSurface, chartData, chartType);
    }
  }, [theme, chartData, wasmContext, sciChartSurface, isLoading]);

  return (
    <div id="chart-container">
      <ControlsLegend
        chartData={chartData}
        dataSeriesMap={dataSeriesMapRef.current as Map<keyof typeof chartData, XyDataSeries>}
        theme={theme}
        sciChartSurface={sciChartSurface as SciChartSurface}
        wasmContext={wasmContext as TSciChart}
      />
      <div id={DIVID} style={{ width: windowWidth, height: windowHeight }} />
      <ControlsBottom />
    </div>
  );
}
drawChart.js
    export default async (theme: ExtendedTheme, chartType: string) => {
  const { sciChartSurface, wasmContext } = await SciChartSurface.create(DIVID);
  const isLightTheme = theme.palette.type === 'light';

  console.log('createChart');
  const xAxis = new NumericAxis(wasmContext);
  const yAxis = new NumericAxis(wasmContext);

  xAxis.labelProvider.formatLabel = (unixTimestamp: number) => {
    return new Date(unixTimestamp * 1000).toLocaleDateString('en-us', {
      month: 'short',
      year: 'numeric',
      day: 'numeric',
    });
  };

  yAxis.labelProvider = new CustomLabelProvider();

  sciChartSurface.yAxes.add(yAxis);
  sciChartSurface.xAxes.add(xAxis);

  if (chartType !== 'stack') sciChartSurface.chartModifiers.add(new RolloverModifier({ showRolloverLine: false }));
  sciChartSurface.chartModifiers.add(new ZoomPanModifier());
  sciChartSurface.chartModifiers.add(new ZoomExtentsModifier());
  sciChartSurface.chartModifiers.add(new MouseWheelZoomModifier());
  sciChartSurface.chartModifiers.add(new PinchZoomModifier());

  const rubberBandXyZoomModifier = new RubberBandXyZoomModifier({
    isAnimated: true,
    animationDuration: 400,
    easingFunction: easing.outExpo,
    fill: '#FFFFFF33',
    stroke: '#FFFFFF77',
    strokeThickness: 1,
  });
  sciChartSurface.chartModifiers.add(rubberBandXyZoomModifier);

  sciChartSurface.zoomExtents();

  if (isLightTheme) sciChartSurface.applyTheme(new SciChartJSLightTheme());
  else sciChartSurface.applyTheme(new SciChartJSDarkTheme());
  return { sciChartSurface, wasmContext };
};
updateChartWithData.js
    export const updateChartWithData = (
  dataSeriesMap: Map<keyof typeof chartData, XyDataSeries>,
  theme: ExtendedTheme,
  wasmContext: TSciChart,
  sciChartSurface: SciChartSurface,
  chartData: ChartData,
  chartType: string
) => {
  sciChartSurface.invalidateElement();
  const streamIds = Object.keys(chartData);
  const isLightTheme = theme.palette.type === 'light';

  if (isLightTheme) sciChartSurface.applyTheme(new SciChartJSLightTheme());
  else sciChartSurface.applyTheme(new SciChartJSDarkTheme());

  sciChartSurface.invalidateElement();
  console.log('updateChartWithData');
  console.log(chartData);

  const stackedColumns: any[] = [];
  streamIds.forEach((s) => {
    const streamId = Number(s) as keyof ChartData;
    const streamSelectorId = streamId as keyof typeof chartData;
    if (dataSeriesMap.has(streamSelectorId)) {
      const xyDataSeries = dataSeriesMap.get(streamSelectorId);
      chartData[streamId].data.forEach((value) => {
        xyDataSeries?.append(value.timestamp, value.value);
      });
    } else if (chartType === 'scatter') {
      const lineSeries = LineChart(dataSeriesMap, theme, wasmContext, chartData, streamSelectorId, streamId);

      sciChartSurface.renderableSeries.add(lineSeries);
      sciChartSurface.zoomExtents();
    } else if (chartType === 'bar') {
      const lineSeries = BarChart(dataSeriesMap, theme, wasmContext, chartData, streamSelectorId, streamId);
      sciChartSurface.renderableSeries.add(lineSeries);
      sciChartSurface.zoomExtents();
    } else {
      const lineSeries = StackedChart(dataSeriesMap, theme, wasmContext, chartData, streamSelectorId, streamId);
      stackedColumns.push(lineSeries);
    }
  });
};
“LineChart.js”
    export default (
  dataSeriesMap: Map<keyof typeof chartData, XyDataSeries>,
  theme: ExtendedTheme,
  wasmContext: TSciChart,
  chartData: ChartData,
  streamSelectorId: keyof typeof chartData,
  streamId: keyof ChartData
) => {
  const xyDataSeries = new XyDataSeries(wasmContext);
  dataSeriesMap.set(streamSelectorId, xyDataSeries);

  const obj = chartData[streamSelectorId];
  const stroke = obj.stroke as string;
  xyDataSeries.dataSeriesName = obj.label as string;

  chartData[streamId].data.forEach((value) => {
    xyDataSeries.append(value.timestamp, value.value);
  });

  const lineSeries = new FastLineRenderableSeries(wasmContext, {
    stroke,
    strokeThickness: obj.strokeThickness,
    strokeDashArray: obj.strokeDashArray,
    dataSeries: xyDataSeries,
    animation: new WaveAnimation({ zeroLine: -1, pointDurationFraction: 0.5, duration: 1000 }),
  });

  lineSeries.rolloverModifierProps.tooltipColor = theme.palette.background.paper;
  lineSeries.rolloverModifierProps.tooltipTextColor = theme.palette.getContrastText(stroke);
  lineSeries.rolloverModifierProps.markerColor = stroke;
  lineSeries.rolloverModifierProps.tooltipTemplate = (
    id: string,
    tooltipProps: RolloverModifierRenderableSeriesProps,
    seriesInfo: SeriesInfo,
    updateSize: (width: number, height: number) => void
  ) => {
    const { tooltipColor, tooltipTextColor, markerColor } = tooltipProps;
    const { formattedXValue, yValue, seriesName } = seriesInfo;
    const width = 192;
    const height = 60;

    updateSize(width, height);
    return `<svg width='${width}' height='${height}' class="root">
        <rect width="100%" height="100%" fill='${tooltipColor}' stroke='${markerColor}' stroke-width='2' />
         <svg width='100%'>
           <text dy="0" fill='${tooltipTextColor}'>
            <tspan x="15" y="20" class="title">${formattedXValue}</tspan>
             <tspan x="15" y="45" class="value">
              ${seriesName} | ${yValue.toFixed(0).replace(/\B(?=(\d{3})+(?!\d))/g, ',')}
             </tspan>
          </text>
        </svg>
      </svg>`;
  };
  return lineSeries;
};
lengend.js
    let _chartData: any[] = [];
export default ({
  dataSeriesMap,
  theme,
  wasmContext,
  sciChartSurface,
  chartData,
}: {
  dataSeriesMap: Map<keyof typeof chartData, XyDataSeries>;
  theme: ExtendedTheme;
  wasmContext: TSciChart;
  sciChartSurface: SciChartSurface;
  chartData: ChartData;
}) => {
  const classes = useStyles();

  const chartRef = React.useRef<any>([]);
  const [legendData, setLegendData] = React.useState<any[]>([]);

  // _chartData = [..._chartData, ...values(chartData)];
  _chartData = values(chartData);
  _chartData = uniqby(_chartData, 'groupId');
  _chartData = uniqby(_chartData, 'streamId');

  React.useEffect(() => {
    if (_chartData.length > 0 && !isEqual(chartRef.current, _chartData)) {
      setLegendData(_chartData);
      chartRef.current = _chartData;
    }
  }, [_chartData]);

  const onClick = React.useCallback(
    (item) => {
      // const xyDataSeries = dataSeriesMap.get(160);
      const _legendData = legendData.map((x) => {
        if (x.groupId === item.groupId) x.isVisible = !x.isVisible;
        return x;
      });

      setLegendData(_legendData);
    },
    [legendData]
  );

  return (
    <div className={classes.root}>
      <Paper variant="outlined" square>
        {legendData.map((item: any) => (
          <div className={classes.listItem} key={item.streamId}>
            <IconButton
              onClick={() => onClick(item)}
              style={{ color: item.stroke }}
              size="small"
              aria-label={item.label}
            >
              {item.isVisible ? <VisibilityIcon /> : <VisibilityOffIcon />}
            </IconButton>
            <div>{item.label}</div>
          </div>
        ))}
      </Paper>
    </div>
  );
};
Inside the onClick function is where I was trying to change visibility for both series. I’ve tried multiple things without any luck. I assumed it would be as simple as getting the correct series, setting the visible property and maybe a re-render if that is even needed? Like I said any advice on a better way of handling this is welcome
- Rodolfo Sanchez asked 3 years ago
- last active 3 years ago
I am considering applying server-side licensing for my javerScript application.
In the document below, there is a phrase “Our server-side licensing component is written in C++.”
(https://support.scichart.com/index.php?/Knowledgebase/Article/View/17256/42/)
However, there is only asp.net sample code on the provided github.
(https://github.com/ABTSoftware/SciChart.JS.Examples/tree/master/Sandbox/demo-dotnet-server-licensing)
I wonder if there is a sample code implemented in C++ for server-side licensing.
Can you provide c++ sample code?
Also, are there any examples to run on Ubuntu?
- pramod butte asked 5 months ago
- last active 2 months ago
Hello guys,
Can you provide an example how to implement scichart on SSR Frameworks like Nuxt or Next.js ? I am trying to understand how i can compile a simple chart using Nuxt, getting the .data/.wasm file but i have problem after building process.
Can you help?
Many thanks
Pedro Cruz
- Ricardo Diz asked 3 years ago
- last active 3 years ago
Cant display any chart when init by SciChartSurface.create(HtmlElementId), how can I fix it ?
- test11111 123 asked 3 years ago
- last active 3 years ago
Working on an application that requires toggling between Linear and Logarithmic scales. I am using the JavaScript version of the library, and I see that there is a LogarithmicNumericAxis available in the WPF version but there is not one currently supported in the JS version.
Curious if there were any recommendations on how to go about hand rolling this type of functionality?
The application is doing realtime streaming of data points so need to be able to update existing values as well as handle incoming values.
- James Miller asked 3 years ago
- last active 3 years ago
I am considering applying server-side licensing for my javerScript application.
In the document below, there is a phrase “Our server-side licensing component is written in C++.”
(https://support.scichart.com/index.php?/Knowledgebase/Article/View/17256/42/)
However, there is only asp.net sample code on the provided github.
(https://github.com/ABTSoftware/SciChart.JS.Examples/tree/master/Sandbox/demo-dotnet-server-licensing)
I wonder if there is a sample code implemented in C++ for server-side licensing.
Can you provide c++ sample code?
Also, are there any examples to run on Ubuntu?
- sachin patel asked 1 year ago
- last active 1 year ago
Hi,
I have an issue with Rollover modifier line styling in sci chart using java script. we need the horizontal dashed line for the rollover modifier. How is it possible?
- Ayana VS asked 2 years ago
- last active 2 years ago
Hello Scichart Team again,
I’m trying to replicate anything like this (check Screenshot_2.png).
I can update the scichart background, but I just wanted to have a single color in the background, but it seems that there is an overlap of colors in X / Y as I show in the next printscreen (check Screenshot_3.png)
How I can solve this?
Waiting for feedback.
Many thanks,
Pedro Cruz
- Ricardo Diz asked 3 years ago
- last active 3 years ago
Hi Folks,
Wanted to ensure I’m working in the right direction here. Requirement is to add inline series labels on the plot surface. It’s an awkward requirement at times, but it keeps coming up with because other providers do this sometimes.
I’ve been playing with the examples of using data labels ( https://github.com/ABTSoftware/SciChart.JS.Examples/blob/master/Examples/src/components/Examples/Charts2D/TooltipsAndHittest/UsingVerticalSliceModifier/index.tsx ).
This might work. It’s a little strange since I only need to show at most one label per series. So I use the data label provider I assume and have to manually space them along the index range.
The only alternative I’m aware of is the annotations api, which of course is quite robust and probably a little too fancy for this case.
Appreciate any thoughts on the approach here — thanks!
EDIT: Attached very contrived example. The idea is to supply a label to name the series inline (apparently a legend is not sufficient), but in a way that is reasonably useful visually (similar to the spacing capabilities in the data labels api). The text would be some piece of metadata that is derived from the series (or at least has a 1:1 relationship with the series).
- Dan Santimore asked 6 months ago
- last active 6 months ago
I am working on a proof of concept for our company to move some of our desktop apps to the web. We use SciChart WPF in our desktop apps so we are going with SciChart.JS for the web apps. Is it possible to stack the FastLineRenderableSeries in SciChart.JS like we do in WPF?
Edit: Found the answer just after I posted this question.
sciChartSurface.layoutManager.leftOuterAxesLayoutStrategy = new LeftAlignedOuterVerticallyStackedAxisLayoutStrategy();
- Tim Stephansen asked 2 years ago
- last active 6 months ago
I am wondering if there may be some guidance on how to configure the styles for the SciChart.js chart instance in a React application to be able to handle dynamic changes to the height value.
The scenario is that the chart and wasm context are being saved in refs, so that the component the chart exists within does not rerender. Data is being consumed via a web socket, and streaming realtime data.
All that is well and good, but trying to implement a new feature request where the height of the chart changes dynamically, similar to an accordion style where the chart may have a full view, a split view, or no view (92vh, 46vh, 0vh)
I am finding that my css styles are not applying, or frustratingly will apply seemingly at random and other times not apply even though the underlying code remains the same. I tried to override, or at least alter, the position absolute styles of the canvas, by wrapping it in a parent element with position relative, which works to keep the height and width of the chart as desired, but the aspect ratio seems to falter and the chart axes are blurred and illegible.
I’m sure this would be a great instance of a picture says a 1000 words, and I am nearing a 1000 words. Will try to attach a codepen/ example that demonstrates the issue I am experiencing.
If there are any tips or tricks you would recommend please advise
- James Miller asked 3 years ago
- last active 3 years ago
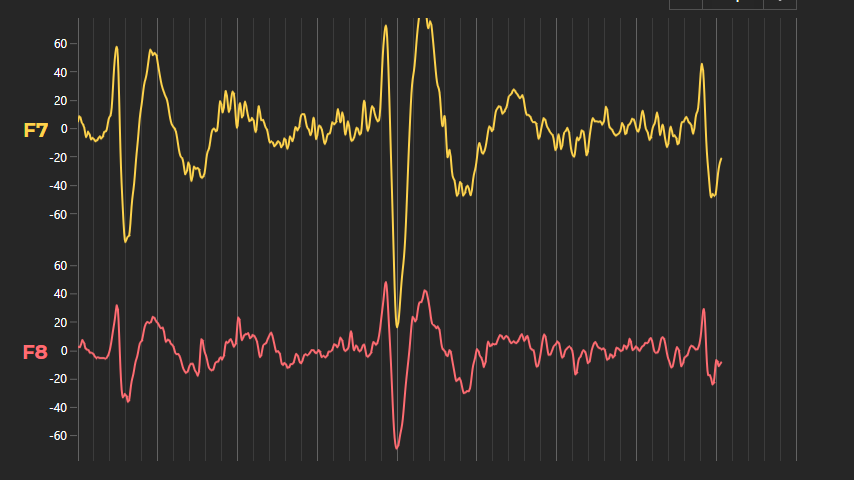
I want to be able to disable a chart if there is no data on it, and then enable the chart when there is data. The reason why I want to do that is because I have three charts that are sync and I want to disable the other charts that have no data, so that the cursor modifier or the zooming and stuff will not affect the other charts without data and will only affect the one with data.
Attached image is 3 charts that are in sync.
- Nung Khual asked 7 months ago
- last active 7 months ago
