I am considering applying server-side licensing for my javerScript application.
In the document below, there is a phrase “Our server-side licensing component is written in C++.”
(https://support-dev.scichart.com/index.php?/Knowledgebase/Article/View/17256/42/)
However, there is only asp.net sample code on the provided github.
(https://github.com/ABTSoftware/SciChart.JS.Examples/tree/master/Sandbox/demo-dotnet-server-licensing)
I wonder if there is a sample code implemented in C++ for server-side licensing.
Can you provide c++ sample code?
Also, are there any examples to run on Ubuntu?
- Gang Xu asked 2 years ago
- last active 2 years ago
Hello
My application environment is on the mobile browser, so we need to switch between [pan] and [rollover]
When I use a button to switch, everything is fine, but when I want to switch with a long press, an exception occurs
Below is my code
    initModifier() {
        this.partitionList.forEach((obj, idx)=>{
            let sciChartSurface = this.sciObj[idx].sciChartSurface;
            this.zoomPanModifier[idx] = new ZoomPanModifier();
            this.rolloverModifier[idx] = new RolloverModifier({modifierGroup: this.modifierGroupId, showTooltip: false});
            this.zoomPanModifier[idx].isEnabled = true;
            // 擴增功能
            sciChartSurface.chartModifiers.add(
                this.zoomPanModifier[idx],
                new ZoomExtentsModifier(),
                new MouseWheelZoomModifier(),
                new PinchZoomModifier(),
            );
        });
    },
    switchCross() {
        let enablePan = !this.zoomPanModifier[0].isEnabled;
        this.partitionList.forEach((obj, idx)=>{
            let sciChartSurface = this.sciObj[idx].sciChartSurface;
            this.zoomPanModifier[idx].isEnabled = enablePan;
            if (enablePan)
                sciChartSurface.chartModifiers.removeAt(4);
            else
                sciChartSurface.chartModifiers.add(this.rolloverModifier[idx]);
        });
    },
I recorded a video, first use the button to switch, and then long press to switch, you can see the problem I want to narrate from the video, the URL is as follows: https://youtu.be/vJjbLNGS-iM
After the problem occurred, it was expected that touchmove should be [pan], but it became [zoom]
Thanks for your help
- chinghung lai asked 2 years ago
- last active 2 years ago
Good day,
I am evaluating the use of scichart.js as a charting tool for our web dashboard in an offline environment. As a way of testing, I am currently trying to deploy the build of demo-create-react-app from the SDK on IIS. The build works if deployed using serve -s build but I get this error when I try to deploy the build on IIS.
I would also like to confirm if Scichart.js can work in an offline environment since I saw in this forum post that SciChart gets the .wasm and .data files from the CDN.
- Yohann Gabrielle Ticzon asked 2 years ago
- last active 2 years ago
RubberBandXyZoomModifier Zoom visibleRangeChanged not hitting when zooming. Can you check this? or any callback function when zooming the chart?
import {SciChartSurface} from "scichart/Charting/Visuals/SciChartSurface";
import {NumericAxis} from "scichart/Charting/Visuals/Axis/NumericAxis";
import {XyDataSeries} from "scichart/Charting/Model/XyDataSeries";
import {FastLineRenderableSeries} from "scichart/Charting/Visuals/RenderableSeries/FastLineRenderableSeries";
import {XyScatterRenderableSeries} from "scichart/Charting/Visuals/RenderableSeries/XyScatterRenderableSeries";
import {EllipsePointMarker} from "scichart/Charting/Visuals/PointMarkers/EllipsePointMarker";
import {NumberRange} from "scichart/Core/NumberRange";
import {RubberBandXyZoomModifier} from "scichart/Charting/ChartModifiers/RubberBandXyZoomModifier";
import {ZoomExtentsModifier} from "scichart/Charting/ChartModifiers/ZoomExtentsModifier";
import {ZoomPanModifier} from "scichart/Charting/ChartModifiers/ZoomPanModifier";
import {EZoomState} from "scichart/types/ZoomState";
import { EExecuteOn } from "scichart/types/ExecuteOn";
import { EXyDirection } from "scichart/types/XyDirection";


async function initSciChart() {
    const {sciChartSurface, wasmContext} = await SciChartSurface.create("scichart-root");
    const xAxis = new NumericAxis(wasmContext);
    const yAxis = new NumericAxis(wasmContext);
    xAxis.visibleRangeChanged.subscribe((args) => {
        console.log("X Axis changed");
    });
    yAxis.visibleRangeChanged.subscribe((args) => {
        console.log("Y Axis changed");
    });
    sciChartSurface.xAxes.add(xAxis);
    sciChartSurface.yAxes.add(yAxis);
    const scatterSeries = new XyScatterRenderableSeries(wasmContext, {
        pointMarker: new EllipsePointMarker(wasmContext, {width: 7, height: 7, fill: "White", stroke: "SteelBlue"}),
    });
    const lineSeries = new FastLineRenderableSeries(wasmContext, {stroke: "#4083B7", strokeThickness: 2});
    sciChartSurface.renderableSeries.add(lineSeries, scatterSeries);
    const scatterData = new XyDataSeries(wasmContext, {dataSeriesName: "Cos(x)"});
    const lineData = new XyDataSeries(wasmContext, {dataSeriesName: "Sin(x)"});

    for (let i = 0; i < 1000; i++) {
        lineData.append(i, Math.sin(i * 0.1));
        scatterData.append(i, Math.cos(i * 0.1));
    }
    scatterSeries.dataSeries = scatterData;
    lineSeries.dataSeries = lineData;

    sciChartSurface.chartModifiers.add(new RubberBandXyZoomModifier({
        xyDirection: EXyDirection.XDirection
    }));
    const updateDataFunc = () => {
        const i = lineData.count();
        lineData.append(i, Math.sin(i * 0.1));
        scatterData.append(i, Math.cos(i * 0.1));
        if (sciChartSurface.zoomState !== EZoomState.UserZooming) {
            xAxis.visibleRange = new NumberRange(i - 1000, i);
        }
        setTimeout(updateDataFunc, 1 / 60);
    };
    updateDataFunc();
}

initSciChart();
Please check the example with v2.0.2146. Its working with older version and now its not working.
On the example the first time it will print the console. after that when zooming the change callback is not hitting.
- Arun Surendran asked 2 years ago
- last active 2 years ago
Hi, I want to color the axis label by its value,
eg.
value < 0 -> show red color
value = 0 -> show gray color
value > 0 -> show green color
similar to this question, but in javascript platform, it seems the LabelProvider has function related to the value(string) formatting only. Is there any ways to styling the label? Thanks!
- chinghung lai asked 2 years ago
- last active 2 years ago
I’m trying to have a transparent axisLabelFill for my yAxis and a black axisLabelFill for my xAxis. How can I achieve that?
- Eliezer Veras asked 2 years ago
- last active 2 years ago
I encountered an exception inside scichart2d.js when I used hitTestProvider.hitTest.
getHitTestInfo(idx, e) {
let touch0 = e.targetTouches[0];
let rect = e.currentTarget.getBoundingClientRect();
let x = parseInt(touch0.pageX - rect.left);
let y = parseInt(touch0.pageY - rect.top);
const premultipliedX = x * DpiHelper.PIXEL_RATIO;
const premultipliedY = y * DpiHelper.PIXEL_RATIO;
let lineSeries = this.$store.state.components.scitchart.sciObj[idx].sciChartSurface.renderableSeries.items[0];
console.log(`lineSeries.hitTestProvider.hitTest(${premultipliedX}, ${premultipliedY}, ${DpiHelper.PIXEL_RATIO})`);
let result = lineSeries.hitTestProvider.hitTest(premultipliedX, premultipliedY, DpiHelper.PIXEL_RATIO);
return result;
}
The video URL is as follows
https://youtu.be/3GIlv_ldorY
- chinghung lai asked 2 years ago
- last active 2 years ago
Hello, I’d like to know how is possible to draw Axis Bands from one data point to another.
I’m currently creating real-time stock charts and I need to display the after-hours with a different band.
Thanks in advanced for your help,
- Eliezer Veras asked 2 years ago
- last active 2 years ago
I am getting an error trying to initialize chart inside the shadow root element:
sciChartInitCommon.js:224 Chart div element with the ID "my-unique-chart-id is not present in the DOM
or
sciChartInitCommon.js:43 Uncaught (in promise) Error: Check div element with id "my-unique-chart-id" exists
Is there overrides for SciChartSurface.create method to pass target html node instead of it`s ID? Or maybe I have missed any other built-in way to use SC inside shadow DOM? Thanks for the advise.
- Sergey Chernyakov asked 2 years ago
- last active 2 years ago
Hi, Custom tooltip is not working on v2.0.2179.
Its working on v2.0.2146. Can you please check the issue..
import { SciChartSurface } from "scichart/Charting/Visuals/SciChartSurface";
import { NumericAxis } from "scichart/Charting/Visuals/Axis/NumericAxis";
import { XyDataSeries } from "scichart/Charting/Model/XyDataSeries";
import { FastLineRenderableSeries } from "scichart/Charting/Visuals/RenderableSeries/FastLineRenderableSeries";
import { RangeSelectionChartModifier } from "./RangeSelectionChartModifier";
import { RubberBandXyZoomModifier } from "scichart/Charting/ChartModifiers/RubberBandXyZoomModifier";
import { MouseWheelZoomModifier } from "scichart/Charting/ChartModifiers/MouseWheelZoomModifier";
import { EXyDirection } from "scichart/types/XyDirection";
import { ZoomExtentsModifier } from "scichart/Charting/ChartModifiers/ZoomExtentsModifier";
import { EClipMode } from "scichart/Charting/Visuals/Axis/AxisBase2D";
import { MouseButtonZoomChartModifier } from "./MouseButtonZoomChartModifier";
import { SeriesInfo } from "scichart/Charting/Model/ChartData/SeriesInfo";
import { CursorTooltipSvgAnnotation } from "scichart/Charting/Visuals/Annotations/CursorTooltipSvgAnnotation";
import { CursorModifier } from "scichart/Charting/ChartModifiers/CursorModifier";


async function initSciChart() {
    const { sciChartSurface, wasmContext } = await SciChartSurface.create("scichart-root");

      const xAxis = new NumericAxis(wasmContext);
      const yAxis = new NumericAxis(wasmContext);

      sciChartSurface.xAxes.add(xAxis);
      sciChartSurface.yAxes.add(yAxis);

      const xyData = new XyDataSeries(wasmContext);
      for (let i = 0; i < 250; i++) {
        xyData.append(i, Math.sin(i * 0.1));
      }
      sciChartSurface.renderableSeries.add(
        new FastLineRenderableSeries(wasmContext, { dataSeries: xyData })
      );

      const cursorModifier = new CursorModifier({
        crosshairStrokeThickness: 1,
        showTooltip: true,
        showAxisLabels: false,
        crosshairStroke: "transparent",
      });
      cursorModifier.tooltipSvgTemplate = (seriesInfo, svgAnnotation) => {
        let rowString = "";
        seriesInfo.forEach(() => {
          rowString = rowString + `<tspan x="8" dy="1.2em" fill="red">Test : 123</tspan>`;
        });

        const string = `<svg width="300" height="33" x="0"><defs>
            <filter id="id_1610011455082" x="0" y="0" width="200%" height="200%">
            <feOffset result="offOut" in="SourceAlpha" dx="3" dy="3"></feOffset>
            <feGaussianBlur result="blurOut" in="offOut" stdDeviation="3"></feGaussianBlur>
            <feBlend in="SourceGraphic" in2="blurOut" mode="normal"></feBlend>
            </filter>
            </defs>
            <rect rx="4" ry="4" width="95%" height="90%" style="stroke-width:1;stroke:'#ffffff'}"></rect>
            <svg width="100%"><text x="8" y="3" font-size="13" font-family="Verdana" dy="0">`;

        svgAnnotation.xCoordShift = 5;
        svgAnnotation.yCoordShift = 5;
        return string + rowString + `</text></svg></svg>`;
      };
      sciChartSurface.chartModifiers.add(
        cursorModifier
      );


      const mouseWheelModifier = new MouseWheelZoomModifier();
      mouseWheelModifier.modifierMouseWheel = args => {
        const delta = args.mouseWheelDelta * 0.1;
        mouseWheelModifier.parentSurface.xAxes.asArray().forEach(x => {
          x.scroll(delta, EClipMode.None);
        });
      };
      sciChartSurface.chartModifiers.add(
        new RubberBandXyZoomModifier({ xyDirection: EXyDirection.XDirection })
      );
      sciChartSurface.chartModifiers.add(mouseWheelModifier);
      sciChartSurface.chartModifiers.add(new ZoomExtentsModifier());
  }

   initSciChart();
- Arun Surendran asked 2 years ago
- last active 2 years ago
- Open Firefox.
- Go to scicharts demos, for example https://demo.scichart.com/javascript-multi-pane-stock-charts
Rendering speed is much slower than in Google Chrome; scrolling is freezing.
Also there are several errors and warnings in console.
- Sergey Chernyakov asked 2 years ago
- last active 2 years ago
We have implemented majorTick to make the x-axis only show the more important time, but we still have some problems that cannot be solved
-
The inter-day tick has been added to the majorTick, but it still often cannot be displayed. We need to display the inter-day tick first, not the last majorTick of the previous day
-
Even though I zoomed in to the enough width, it seems that the label of the cross-day tick is still not displayed. I can’t find the reason.
The following is a schematic video:
https://youtu.be/GklhvOo4dr4
Is there a way to make the specified tick/xValue/index have a higher display priority?
Thank you very much for your help
- chinghung lai asked 2 years ago
I’m new to Javascript and it took me a while to realize the SciChart JS is front-end library that runs on browser. I thought it could be deployed to the back-end with node.js until running into errors.
Is SciChart JS only support front-end? With the tutorial provided, the bundle.js is visible to the users, including the license key. Is it how it designed? Or I missed something fundamental? Is it possible to make it back-end? Thanks.
- Gang Xu asked 2 years ago
- last active 2 years ago
I have two charts in my app. Is there a way that I can make a rollover tooltip on a heatmap chart and the x visible range updates accordingly on another chart when the cursor moving around on the heatmap?
I had this function in Android version with the method InternalUpdate from CustomHeatmapTooltip which extended from UniformHeatmapTooltip. I wonder if there’s a listener for the tooltip.
Thanks.
- Gang Xu asked 2 years ago
- last active 1 year ago
import { MouseWheelZoomModifier } from "scichart/Charting/ChartModifiers/MouseWheelZoomModifier";
import { ZoomExtentsModifier } from "scichart/Charting/ChartModifiers/ZoomExtentsModifier";
import { ZoomPanModifier } from "scichart/Charting/ChartModifiers/ZoomPanModifier";
import { XyDataSeries } from "scichart/Charting/Model/XyDataSeries";
import { NumericAxis } from "scichart/Charting/Visuals/Axis/NumericAxis";
import { FastLineRenderableSeries } from "scichart/Charting/Visuals/RenderableSeries/FastLineRenderableSeries";
import { SciChartSurface } from "scichart/Charting/Visuals/SciChartSurface";
import { NumberRange } from "scichart/Core/NumberRange";
import { Point } from "scichart/Core/Point";
import { EAnimationType } from "scichart/types/AnimationType";
import { ShadowEffect } from "scichart/Charting/Visuals/RenderableSeries/ShadowEffect";
import { SciChartJSLightTheme } from "scichart/Charting/Themes/SciChartJSLightTheme";
import { SciChartJSDarkTheme } from "scichart/Charting/Themes/SciChartJSDarkTheme";
import { EAutoRange } from "scichart/types/AutoRange";

async function initSciChart() {
  const { sciChartSurface, wasmContext } = await SciChartSurface.create(
    "scichart-root"
  );
  // Create an X,Y Axis and add to the chart
  const xAxis = new NumericAxis(wasmContext);
  const yAxis = new NumericAxis(wasmContext, {visibleRange: new NumberRange(0, 11)});
  //const yAxis = new NumericAxis(wasmContext, {visibleRange: new NumberRange(0, 10)});
  // , {autoRange: EAutoRange.Once}

  sciChartSurface.xAxes.add(xAxis);
  sciChartSurface.yAxes.add(yAxis);

  // Create some data and set on a line series
  const xyData = new XyDataSeries(wasmContext);
  for (let i = 0; i < 250; i++) {
    xyData.append(i, 0);
    // xyData.append(i, Math.sin(i * 0.1));
  }
  sciChartSurface.renderableSeries.add(
    new FastLineRenderableSeries(wasmContext, { dataSeries: xyData })
  );
}

initSciChart();
Visible Range is not working correctly. I found two cases getting the issue.
Case 1: visibleRange: new NumberRange(0, 10) -> if the values are 0 and 10 then the chart showing auto mode.
Case 2: xyData.append(i, 0) -> if all the values are 0 then its showing line on middle even the value is 0 to any number.
Please check the cases has some issues…
- Arun Surendran asked 2 years ago
- last active 2 years ago
- SciChartSurface created with category x and numeric y axes
- ZoomPanModifier, ZoomExtentsModifier, MouseWheelZoomModifier, RolloverModifier added.
- Any series and dataSeries are initialized and added to the surface, but not filled with values yet.
- Value streaming started with delay.
The first error occurs when trying to zoom on empty surface :
Uncaught TypeError: Cannot read properties of undefined (reading 'width')
at MouseWheelZoomModifier2.ChartModifierBase2D2.growBy (ChartModifierBase2D.js:121:48)
And the other one when trying to drag:
Uncaught Error: category x axis with id=DefaultAxisId should have data series count > 0
at CategoryAxis2.CategoryAxisBase2.getCurrentCoordinateCalculatorInternal (CategoryAxisBase.js:95:19)
I have seen errors similar to the second one in other scenarios and sometimes it is fatal.
E.g i have tried to add annotation right after first value was added and first line raised similar error:
    const xCalc = this.surface.xAxes.get(0).getCurrentCoordinateCalculator() as CategoryCoordinateCalculator;
    const realX = xCalc.transformDataToIndex(time);
    const target = this.getOrAddAnnotation();
    target.x1 = realX;
    target.y1 = value;
Also getCurrentCoordinateCalculatorInternal error occurs when empty series & seriesData added without suspend.
I would appreciate any help and clarification
- Sergey Chernyakov asked 2 years ago
- last active 2 years ago
I need to implement custom html legend instead of built-in options.
To hide built-in rollover I’m using series config:
    this.series.rolloverModifierProps.width = 0;
    this.series.rolloverModifierProps.height = 0;
    this.series.rolloverModifierProps.markerColor = "rgba(255, 255, 255, 0)";
I can’t set
rolloverModifierProps.showRollover = false;
because in that case rolloverModifierProps.tooltipDataTemplate handler is not firing.
My handler looks like
rolloverModifierProps.tooltipDataTemplate = (seriesInfo: SeriesInfo): string[] => {
            const ohlcInfo = seriesInfo as OhlcSeriesInfo;
            myOwnHandlerToPassDataToHtml({ high: ohlcInfo.highValue, low: ohlcInfo.lowValue, open: ohlcInfo.openValue, close: ohlcInfo.closeValue });
            return [];
        };
I’am wondering if there is any other way to hide rollover marker but keep tooltipDataTemplate handler firing?
- Sergey Chernyakov asked 2 years ago
- last active 2 years ago
Looking to try and “link” two timeseries charts when either one is zoomed. The link aspect would be updating the other chart to have the same visible range as the zoomed chart.
Each chart has its visibleRange property updated in response to separate socket events, that happen at similar intervals but different.
Originally, was hoping to have something similar to the onZoomExtents method that fires a callback that would allow me to grab the latest min/max of the visibleRangeProperty of the xAxes to then update the other chart.
Any suggestions on how I could go about doing this?
And if it is not clear what I am talking about I can provide some code snippets.
- James Miller asked 2 years ago
- last active 4 months ago
I create custom annotation with nested input. In the code, I specify the autofocus property.
But autofocus only works once after page reload. With any manipulations with the chart (zoom, scrolling) – autofocus stops working.
Can you help me ?
- Taras Shevchenko asked 2 years ago
Looks like LicenceManager parent div preventing whole chart to shrink dynamically because of relative positioning. Please let me know if this is not the best place for bug reports: I was looking for special form but haven’t found any.
- Sergey Chernyakov asked 2 years ago
We found that when the entered data is wrong and SciChart exception occurs, we can’t get back to normal without F5 reloading.
In our application, when switching the symbol/screen, it will start over from SciChartSurface.create(), but it just cannot return to normal.
If the abnormal data causes scichart exception, what can we do to minimize the damage ?
Here is demo video :
https://youtu.be/N066BHB83Ik
- chinghung lai asked 2 years ago
- last active 2 years ago
Is there any way to provide custom axis label for cursor modifier or at least change label size? I could find only axis label stroke & fill properties in cursor modifier API.
- Sergey Chernyakov asked 2 years ago
- last active 2 years ago
Is there any way to provide annotation tooltip onmouseover? Perhaps I can subscribe on surface mouse events and manage visibility and positions on “tooltip” annotations by myself? If so, could you please provide reference to surface mouse events API.
- Sergey Chernyakov asked 2 years ago
- last active 4 months ago
Hi,
When we published the product of Test Domain, a black rectangle will appear in the SciChart line graph. How should we avoid it?
The tester told me he was reluctant to update to Production Domain in this situation.
Thank for your help
- chinghung lai asked 2 years ago
Hi everyone! We have a problem, the chart does not start on macOS and Windows 11 operating systems – a black screen is displayed.
I have a license (javascript): The javascript license must work on all Windows/Linux/macOS browsers.
also for mobile browsers.
The problem is displayed in any browser.
The parameters of the MacBook on which the chart does not start are attached below in the screenshot.
What could be the problem?

- Alexandr Zhuk asked 2 years ago
- last active 9 months ago
I am working on a proof of concept for our company to move some of our desktop apps to the web. We use SciChart WPF in our desktop apps so we are going with SciChart.JS for the web apps. Is it possible to stack the FastLineRenderableSeries in SciChart.JS like we do in WPF?
Edit: Found the answer just after I posted this question.
sciChartSurface.layoutManager.leftOuterAxesLayoutStrategy = new LeftAlignedOuterVerticallyStackedAxisLayoutStrategy();
- Tim Stephansen asked 2 years ago
- last active 6 months ago
Hi,
In my application I am using two charts for represent different values. I am using LegendModifier on the first chart. Is it possible when i uncheck the series on first chart and the same color series on second chart also need to hide from the second chart. Any event callback function available in LegendModifier ?
- Arun Surendran asked 2 years ago
- last active 2 years ago
Hello, I just started evaluating your 2D JS chart library and am running into an error (below) and don’t know what I should do to continue forward:
Error:
wasm streaming compile failed: TypeError: Failed to execute ‘compile’
on ‘WebAssembly’: Incorrect response MIME type. Expected
‘application/wasm’.falling back to ArrayBuffer instantiation
failed to asynchronously prepare wasm: CompileError: WebAssembly.instantiate(): expected magic word 00 61 73 6d, found 3c 21 44 4f @+0
CompileError: WebAssembly.instantiate(): expected magic word 00 61 73 6d, found 3c 21 44 4f @+0
Could not load SciChart WebAssembly module.
Check your build process and ensure that your scichart2d.wasm, scichart2d.data and scichart2d.js files are from the same versionUncaught (in promise) Could not load SciChart WebAssembly module.
Check your build process and ensure that your scichart2d.wasm, scichart2d.data and scichart2d.js files are from the same version
I am copying the scichart2d.data and scichart2d.wasm in my webpack config as follows (according to your tutorials):
config.plugins.push(
    new CopyPlugin({
        patterns: [
            // {
            //     from: 'src/index.html',
            //     to: '',
            // },
            {
                from: 'node_modules/scichart/_wasm/scichart2d.data',
                to: '',
            },
            {
                from: 'node_modules/scichart/_wasm/scichart2d.wasm',
                to: '',
            },
        ],
    })
I have since then done the following but to no avail:
- Restart my webpack-dev-server -> In chrome, “Empty cache and refresh”
- Delete my node_modules folder -> yarn install -> yarn start
Can someone please help me with this issue at an earliest convenience.
- sachin patel asked 2 years ago
- last active 5 months ago
Hi,
We found that the part of our project that uses scichart does not work correctly on iOS12, and then we tried to open a browser on iOS12 to the scichart javascript demo webpage, and found that it did not work.
What is the minimum iOS version supported by javscript scichart?
- chinghung lai asked 2 years ago
- last active 4 months ago
- Big Sur 11.6.
- Monterey 12.2.1
- Catalina 10.15.7 (late 2013 model)
![enter image description here][1]
sciChart version 1.4.1611
If you open the chart in the Firefox browser, then, strangely enough, everything works.
Is it related to the version of the library?
- Alexandr Zhuk asked 2 years ago
- last active 2 years ago
Hi,
As title, is any way to reach this requirement?
when drag the annotation but not appear the selected style. like circle point and around broder.
- chinghung lai asked 2 years ago
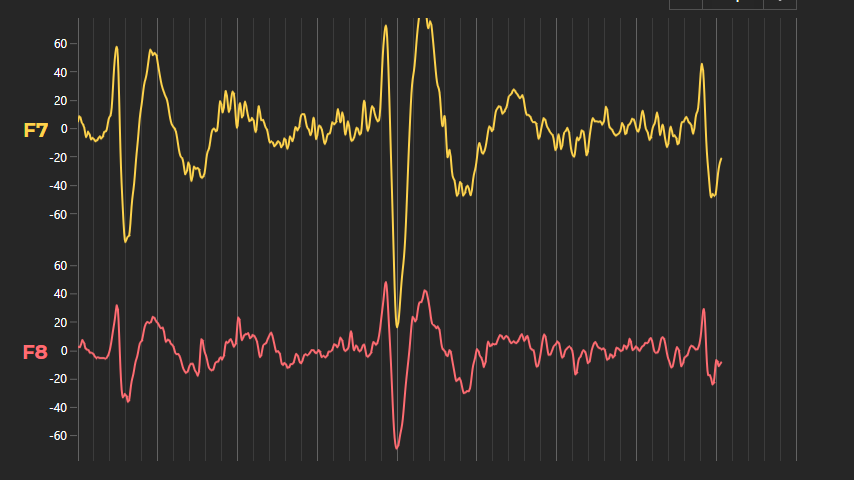
How can I rotate the axis titles in SciChat JS?
We want the the titles Fp1 and Fp2 to be rotated so they are horizontal on the screen instead of vertical.
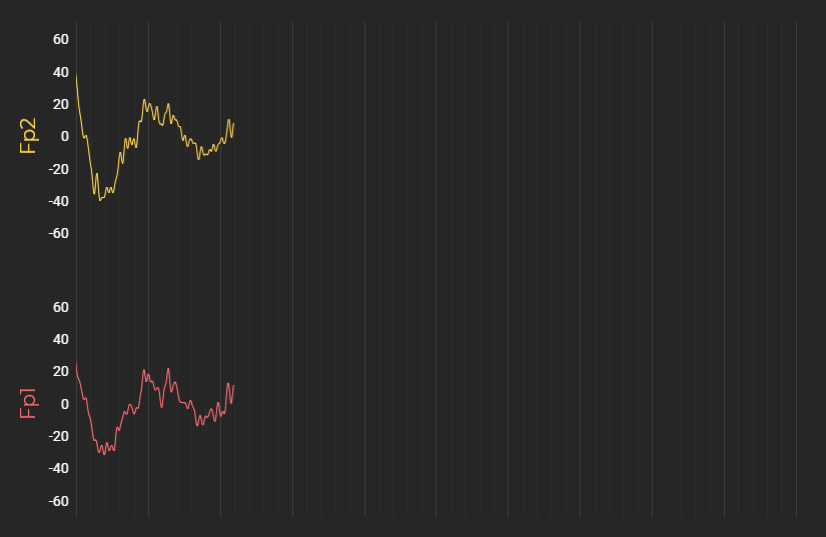
- Tim Stephansen asked 2 years ago
- last active 2 years ago
Error from chart in div chart1 Error: getNativeXValues is invalid for heatmap type series. Try getting or setting zValues instead
at UniformHeatmapDataSeries.BaseHeatmapDataSeries.getNativeXValues (BaseHeatmapDataSeries.js:430:1)
Help! Please!
- Alexandr Zhuk asked 2 years ago
- last active 2 years ago
Hi
I am trying out JS SciChart based on the Blazor example you have posted more than a year ago.
I cannot get the auto scaling to work by code (the default behavior does auto scale once right after adding the data). Calling sciChartSurface.zoomExtents(); (or zoomExtentsX() and zoomExtentsY() after one another) does zoom into a very details portion of the graph.
Also (maybe related) the tooltip does not update when moving the cursor around, it always keeps the same data. I tried using CursorModifier as well as RolloverModifier, both having the same problem.
Attached the JS code and the c# files and a picture how this looks like after calling the autoScale() method.
Thanks for any help
Regards
Reto
- Reto Stahel asked 2 years ago
- last active 2 years ago
Hi,
I’m building a heatmap with UniformHeatmapRenderableSeries I would like to know if it is possible to get some text inside each block.
I would like to display the block size when I zoom in like this https://www.scichart.com/example/android-heatmap-chart-with-text-example/.
Do you have any suggestions?
Best Regards,
Gabriel
- Gabriel Chainel asked 2 years ago
- last active 2 years ago
I have a large data set that I can’t really load into memory at once so instead I am paging the data, grabbing only what I require plus a little buffer either side so that the graph always has something in it.
To implement paging I need to change the position at which the graph starts rendering, unfortunately it seems that it is not possible to change UniformHeatmapDataSeries.xStart as set in the constructor.
Is the only way around this to recreate the heatmap from scratch every time a new page is loaded or am I missing another trick?
- Paul Hodgson asked 2 years ago
- last active 2 years ago
Hi guys, I got problem that cursor modifier is not display full lines on x and y axis, ( also it breaks when browser zoom changes ) is there any solution now ?
- Alexandr Zhuk asked 2 years ago
- last active 2 years ago
Javascript Stock Chart CategoryAxis date display minute ,second and microsecond
How to display date format HH:MM:SS.ssssss .
Can you please help me,
- sara uçar asked 2 years ago
- last active 2 years ago
I would like to create an annotation in which users can have a multi-line text annotation which can be looks like text-box
- Ramesh Sippy asked 2 years ago
Do you have Fibonacci Arcs and Retracements in JavaScript charts? If yes could you please provide a sample to build them.
- kijogi kijogi asked 2 years ago
- last active 2 years ago
@TypeScriptError Getting an 800A0404 error when opening any javascript file. This is happening in the Windows Script Host panel. Telling me that I have bad code, that’s not bad. This has been happening since upgrading my Java Version.
- julie diane asked 2 years ago
- last active 2 years ago
Hi,
I am facing a issue with RolloverModifier. I have multiple charts in single window. For some points the lines over the chart are missing.
Please find the attached images for some examples and the code for reproduce the issue. on the attachment you can see that the line on some chart is missing when mouse on left and right corner area of the chart
- Arun Surendran asked 2 years ago
- last active 2 years ago
I would like to create an arc annotation as shown in the attached image in Scichart JavaScript.
Please guide me on what will be the best way.
- Ramesh Sippy asked 2 years ago
- last active 2 years ago
Hello,
I have a Blazor WASM app running Scichart JS. In attempting to get any of the filters working listed in the Filters API docs I am unable to build my application and get thrown an error.
As listed in Moving Average Filter Docs I import the XyMovingAverageFilter:
import { XyMovingAverageFilter } from ‘scichart/Charting/Model/Filters/XyMovingAverageFilter’;
Run npm install and build the application and I get the error:
Module not found: Error: Can’t resolve ‘scichart/Charting/Model/Filters/XyMovingAverageFilter’ in …
So far I have not run into any issues getting any of the Scichart JS APIs working in this manner.
- Leland asked 2 years ago
- last active 2 years ago
Hello, I am running scichart in a blazorwasm app. On updating from 1.x to 2.2.2351 I am getting an uncaught error for a missing module on app startup before I make any calls to scichart to initialize.
The error is:
Uncaught Error: Cannot find module ‘../Charting/Model/Filters/HlcScaleOffsetFilter’
at webpackMissingModule (buildDataSeries.js:15:94)
at eval (buildDataSeries.js:15:215)
at Object../node_modules/scichart/Builder/buildDataSeries.js (strategyChart.js:133:1)
at webpack_require (strategyChart.js:21:30)
at eval (chartBuilder.js:45:25)
at Object../node_modules/scichart/Builder/chartBuilder.js (strategyChart.js:181:1)
at webpack_require (strategyChart.js:21:30)
at eval (SciChartSurface.js:30:22)
at Object../node_modules/scichart/Charting/Visuals/SciChartSurface.js (strategyChart.js:3253:1)
at webpack_require (strategyChart.js:21:30)
My webpack is:
 const path = require("path");
const CopyPlugin = require("copy-webpack-plugin");
const webpack = require("webpack");
module.exports = {
    mode: "development",
    entry: {
        strategyChart: './src/strategyChart.js'
    },
    module: {
        rules: []
    },
    resolve: {
        extensions: [".js"]
    },
    output: {
        path: path.resolve(__dirname, '../wwwroot'),
        filename: "[name].js",
        library: "[name]"
    },
    plugins: [
        new CopyPlugin({
            patterns: [
                { from: "node_modules/scichart/_wasm/scichart2d.data", to: "" },
                { from: "node_modules/scichart/_wasm/scichart2d.wasm", to: "" }
            ]
        }),
        new webpack.IgnorePlugin(/(fs)/)
    ]
};
- Leland asked 2 years ago
- last active 2 years ago
I have combed through KB articles and other documentations and samples here and SO, but I am not able to fix the issue. I am desperate for any help.
I have a react app that shows the chart, but at the top of the page, I have a header section and the remaining height is filled with Chart. All the samples and answers that I have seen thus far has no header section on the page. So the chart is 100% filled within it’s container. But, in my case the chart does not fit its container width & height and I end up with a scroll-bar. This is especially evident when you maximize the page (Chrome maximize window).
I am on Windows 10.
I have attached the code and a screen-shot of what the resulting page in Chrome. I have tried with and without CSS and it made no difference in terms of chart filling its container.
React Code:
import { useCallback, useEffect, useState } from 'react';
import { createRoot } from 'react-dom/client';
import './Chart-styles.scss';
import { SciChartSurface } from 'scichart/Charting/Visuals/SciChartSurface';
import { NumericAxis } from 'scichart/Charting/Visuals/Axis/NumericAxis';
import { getSciChartLicense } from '../common/chartUtils';

const Chart = () => {
const [chartId] = useState('line-chart');

const initChartAsync = useCallback(async () => {
    const { sciChartSurface, wasmContext } = await SciChartSurface.create(chartId);

    const xAxis = new NumericAxis(wasmContext);
    const yAxis = new NumericAxis(wasmContext);
    sciChartSurface.xAxes.add(xAxis);
    sciChartSurface.yAxes.add(yAxis);
}, []);

useEffect(() => {
    SciChartSurface.setRuntimeLicenseKey(getSciChartLicense());
    initChartAsync()
        .catch(error => {
            console.error('ChartRenderer | useEffect | initChartAsync failed!', error);
        });
}, [chartId]);

return (
    <div className="App">
        <div className='App-header'>
            <h2>Chart Header</h2>
            <h3>Chart Sub-Header</h3>
        </div>
        <div
            id={chartId}
            style={{width: '100%', height: '100%'}}
        />
    </div>
);
};

const container = document.getElementById('app');
const root = createRoot(container!);
root.render(<Chart/>);
Chart-Style.scss
#app {
    display: flex;
    flex-flow: column nowrap;
    margin: 0;
    padding: 0;
}

.App {
    flex: 1 1 auto;
    display: flex;
    flex-flow: column nowrap;
    text-align: center;
}

.App-header {
    flex: 0 1 auto;
    display: flex;
    flex-flow: column nowrap;
    background-color: #855b24;
    color: white;
    h2 {
        background-color: #2e2e2d;
        flex: 0 1 auto;
        margin: 0;
        padding: 2px;
    }
    h3 {
        background-color: #5c5c5b;
        flex: 0 1 auto;
        margin: 0;
        padding: 2px;
    }
}

#line-chart {
    flex: 1 1 auto;
}
- sachin patel asked 2 years ago
- last active 2 years ago
Hello,
I have a BlazorWASM app. I am wondering how to sync the x values of different renderable series that have different number of data points.
In a simple form, I am passing in the data for a moving average to be rendered on the chart that has already been populated with data. The moving average data has already been calculated and has the correct date timestamps. But when I add this series to the chart it is starting at index 0 of where the the price data started instead of where the xAxis date of this renderable series has.
I prefer not to use the filters api to regenerate this data as some will be complex and have already been calculated by study or pulled from a database. I have seen the article to offset a series but this seems unnecessary since I already have the x axis coordinate that I want each point of the new line series to be rendered.
Is there somewhere in the docs that I missed how to get these renderable series to line up properly to their own x data points?
Thank you
- Leland asked 2 years ago
- last active 2 years ago
Hi,
I am facing a issue with RolloverModifier. I have multiple charts in single window. For some points the lines over the chart are missing.
Please find the attached images for some examples and the code for reproduce the issue. on the attachment you can see that the line on some chart is missing when mouse on left and right corner area of the chart.
Posting again because on latest version also the same issue not resolved.
https://www.scichart.com/questions/js/rollovermodifier-in-multiple-chart-line-missing-on-some-areas
- Arun Surendran asked 2 years ago
- last active 2 years ago
Hey, how would I go about adding a custom template for the cursor axis labels using the Javascript 2D chart API?
I’d like the x-axis to not just have a date in MM/DD/YYYY format but a date and time displayed. The current implementation is below, and below that is the desired implementation.
Current: https://ibb.co/qJgJ36j
Desired: https://ibb.co/XzTkDgw
I have looked through the documentation but I may have missed something. If I have, please point me in the right direction, thanks!
- NICOS TOMBROS asked 2 years ago
- last active 2 years ago
Hi. I’m trying to add 3DChart to my vue project. And I have a question about the configuration. Can I download .data and .wasm files from the CDN.
For 2D charts , I’ve used recomendation of your release v.2.2:
SciChartSurface.useWasmFromCDN()
It works for me. How I can use CDN for SciChart3DSurface?
- Volodymyr Stoyanovskyy asked 2 years ago
- last active 2 years ago
