There doesn’t seem to be a corresponding IRenderableSeries3DViewModel object like there is in the 2D charts. What am i suppose to bind to the RenderableSeries property of the SciChart3DSurface? If I bind to a
ObservableCollection<IRenderableSeriesViewModel>
object, then I don’t see a corresponding SurfaceMeshRenderableSeries3DViewModel object similar to LineRenderableSeriesViewModel for 2D?
A simple example of series binding using 3D charts would be great!
- Andy None asked 7 years ago
- last active 5 years ago
I am trying to bind from my ViewModel to the DataSeries of a ScatterRenderableSeries3D, but no data is showing.
I am binding in this way:
…
My ViewModel has a property of type ObservableCollection<XyzDataSeries3D<DateTime, double, int>>. I can populate ChartItems, and see the data in it. The property is being notified of change as expected.
If I populate the DataSeries directly from code behind, it works, but not when being bound.
What am I doing wrong?
- Craig Muckleston asked 7 years ago
- last active 7 years ago
Hi,
Was hoping you could point me in the right direction. I’m trying to create horizontal line annotations on demand using MVVM but have become stuck. I’ve have them working in MVVM when the chart loads but not when a button is clicked although I have achieved this using code behind.
I’ve tried using an observable collection of AnnotationCollection type but am struggling to add the horizontal lines annotations to it as they are of a different type.
Any pointers in the right direction would be much appreciated!
Thanks,
Tim
Example of MVVM
TradeAnnotations = CreateHorizontalAnnotations();

private AnnotationCollection _annotations;

    public AnnotationCollection TradeAnnotations
    {
        get { return _annotations; }
        set
        {
            _annotations = value;
            OnPropertyChanged("TradeAnnotations");
        }
    }

    private static AnnotationCollection CreateHorizontalAnnotations()
    {
        //var annotations = new AnnotationCollection();

        var annotations = new AnnotationCollection();

        Color strokeColor = (Color)ColorConverter.ConvertFromString("#008B45");
        Brush strokeBrush = new SolidColorBrush(strokeColor);

        HorizontalLineAnnotation annotation = new HorizontalLineAnnotation();

        annotation.ShowLabel = true;
        annotation.LabelPlacement = LabelPlacement.Axis;
        annotation.HorizontalAlignment = HorizontalAlignment.Stretch;
        annotation.IsEditable = true;
        annotation.SnapsToDevicePixels = true;
        annotation.Stroke = strokeBrush;

        annotation.X1 = DateTime.Now;
        annotation.Y1 = 129;

        annotations.Add(annotation);

        return annotations;
    }
Example of code behind
        private void CreateHorizontalAnnotations(object sender, System.Windows.RoutedEventArgs e)
    {
        //var annotations = new AnnotationCollection();

        var annotationCollection = new AnnotationCollection();

        Color strokeColor = (Color)ColorConverter.ConvertFromString("#008B45");
        Brush strokeBrush = new SolidColorBrush(strokeColor);

        HorizontalLineAnnotation annotation = new HorizontalLineAnnotation();

        annotation.ShowLabel = true;
        annotation.LabelPlacement = LabelPlacement.Axis;
        annotation.HorizontalAlignment = HorizontalAlignment.Stretch;
        annotation.IsEditable = true;
        annotation.SnapsToDevicePixels = true;
        annotation.Stroke = strokeBrush;

        annotation.X1 = DateTime.Now;
        annotation.Y1 = 129;

        this.priceChart.Annotations.Add(annotation);
    }
- Tim Douglas asked 9 years ago
- last active 9 years ago
Hello!
I am getting started with SciChart and attempting to use it for a project I’m working on.
I am attempting to make a 3D scatter plot whose data is populated through a ViewModel.
Below is a my xaml:
 <UserControl x:Class="CustomWindow.Pages.Results_Page.Common_Tests.Positional6DOFErrorTest"
             xmlns="http://schemas.microsoft.com/winfx/2006/xaml/presentation"
             xmlns:x="http://schemas.microsoft.com/winfx/2006/xaml"
             xmlns:mc="http://schemas.openxmlformats.org/markup-compatibility/2006"
             xmlns:d="http://schemas.microsoft.com/expression/blend/2008"
             xmlns:enum="clr-namespace:MultiMet.Interfaces.Common;assembly=MultiMet.Interfaces"
             xmlns:xcdg="http://schemas.xceed.com/wpf/xaml/datagrid"
             xmlns:s3D="http://schemas.abtsoftware.co.uk/scichart3D"
             mc:Ignorable="d"
             d:DesignHeight="360" d:DesignWidth="712">

    <Grid Background="White">
        <Grid.RowDefinitions>
            <RowDefinition Height="*"/>
        </Grid.RowDefinitions>
        <Grid.ColumnDefinitions>
            <ColumnDefinition Width="*"/>
            <ColumnDefinition Width="*"/>
        </Grid.ColumnDefinitions>

        <!-- Some other stuff I'm doing on the page -->

        <s3D:SciChart3DSurface Grid.Column="1" ShowLicensingWarnings="True"
                        IsFpsCounterVisible="False"
                         IsAxisCubeVisible="True"
                         IsXyzGizmoVisible="False"
                         CoordinateSystem="RightHanded"
                               Background="White" RenderableSeries="{s3D:SeriesBinding RenderableSeries3DViewModels}">
            <!-- Create XAxis -->
            <s3D:SciChart3DSurface.XAxis>
                <s3D:NumericAxis3D TickTextBrush="Black" AxisTitle="X (mm)" DrawMajorBands="True" DrawMajorGridLines="True"
                        DrawMinorGridLines="True"
                        DrawMajorTicks="True"
                        DrawMinorTicks="True"
                        AxisBandsFill="Transparent"
                        FontSize="10"
                        TickLabelAlignment="Camera"
                                   GrowBy="0.1, 0.1"/>
            </s3D:SciChart3DSurface.XAxis>
            <!-- Create YAxis -->
            <s3D:SciChart3DSurface.YAxis>
                <s3D:NumericAxis3D AxisTitle="Z (mm)"
                        AxisBandsFill="Transparent"
                        TickTextBrush="Black"
                        FontSize="10"
                        TickLabelAlignment="Camera"
                                   GrowBy="0.1, 0.1"/>
            </s3D:SciChart3DSurface.YAxis>
            <!-- Create ZAxis -->
            <s3D:SciChart3DSurface.ZAxis>
                <s3D:NumericAxis3D AxisTitle="Y (mm)"
                        AxisBandsFill="Transparent"
                        TickTextBrush="Black"
                        FontSize="10"
                        TickLabelAlignment="Camera"
                                   GrowBy="0.1, 0.1"/>
            </s3D:SciChart3DSurface.ZAxis>

            <!-- Create Interactivity Modifiers for rotating camera -->
            <s3D:SciChart3DSurface.ChartModifier>
                <s3D:ModifierGroup3D>
                    <s3D:OrbitModifier3D ExecuteOn="MouseLeftButton" ExecuteWhen="None"/>
                    <s3D:MouseWheelZoomModifier3D MouseWheelSensitivity="90" />
                    <s3D:FreeLookModifier3D ExecuteOn="MouseRightButton"/>
                    <s3D:TooltipModifier3D IsEnabled="True" SourceMode="AllSeries" ShowTooltipOn="MouseOver"/>
                </s3D:ModifierGroup3D>
            </s3D:SciChart3DSurface.ChartModifier>
        </s3D:SciChart3DSurface>
    </Grid>
</UserControl>
And below I declare and define my scatter plot in the viewmodel (the scatterSeries is an XyzDataSeries3D set somewhere else) :
    PositionalErrorTestModel.RenderSeries3DViewModels = new ObservableCollection<IRenderableSeries3DViewModel>();
PositionalErrorTestModel.RenderSeries3DViewModels.Add(new ScatterRenderableSeries3DViewModel
            {
                PointMarker = new SpherePointMarker3D { Fill = System.Windows.Media.Color.FromRgb(0x78, 0xC3, 0), Size = 5, Opacity = 1 },
                DataSeries = scatterSeries
            });
The chart appears, but the data does not. Is there something I’m missing? Do I need to explicitly call an update to the chart? Because the page the chart is on and the chart does get loaded before the data is populated.
Please let me know if you need to know anymore information.
Thanks for any help you can provide!
- Andy Murray asked 4 years ago
- last active 4 years ago
I’m trying to build a chart control that adheres to MVVM and noticed that I have the option to use NumericAxis or NumericAxisForMvvm, but I’m not sure exactly what the differences would be. I couldn’t really find anything in depth on them in the documentation but maybe I missed something.
Is anyone aware of any differences? I’m assuming NumericAxisForMvvm would be best for what I’m wanting but I’m not exactly sure why.
Thanks!
- Greg Knox asked 5 years ago
- last active 5 years ago
Hello again!
I’m working with new scichart version (5th august). In view XAML file I have this code snippet:
visuals:SciChartSurface Annotations="{Binding AnnotationCollection}" SeriesSource="{Binding GraphicsCollection}" XAxis="{Binding XAxis, Mode=TwoWay}" YAxes="{Binding YAxisCollection}" >
When I try to run the application, I get this NullReferenceException:
   в A. .Convert(Object value, Type targetType, Object parameter, CultureInfo culture)
   в System.Windows.Data.BindingExpression.TransferValue(Object newValue, Boolean isASubPropertyChange)
   в System.Windows.Data.BindingExpression.Activate(Object item)
   в System.Windows.Data.BindingExpression.AttachToContext(AttachAttempt attempt)
   в System.Windows.Data.BindingExpression.AttachOverride(DependencyObject target, DependencyProperty dp)
   в System.Windows.Data.BindingExpressionBase.OnAttach(DependencyObject d, DependencyProperty dp)
   в System.Windows.DependencyObject.SetValueCommon(DependencyProperty dp, Object value, PropertyMetadata metadata, Boolean coerceWithDeferredReference, Boolean coerceWithCurrentValue, OperationType operationType, Boolean isInternal)
   в System.Windows.DependencyObject.SetValue(DependencyProperty dp, Object value)
   в System.Windows.Data.BindingOperations.SetBinding(DependencyObject target, DependencyProperty dp, BindingBase binding)
   в System.Windows.FrameworkElement.SetBinding(DependencyProperty dp, BindingBase binding)
   в Abt.Controls.SciChart.Visuals.Annotations.LineAnnotationWithLabelsBase.VB()
   в Abt.Controls.SciChart.Visuals.Annotations.LineAnnotationWithLabelsBase.TB()
   в Abt.Controls.SciChart.Visuals.Annotations.LineAnnotationWithLabelsBase.OnXAxesCollectionChanged(Object sender, NotifyCollectionChangedEventArgs args)
   в Abt.Controls.SciChart.Visuals.Annotations.AnnotationBase.Abt.Controls.SciChart.Visuals.Annotations.IAnnotation.OnXAxesCollectionChanged(Object sender, NotifyCollectionChangedEventArgs args)
   в Abt.Controls.SciChart.Visuals.Annotations.AnnotationCollection.OnXAxesCollectionChanged(Object sender, NotifyCollectionChangedEventArgs args)
   в Abt.Controls.SciChart.Visuals.SciChartSurface.OnXAxesCollectionChanged(Object sender, NotifyCollectionChangedEventArgs args)
   в System.Collections.Specialized.NotifyCollectionChangedEventHandler.Invoke(Object sender, NotifyCollectionChangedEventArgs e)
But if I change my xaml file this way:
visuals:SciChartSurface SeriesSource="{Binding GraphicsCollection}" XAxis="{Binding XAxis, Mode=TwoWay}" YAxes="{Binding YAxisCollection}"
Annotations="{Binding AnnotationCollection}"   >
there won’t be any exceptions. I’ve attached project with exception below.
P.S. in the previuous version it works fine.
- Egor asked 9 years ago
Using MVVM, I have an AnnotationCollection databound to the SciChartSurface.Annotations. Individual LineAnnotations are added to the collection as the application code runs.
If annotations are added while the chart is displayed, they are all drawn correctly.
However, if the chart page is reloaded (say, the user navigates to a different page and then returns to the chart page), the annotations do not always redraw. If the annotations have AnnotationCanvas set to default (AnnotationCanvas.AboveChart, I believe) they redraw correctly about 50% of the time. If the annotations’ AnnotationCanvas is set to AnnotationCanvas.XAxis, they never redraw.
All the annotations still exist in the ObservableCollection in all these cases, so they shouldn’t need to be re-created.
Is this a bug in SciChart or is there something I may be doing wrong with the annotations?
(There is only one X-Axis so no axisID is necessary.)
LineAnnotation lAnno = new LineAnnotation();
lAnno.CoordinateMode = AnnotationCoordinateMode.RelativeY;
lAnno.Y1 = 0.0;
lAnno.X1 = DataPoints;
lAnno.Y2 = 1.0;
lAnno.X2 = DataPoints;
lAnno.YAxisId = "Counts";
lAnno.Foreground = new System.Windows.Media.SolidColorBrush(System.Windows.Media.Color.FromRgb(255, 255, 255));
lAnno.Stroke = new System.Windows.Media.SolidColorBrush(System.Windows.Media.Color.FromArgb(96, 255, 0, 0));
lAnno.StrokeThickness = 2;
lAnno.AnnotationCanvas = AnnotationCanvas.XAxis;

Markers.Add(lAnno);
- Matthew Becker asked 8 years ago
- last active 8 years ago
Hi,
I’m trialing SciChart and want to chart an XY Series where the X values are DateTime. I want to be able to switch between plotting the data as a single series on a DateTimeAxis and plotting multiple series per Date on a NumericAxis by splitting the original series into 1 series per day with the X value being the time of day in hours (Integer). Is there an easy way to switch between a DateTime and Numeric axis from my View Model – I’ve tried creating two axis with seperate Id’s and changing the visibility but it didn’t work
Regards
Dave
- Dave Waterworth asked 10 years ago
- last active 10 years ago
Hello.
I’m just started to use SciChart and I have a question. How I can mirror XAxis in order to values will be increased from right to left. It is not negative scale but this view is more familiar for users (now I remake the old application). P.S. And be the best if additionally you show me how to make static XAxis with chosen range. I see the example in demo’s “Create Realtime Charts” section (my chart will be real-time too), but my application created via MVVM and I think this example not fully applicable to my case (but I fink after some investigation I will can remake example, but if you help me it be easier).
- Fedor Iudin asked 5 months ago
- last active 5 months ago
Requirements:
- Main graph updates based on the data from the selected Item.
- The data and styling is independent and the style is dynamic global style for all Items.
- The data for the graphing that is Data Series is binded to DataSet which is of type XYDataSeries<DateTime, double>.
- DataSeries data is obtained from the datacontext which implements INotifyPropertyChanged
Problem:
- The databinding is not dynamic and the data series is not updated when the selection changes.
- The initial data selection is reflected but any subsequent data changes are not reflected on the sci chart surface.
- This behavior was only for the Dataseries binding and it was verified using a textbox which binds to the count of the DataSet and this updates as the selection changes but not the dataseries.
Please suggest a work around or an alternative solution so that I can predefine axes and series but swap out the data based on the selected Item. Please see the attached xaml code below.
        <Grid>
        <Grid DockPanel.Dock="Top">
            <chart:SciChartSurface x:Name="mainView"
                                   OnRenderException="MainView_OnRenderException"
                                   Loaded="MainView_Loaded">
                <chart:SciChartSurface.YAxes>
                    <chart:NumericAxis x:Name="AxisOne"
                                       Id="Id1"
                                       AxisAlignment="Left"/>

                    <chart:NumericAxis x:Name="AxisTwo"
                                       Id="Id2"
                                       AxisAlignment="Left"/>

                </chart:SciChartSurface.YAxes>
                <chart:SciChartSurface.XAxis>
                    <chart:DateTimeAxis x:Name="DateTimeAxis"/>
                </chart:SciChartSurface.XAxis>
                <chart:SciChartSurface.RenderableSeries>
                    <chart:FastLineRenderableSeries x:Name="DataSet1FS"
                                                    DataSeries="{Binding DataSet1}"
                                                    YAxisId="Id1"
                                                    Stroke="Yellow"/>
                </chart:SciChartSurface.RenderableSeries>
            </chart:SciChartSurface>
        </Grid>
        <TextBlock Text="{Binding Path=DataSet1.Count}"
                            Margin="0 -20 0 0"
                            HorizontalAlignment="Right"
                            VerticalAlignment="Top"
                            Height="20"
                            Width="200"
                            Background="White"
                            Foreground="Black"/>
    </Grid>
- Arjun Sivaprasadam asked 1 year ago
- last active 1 year ago
Good day,
we are using the VerticalSliceModifier for sorted data and it works very good.
<local:VerticalSliceModifierExt x:Name="SliceModifier">
<s:VerticalSliceModifier.VerticalLines>
    <chartModifier:SnappyVerticalLine x:Name="VerticalLine"
                          ShowLabel="False"
                          X1="0"
                          Y1="0"
                          CoordinateMode="Absolute"
                          IsEditable="True">
    </chartModifier:SnappyVerticalLine>
</s:VerticalSliceModifier.VerticalLines>
Please see the image “Example Vertical Slice Modifier”.
The challange is to have something similar for unsorted data.
One of the issues are multiple intersections. Please see the image “Multiple Intersections” where i would like be able to select what intersections shall be highlighted.
The next challange is the usage of multiple series and synchronization based on a different property (t for time). Please see “Multiple Series” image.
We already have IPointMetadata with X,Y and t to be able to find the data point to highlight.
My question: Is there already some modifier chat can help with this requirements or what would be a clean solution if we need to develop a custom modifier.
Thank you in advance
Paul
- Paul Stempel asked 6 months ago
- last active 4 months ago
Hi SciChart team,
I have built a xyscatter chart with DateTime type X-Axis and Double type Y-Axis,
and built boxannotations to mark areas.
May I set the x-Axis value in the tooltip?
Or can I show properties of each item which means every point in the xyscatterseries, and customize the tooltip content style like adding the description of every properties.
- Wade Yao asked 3 years ago
- last active 3 years ago
Hello
In Tutorial 06b – Realtime Updates, I want change the <s:SciChartSurface.XAxis> from <s:NumericAxis/> to <s:DateTimeAxis/> . I have tried a lot, but it still doesn’t work.
Could you please help me to do this work.
Thank you very much.
- Zhi Zhang asked 8 months ago
- last active 8 months ago
I’m trying to set the visible range property of a CategoryDateTimeAxis through MVVM. I’m following the general instructions detailed here for converting between pixel & data coordinates on the axis:
https://www.scichart.com/questions/question/categorydatetimeaxis-in-mvvm#sabai-inline-nav
I have the following code in my viewmodel:
XAxis.OnBeginRenderPass();
var calc = XAxis.GetCurrentCoordinateCalculator();
var coordCalc = calc as ICategoryCoordinateCalculator;
XAxis is a CategoryDateTimeAxis injected from the view. I call OnBeginRenderpass as I saw in another forum post that this will ensure that the CoordinateCalculator is initialized.
calc shows in the debugger as:
- calc {A.} Abt.Controls.SciChart.Numerics.CoordinateCalculators.ICoordinateCalculator {A.}
The coordCalc variable ends up assigned to NULL, as the ICoordinateCalculator< double > cannot be cast to the interface.
How do I accomplish the above?
Thanks, Asher
- ashernew asked 8 years ago
- last active 8 years ago
I’ve created an application with MVVM in mind and managed to create a simple, working graph with SciChart that displays the data needed.
I’ve also seen some features (https://www.scichart.com/customer-case-study-blueshift-one-system/) which we’ll be planning on implementing, designing it to fit our own needs of course.
I’m wondering if there are some limitations (and perhaps improvements in later releases), that we could keep in mind while continuing to plan and develop our application with SciChart and MVVM?
- Janne Ojanperä asked 10 years ago
- last active 8 years ago
Hello,
I’m trying to display a vertical line annotation on a chart using MVVM.
In order to make it work I’ve (All the INotifyPropertyChanged are managed via the BaseViewModel)
public class GraphSurfaceBaseViewModel : BaseViewModel
{
    /// <summary>
    /// A list of annotations
    /// </summary>
    public ObservableCollection<IAnnotationViewModel> Annotations { get; private set; }

 ...
}
I create annotation that way
Graph.Annotations.Add(new VerticalLineAnnotationViewModel()
            {
                X1 = TimeOfComment,
                ShowLabel = true,
                StrokeThickness = 2,
                XAxisId = "Xaxis",
                YAxisId = "Yaxis1",
                AnnotationLabels = new ObservableCollection<AnnotationLabel>() { new AnnotationLabel() {Text = "mon test", LabelPlacement = LabelPlacement.TopRight } }

            });
And the binding to the scichartsurface is :
<s:SciChartSurface
...
Annotations="{s:AnnotationsBinding Annotations}"
</s:SciChartSurface>
I’ve double check that my x axis and y axis have the same ID as the annotation.
The problem is I want to display several annotation labels but they are not appearing. I suspect a problem via the AnnotationsBinding which is not taking the AnnotationLabels from the VerticalLineAnnotationViewModel.
What I got :

What I want (paint skill here):

For the what I want, I can draw a simple vertical bar by settings showLabel = false but I suppose that all the label I previously added to the
AnnotationLabels will not be shown, that’s why I let it.
Thank you for any help.
Renaud
- Renaud Danniau asked 5 years ago
- last active 5 years ago
How to programmatically add Scrollbars to MVVM instantiated axes?
I added DateTimeAxisViewModel and NumericAxisViewModel to my code. That works from so far. A way to add scrollbars i couldnt find a some tries.
Are there some ways to get this done? Maybe change the templates of the axes or the chart?
Best regards
- Alexander Buhles asked 6 years ago
- last active 10 months ago
I’m trying to implement custom annotations using the MVVM pattern. I’ve been using your tutorial as an example (https://www.scichart.com/databinding-annotations-with-mvvm/). Everything works as expected if I manually load some example data to the annotations collection. When I actually try to load the data from our database using async method, the annotations are no longer drawn.
Is this by design or am I doing something wrong? Do you have any suggestions how to load annotations when using async code and MVVM patterns? I haven’t had any problems loading the actual time series on the chart using the same pattern.
I also tried binding the SciChartSurface’s Annotations property to AnnotationCollection and then calling ChartAnnotations.ParentSurface.InvalidateElement(), but the issue still persists.
You can easily reproduce this behavior by adding an async call to the examples’s source code:
private async Task Initialize()
{
    var ds0 = new XyDataSeries<double, double>();
    var someData = new RandomWalkGenerator().GetRandomWalkSeries(200); // RandomWalkGenerator is found in the examples source code

    ds0.Append(someData.XData, someData.YData);

    _chartSeries = new ObservableCollection<IChartSeriesViewModel>();
    _chartSeries.Add(new ChartSeriesViewModel(ds0, new FastLineRenderableSeries()));

    // Now create the labels
    _chartLabels = new List<LabelViewModel>
                       {
                           new LabelViewModel(5, -2.5, "Label0", "Label0 Tooltip!"),
                           new LabelViewModel(20, -2, "Label1", "Label1 Tooltip!"),
                           new LabelViewModel(35, 3, "Label2", "Label2 Tooltip!"),
                           new LabelViewModel(50, 1.5, "Label3", "Label3 Tooltip!"),
                       };

    await Test();

    _chartLabels.Add(new LabelViewModel(65, -0.5, "AFTER ASYNC", "Label4 Tooltip!"));
}

private async Task Test()
{
    await Task.Delay(5000);
}
- Juho asked 7 years ago
- last active 7 years ago
I am trying out SciChart ( and WPF ) for a large dataset and till so far very pleased with the results. I have followed the example as described here http://support.scichart.com/index.php?/Knowledgebase/Article/View/17258/0/creating-a-custom-scichartoverview-with-many-series-using-the-scrollbar-api and can successfully view my bound data and everything is perfect for the first instance.
However, when I assign this usercontrol to different tabs they still somehow share data about the viewstate ( the overview window does not resize, and the slider thing in front of it stays at the same values. My guess is that it has to do with the messages in ActualSizePropertyProxy , but since I am new to SciChart and WPF I was hoping that maybe someone here knows what it is.
Thanks.
- Michel Moe asked 9 years ago
- last active 4 years ago
Hi,
CompositeAnnotation works perfectly and easy to use, but I need it in MVVM. CompositeAnnotationViewModel looks the same, but it is not visible. This is my code:
AnnotationViewModels.Add(new CompositeAnnotationViewModel()
{
    Annotations = new ObservableCollection<IAnnotationViewModel>()
    {
        new VerticalLineAnnotationViewModel
        {
            VerticalAlignment = VerticalAlignment.Stretch,
            Stroke = Colors.Blue,
            StrokeThickness = 2,
            IsEditable = true,
            StrokeDashArray = new DoubleCollection() { 2, 2 },
            CoordinateMode = AnnotationCoordinateMode.Relative,
            X1 = 0
        },
        new VerticalLineAnnotationViewModel
        {
            VerticalAlignment = VerticalAlignment.Stretch,
            Stroke = Colors.Blue,
            StrokeThickness = 2,
            IsEditable = true,
            StrokeDashArray = new DoubleCollection() { 2, 2 },
            CoordinateMode = AnnotationCoordinateMode.Relative,
            X1 = 1
        }
    },
    IsEditable = true,
    X1 = 3,
    X2 = 5
});
What is my mistake?
- Alexander Erkabaev asked 6 years ago
- last active 6 years ago
How can I apply my style and template to my axes if I created the axes as NumericAxisViewModel in code and bound them to my SciChartSurface in my xaml view?
Regards,
Roland
- Roland D asked 5 years ago
- last active 2 years ago
Hi Sci Chart,
I am using WPF with MVVM.
What i want to achieve is by reading the rollover modifier current hit point data, when user click left click, i want to add VerticalSliceModifier in the graph based on the hit point.
Attach is my code from xaml and viewmodel.
I have two issues which are:
“if (DistanceSeriesData.SeriesInfo.Count > 0)”, i always get zero count of seriesinfo.
In DistanceVerticalLines?.Add(new VerticalLineAnnotation(), the added Distance Vertical Lines data did not reflect in graph.
- Chee Wei Liu asked 3 years ago
Hello,
I have created some ChartModifiers in a ModifierGroup in my ViewModel class (using Caliburn.Micro as MVVM framework, not code behind) and bound the group to my SciChartSurface in xaml. Now I want to apply some styles to my modfiers in xaml. Just creating styles with the specific target types don’t work so how do I do this?
- Roland D asked 5 years ago
- last active 5 years ago
When I select a series/plot, I would like to identify where it came with more than just the Name member. How can I do that?
Background:
I have a list of unsigned integer values taken from a data logger. I bundle the values up in a class with some other information, such as the name of the sample and an ID string.
Since I can’t data bind to the logged samples as-is, I convert them to a SciChart friendly “LineRenderableSeriesViewModel” and add them to a list of “ObservableCollection” that I data bind to a SciChart.
ViewModel.cs:
// Where "loggedSamples" is a SamplesContainer
//class SamplesContainer
//{
//    public string Name;
//    public string ID;  **<=== I want to get this somehow when I select something**
//    public Uint16 data {get;set;}
//}

// Convert Samples => XyDataSeries => LineRenderableSeriesViewModel

SamplesContainer loggedSamples = GetLoggedSample();
XyDataSeries<double, double> xySeries = ConvertSamplesToXyDataSeries(loggedSamples);
xySeries.SeriesName = loggedSamples.Name;

LineRenderableSeriesViewModel lineSeries = new LineRenderableSeriesViewModel() {
    DataSeries = xySeries, StyleKey = "LineStyle", Stroke = Colors.Blue };

RenderableSeriesViewModelForChannels.Add(lineSeries);
MainWindow.xaml:
   <s:SciChartSurface Name="sciChartItemView" Grid.Column="2"
    AllowDrop="True"
    DragDrop.Drop="sciChartItemView_Drop"
    DragDrop.DragEnter="sciChartItemView_DragEnter"
    MinHeight="80"
    s:ThemeManager.Theme="BrightSpark"
    RenderableSeries="{s:SeriesBinding RenderableSeriesViewModelForChannels}"
    ViewportManager="{Binding SampleSetViewMod.ViewportManager}"
    DebugWhyDoesntSciChartRender="True"
    s:SciChartGroup.VerticalChartGroup="sharedYAxisWidth"
    >

    <s:SciChartSurface.XAxis>
        <s:NumericAxis
        DrawMajorGridLines="True"
        DrawMinorGridLines="False"
        DrawMajorBands="False"
        VisibleRange="{Binding SampleSetViewMod.SharedXVisibleRange, Mode=TwoWay}"
        Visibility="Hidden"
        TextFormatting="0.######"/>
    </s:SciChartSurface.XAxis>

    <s:SciChartSurface.YAxis>
        <s:NumericAxis AxisAlignment="Left"
        DrawMajorGridLines="False"
        DrawMinorGridLines="False"
        DrawMajorBands="False"
        Visibility="Visible">
            <s:NumericAxis.GrowBy>
                <s:DoubleRange Min="0.1" Max="0.1" />
            </s:NumericAxis.GrowBy>
        </s:NumericAxis>

    </s:SciChartSurface.YAxis>

    <s:SciChartSurface.ChartModifier>
        <s:ModifierGroup>
            <s:ZoomExtentsModifier XyDirection="YDirection"/>

            <s:ZoomPanModifier ExecuteOn="MouseMiddleButton" XyDirection="XYDirection" ClipModeX="ClipAtExtents" />

            <local:ExtendedMouseWheelZoomModifier />

            <s:RubberBandXyZoomModifier IsEnabled="True"
                IsXAxisOnly="False"
                ReceiveHandledEvents="True" />
            <s:LegendModifier ShowLegend="True" Orientation="Vertical" Margin="10"
                GetLegendDataFor="AllSeries"
                ShowVisibilityCheckboxes="False"
                HorizontalAlignment="Right"
                LegendPlacement="Inside"
                Background="White"
                />

            <local:ExtendedSeriesSelectionModifier SelectionChanged="SeriesSelectionModifier_OnSelectionChanged">
                <local:ExtendedSeriesSelectionModifier.SelectedSeriesStyle>
                    <Style TargetType="s:FastLineRenderableSeriesForMvvm">
                        <Setter Property="StrokeDashArray" Value="10,5"/>
                    </Style>
                </local:ExtendedSeriesSelectionModifier.SelectedSeriesStyle>
            </local:ExtendedSeriesSelectionModifier>


            <!--<s:CursorModifier x:Name="cursorModifier" IsEnabled="True" />
        <s:RolloverModifier x:Name="rolloverModifier" IsEnabled="True"/>-->
        </s:ModifierGroup>
    </s:SciChartSurface.ChartModifier>
</s:SciChartSurface>
- Christopher Bennet asked 7 years ago
- last active 7 years ago
Hello.
Thanks for previous answer but I can’t check how it work because of new problem. I develop WPF application and try to use MVVM as architecture pattern. In the Model part of my application I used a loop started in the new thread. In that loop I get some data which received to ViewModel and used as chart data. Looks as usual.
But then I tried to set visible range updated object which bound to axis I get exception ‘System.InvalidOperationException: ‘The calling thread cannot access this object because a different thread owns it.’ in my loop. I know it happens in WPF applications and need to use Dispatcher to solve it. But as I know if you try to use MVVM you not needed to use Dispatcher often because WPF-binding in most cases is thread-safe. That happend in my case? How to solve it?
Parts of my code:
XAML
<Window x:Class="HMI.MainWindow"
        xmlns="http://schemas.microsoft.com/winfx/2006/xaml/presentation"
        xmlns:x="http://schemas.microsoft.com/winfx/2006/xaml"
        xmlns:d="http://schemas.microsoft.com/expression/blend/2008"
        xmlns:mc="http://schemas.openxmlformats.org/markup-compatibility/2006"
        xmlns:s="http://schemas.abtsoftware.co.uk/scichart"
        xmlns:localVM="clr-namespace:MyCom.HMI.ViewModel"
        mc:Ignorable="d"
        Title="MainWindow" Height="450" Width="800">
    <Window.DataContext>
        <localVM:HMIViewModel/>
    </Window.DataContext>
    <Window.Resources>
        <localVM:InverseBooleanConverter x:Key="InverseBooleanConverter"/>
        <localVM:ProcessStateToColorConverter x:Key="ProcessStateToColorConverter"/>
        <localVM:ProcessStateToStartedConverter x:Key="ProcessStateToStartedConverter"/>
        <localVM:ProcessStateToStoppedConverter x:Key="ProcessStateToStoppedConverter"/>
    </Window.Resources>
    <DockPanel>
        <StackPanel DockPanel.Dock="Top" Orientation="Horizontal">
            <StackPanel DockPanel.Dock="Left" Orientation="Vertical" Width="520">
                <Border DockPanel.Dock="Top" Margin="5" Padding="5" BorderBrush="Black" BorderThickness="1,1,1,1" CornerRadius="5">
                    <StackPanel DockPanel.Dock="left" Orientation="Horizontal" Height="40">
                        <Ellipse Margin="5" Height="20" Width="20" HorizontalAlignment="Left" VerticalAlignment="Center" Stroke="Black" Fill="{Binding ProcessState, Converter={StaticResource ProcessStateToColorConverter}}"/>
                        <Label Content="State" Margin="5" Width="90" HorizontalContentAlignment="Left" VerticalContentAlignment="Center"/>
                    </StackPanel>
                </Border>
                <Border DockPanel.Dock="Top" Margin="5" Padding="5" BorderBrush="Black" BorderThickness="1,1,1,1" CornerRadius="5">
                    <Grid DockPanel.Dock="Left" Height="300">
                        <s:SciChartSurface ChartTitle="Profil" RenderableSeries="{s:SeriesBinding RenderableSeries}">
                            <s:SciChartSurface.XAxis>
                                <s:NumericAxis AxisTitle="Position, m" VisibleRange="{Binding XVisibleRange, Mode=TwoWay}"/>
                            </s:SciChartSurface.XAxis>
                            <s:SciChartSurface.YAxis>
                                <s:NumericAxis AxisTitle="Size, um" VisibleRange="{Binding YVisibleRange, Mode=TwoWay}"/>
                            </s:SciChartSurface.YAxis>
                        </s:SciChartSurface>
                    </Grid>
                </Border>
            </StackPanel>
...
ViewModel
namespace MyCom.HMI.ViewModel
{
    public class HMIViewModel : BindableBase
    {
        private readonly HMIModel _model = new();

        public HMIViewModel()
        {
            _renderableSeries = new ObservableCollection<IRenderableSeriesViewModel>();

            ((INotifyCollectionChanged)_model.TestControlData).CollectionChanged += (s, e) =>  { TestControlDataChanged(e); };

            InitCharts();
        }

...

        private ObservableCollection<IRenderableSeriesViewModel> _renderableSeries;
        public ObservableCollection<IRenderableSeriesViewModel> RenderableSeries
        {
            get { return _renderableSeries; }
            set
            {
                SetProperty(ref _renderableSeries, value, nameof(RenderableSeries));
            }
        }

        private IRange _xVisibleRange;
        public IRange XVisibleRange
        {
            get => _xVisibleRange;
            set
            {
                if (_xVisibleRange != value)
                {
                    SetProperty(ref _xVisibleRange, value, nameof(XVisibleRange));
                }
            }
        }

        private IRange _yVisibleRange;
        public IRange YVisibleRange
        {
            get => _yVisibleRange;
            set
            {
                if (_yVisibleRange != value)
                {
                    SetProperty(ref _yVisibleRange, value, nameof(YVisibleRange));
                }
            }
        }

        private XyDataSeries<double, double> _lineDataDiameter1;

...

        private void InitCharts()
        { // TODO
            _lineDataDiameter1 = new XyDataSeries<double, double>()
            {
                SeriesName = "Diameter1"
            };

            RenderableSeries.Add(new LineRenderableSeriesViewModel()
            {
                StrokeThickness = 2,
                Stroke = Colors.SteelBlue,
                DataSeries = _lineDataDiameter1,
                StyleKey = "LineSeriesStyle"
            });
        }

        private void TestControlDataChanged(NotifyCollectionChangedEventArgs args)
        {
            if (args.Action == NotifyCollectionChangedAction.Add && args.NewItems?.Count > 0)
            {
                var testControlActualState = args.NewItems.Cast<TestControlActualState>();

                List<double> xValues = new();
                List<double> yValuesDiameter1 = new();

                foreach (var item in testControlActualState)
                {
                    if (item.Diameter1 > 0f)
                    {
                        xValues.Add(item.FiberLength);
                        yValuesDiameter1.Add(item.Diameter1);
                    }
                }

                _lineDataDiameter1.Append(xValues, yValuesDiameter1);

                // TODO
                if (xValues.Count > 0)
                {
                    var cuurMaxValueX = xValues.Max();
                    XVisibleRange.Max = cuurMaxValueX;
                    XVisibleRange.Min = cuurMaxValueX - 7000f > 0 ? cuurMaxValueX - 7000f : 0;
                }

                // TODO
                if (yValuesDiameter1.Count > 0)
                {
                    var cuurMaxValueY = yValuesDiameter1.Max();
                    YVisibleRange.Max = cuurMaxValueY + 50;
                    YVisibleRange.Min = 0;
                }
            }
        }
Model
namespace MyCom.HMI.Model
{
    public class HMIModel : BindableBase, IDisposable
    {
        private readonly ObservableCollection<TestControlActualState> _testControlData;
        internal ReadOnlyObservableCollection<TestControlActualState> TestControlData { get; }

        public HMIModel()
        {
            _testControlData = new ObservableCollection<TestControlActualState>();
            TestControlData = new ReadOnlyObservableCollection<TestControlActualState>(_testControlData);
        }

...

        private void StartPollerThread()
        {
            _pollerCancellationToken ??= new CancellationTokenSource();

            if (!_pollerCancellationToken.IsCancellationRequested)
            {
                Task.Factory.StartNew(() => PollerDoWork(_pollerCancellationToken.Token), TaskCreationOptions.LongRunning);
            }
        }

        private void PollerDoWork(CancellationToken cancellationToken)
        {
            try
            {
                Thread.CurrentThread.Priority = ThreadPriority.Lowest;
                IsPollerStarted = true;

                while (!cancellationToken.IsCancellationRequested && (_isKeepConnection || _countOfTrying <= MAX_COUNT_OF_TRYING))
                {
                    try
                    {
                        _testControlData.Add(_emulator.GetTestControlActualState());

                        if (!_isKeepConnection && _countOfTrying > 0)
                        {
                            Thread.Sleep(_pollerTimeout / REASK_COEFICIENT);
                            continue;
                        }
                    }
                    catch
                    {
                        // Thread must be alive!!! ...ALWAYS!!!
                    }
                    Thread.Sleep(_pollerTimeout);
                }
            }
            finally
            {
                IsPollerStarted = false;
                _pollerCancellationToken = null;
            }
        }
- Fedor Iudin asked 5 months ago
- last active 5 months ago
Hello,
I am trying to add a BoxAnnotation with MVVM pattern where the X-Axis is a DateTime axis. The annotation can be dragged into the X-direction. I need to know the DateTime of each position while dragging and also the final position(DateTime) of the BoxAnnotation when the drag Ended. I am listening to the DragDelta and DragEnded events in ViewModel. But here I couldn’t able to get the DateTime from X1 and X2 of that annotation model. I am sharing some snippets of my code. Can you please let me know how I can achieve this?
In xaml:
<Style x:Key="_boxAnnotationStyle" BasedOn="{StaticResource AnnotationBaseStyle}" TargetType="scichart:BoxAnnotation">
        <Setter Property="Template">
            <Setter.Value>
                <ControlTemplate TargetType="scichart:BoxAnnotation">
                    <Border x:Name="PART_BoxAnnotationRoot"
              Margin="{TemplateBinding Margin}"
              Background="{TemplateBinding Background}"
              BorderBrush="{TemplateBinding BorderBrush}"
              BorderThickness="{TemplateBinding BorderThickness}"
              CornerRadius="{TemplateBinding CornerRadius}" />
                </ControlTemplate>
            </Setter.Value>
        </Setter>
</Style>
<scichart:SciChartSurface x:Name="GraphSurface"
                 Annotations="{scichart:AnnotationsBinding ItsAnnotations}">

                <scichart:SciChartSurface.XAxis>
                    <scichart:DateTimeAxis x:Name="GraphXAxis"
                                           VisibleRange="{Binding ItsTimeVisibleRange, Mode=TwoWay}" />
                </scichart:SciChartSurface.XAxis>

                <scichart:SciChartSurface.YAxes>
                    <scichart:NumericAxis x:Name="GraphYAxis"
                                          VisibleRange="0, 10" />

                </scichart:SciChartSurface.YAxes>
 </scichart:SciChartSurface>
In ViewModel.cs
{
    private DateRange _timeVisibleRange;
    private ObservableCollection<IAnnotationViewModel> _annotations;
    private IAnnotationViewModel _boxAnnotation;
    public ObservableCollection<IAnnotationViewModel> ItsAnnotations
    {
        get
        {
            return _annotations;
        }
    }
    public DateRange ItsTimeVisibleRange
    {
        get { return _timeVisibleRange; }
        set
        {
            if (_timeVisibleRange == value) return;
            _timeVisibleRange = value;
            RaisePropertyChanged(() => ItsTimeVisibleRange);
        }
    }
    .
    .
    .
    _boxAnnotation = new BoxAnnotationViewModel()
        {
            IsEditable = true,
            DragDirections = SciChart.Charting.XyDirection.XDirection,
            X1 = DateTime.UtcNow.AddSeconds(300),
            X2 = DateTime.UtcNow,
            Y1 = 0,
            Y2 = 8,
            StyleKey = "_boxAnnotationStyle"
        };

     _annotations = new ObservableCollection<IAnnotationViewModel>() { };
     _annotations.Add(_boxAnnotation );

     _captureTimeRangeSelectorAnnotation.DragDelta += OnDrag;
     _captureTimeRangeSelectorAnnotation.DragEnded += DragEnded;
       .
       .
       .
    private void DragEnded(object sender, EventArgs e)
    {
         var boxAnnotationModel = sender as BoxAnnotationViewModel;
          // Need to know the DateTime value of X1 and X2
    }
    private void OnDrag(object sender, AnnotationDragDeltaEventArgs e)
    {
         var boxAnnotationModel = sender as BoxAnnotationViewModel;
         // Need to know the DateTime value of X1 and X2
    }
    .....
    .....
}
- Habibur Rahman asked 1 year ago
- last active 1 year ago
Hello support team,
We have to realize the following request:
– Yt chart with DateTime as X-axis and double values on the Y-axis
– The chart should display a user-defined area on startup (e.g. 20 sec) After the chart has run for 20 seconds ( i.e. 20 seconds), the animated scrolling should start. By default, the chart behaves as follows: The X-axis area fills up to 20 seconds and then starts scrolling. We want the chart to display 20 seconds on the X-axis at the start and fill up.
I am aware that I can implement this behavior myself. However, the question arises whether I can realize this directly with a basic functionality.
Thank you!
- Andreas Köhler asked 6 years ago
- last active 6 years ago
I saw in tips and tricks for performance the use of
scichartsurface.suspendupdate
before something is added to the dataseries. But usually I don’t have access in ViewModel to surface. How can I suspendupdate in the ViewModel when updating the series?
Is dataseries.SuspendUpdate used for this?
- Uwe Hafner asked 9 years ago
- last active 9 years ago
I need the length of the plot area in pixels. I don’t have access to SciChartSurface and it’s XAxis field. I have only ObservableCollection and my NumericAxisViewModel. Is it possible to get the length from them? Or what is the best way to get it in my case?
- Alexander Erkabaev asked 6 years ago
- last active 6 years ago
Hi,
I am having a problem with two SciChartSurface’s sharing the same ViewModel instance. I am using the Master-Detail View pattern to provide a list of charts (Collection of SciChart surfaces) with continuously updating data from a device) within a Listbox container on the left-hand side. On the right-hand side I provide the current selected chart with extended size and some extra controls.
The visual appearance of the SciChartSurface (shared across both sides) is defined via data template
<Window.Resources>
    <local:WorkspaceViewModel x:Key="WorkspaceViewModel" />
    <DataTemplate x:Key="ChartDataTemplate">
        <Border MinHeight="200">
            <visuals:SciChartSurface DebugWhyDoesntSciChartRender="True"
                                     visuals:ThemeManager.Theme="BrightSpark"
                                     SeriesSource="{Binding ., Mode=TwoWay}">
                <visuals:SciChartSurface.XAxis>
                    <visuals:NumericAxis VisibleRange="0.0, 10.0"
                                         AutoRange="Always" />
                </visuals:SciChartSurface.XAxis>

                <visuals:SciChartSurface.YAxis>
                    <visuals:NumericAxis VisibleRange="-1.0, 1.0"
                                         AxisAlignment="Left"
                                         AutoRange="Always" />
                </visuals:SciChartSurface.YAxis>
                <visuals:SciChartSurface.ChartModifier>
                    <visuals:SeriesValueModifier ReceiveHandledEvents="True"></visuals:SeriesValueModifier>
                </visuals:SciChartSurface.ChartModifier>
            </visuals:SciChartSurface>
        </Border>
    </DataTemplate>
</Window.Resources>
and is used within the ListBox and ContentControl in the following way
<Grid DataContext="{StaticResource WorkspaceViewModel}">
    <Grid.ColumnDefinitions>
        <ColumnDefinition Width="200*"
                          MinWidth="225"
                          MaxWidth="700" />
        <ColumnDefinition Width="Auto" />
        <ColumnDefinition Width="375*" />
    </Grid.ColumnDefinitions>

    <GroupBox Grid.Column="0">
        <ListBox x:Name="ListBox"
            SelectedItem="{Binding SelectedChart}"
                 HorizontalAlignment="Stretch"
                 VerticalAlignment="Stretch"
                 ItemsSource="{Binding Charts}"
                 HorizontalContentAlignment="Stretch"
                 ItemTemplate="{StaticResource ChartDataTemplate}" />
    </GroupBox>
    <GridSplitter Grid.Column="1"
                  Width="5"
                  HorizontalAlignment="Right"
                  VerticalAlignment="Stretch"
                  ResizeBehavior="PreviousAndNext" />
    <GroupBox Grid.Column="2">
        <ContentControl x:Name="ContentControl"
            Content="{Binding SelectedChart}"
                        ContentTemplate="{StaticResource ChartDataTemplate}" />
    </GroupBox>
</Grid>
The ViewModel (WorkspaceViewModel) contains two properties:
ObservableCollection<ObservableCollection<IChartSeriesViewModel>> Charts
public ObservableCollection<IChartSeriesViewModel> SelectedChart
So far, so good. Once populated with live chart data, the ListBox displays all charts with live updating of the DataSeries. The issue I encounter is that once a chart in the ListBox is selected, the Detail View gets updated and continues displaying live data updates, but the ListBox entry stops updating. Obviously the sharing of the same instance of IChartSeriesViewModel in two different SciChartSurface views (via the ViewModel property SelectedChart) is causing trouble.
What am I missing here? I am currently using SciChart 3.0.
Many thanks,
Silvio
- swiedric asked 10 years ago
- last active 10 years ago
I’ve been moving a project over to using MVVM, but I’ve found the IsStaticAxis option I was using in the NumericAxis doesn’t exist in the NumericAxisViewModel. Is it not possible to make the axis static with the View Models?
- Kevin Seiden asked 6 years ago
We’re using ReactiveUI and bindings in code-behind. We’re now upgrading from SciChart v3 to v6 and we’re wondering how to use the SeriesBinding in code-behind like this:
public partial class BarChartView : ReactiveUserControl<sBarChartViewModel>
{
    public BarChartView()
    {
        InitializeComponent();

        this.WhenActivated(disposable =>
        {
            this.OneWayBind(ViewModel,
                            vm => vm.SeriesSource,
                            view => view.BarChart.SeriesSource)
                .DisposeWith(disposable);

            this.OneWayBind(ViewModel,
                            vm => vm.LabelProvider,
                            view => view.FaciesAxis.LabelProvider)
                .DisposeWith(disposable);

            this.OneWayBind(ViewModel,
                            vm => vm.TooltipDataContext,
                            view => view.TooltipModifier.TooltipLabelDataContextSelector)
                .DisposeWith(disposable);

            this.OneWayBind(ViewModel,
                            vm => vm.XAxisRange,
                            view => view.FaciesAxis.VisibleRange)
                .DisposeWith(disposable);
        });
    }
}
Now the IChartSeriesViewModel and SciChartSurface.SeriesSource is deprecated so we have to move to IRenderableSeriesViewModel instead and then bind to SciChartSurface.RenderableSeries. But how can we convert from IRenderableSeriesViewModel to IRenderableSeries here?
- Tore Munch asked 3 years ago
- last active 2 years ago
Hi,
I’m evaluating SciChart. Our app requires that series and axes be dynamically added to the chart. So, I kind of followed the “Create Stock Charts Realtime Ticking Stock Charts” example to use the SeriesSource. The Append() method is used to add a data point in a worker thread. The total number of data point is just 10 and each data point arrives at about every second.
I saw that the line was not drawn until the last data point was added. The line chart was exactly what I expected. So, everything (SeriesSouce, axes, series, renderable series, bindings) seems to be working except that the line was not drawn real time. I added ViewportManager.InvalidateElement() right after the Append() method. But, the result was the same. I didn’t do anything special when the last data point arrived. So, I’m not sure why SciChart was able to show the line chart at the end.
Am I missing anything here?
Best Regards,
- Tetsu Shimizu asked 9 years ago
Hi, Support team.
I’m using MVVM pattern and trying to implement multi-chart which can insert Box Annotations at the same time into each chart .
So I’m testing in SciChart Example [“DigitalAnalyzerPerformanceDemo”] to know how to implement this.
But what i only got is just looping through and create annotation for each ChannelViewModels.
In the Demo, the VisibleRange ‘XRange’ is shared to all the ChannelViewModels by binding TwoWay-mode in ParentViewModel without looping for each ChildViewModels.
Like this, I wonder is there ways to apply BoxAnnotation all the ChannelViewModel at the same time by binding in ParentViewModel.
    <!-- BottomAxis -->
        <s:SciChartSurface Grid.Column="1">
            <s:SciChartSurface.XAxis>
                <s:NumericAxis Height="30"
                               AxisAlignment="Bottom"
                               VisibleRange="{Binding XRange, Mode=TwoWay}"
                               LabelProvider="{StaticResource TimeLabelProvider}"
                               MajorTickLineStyle="{StaticResource TimeAxisMajorTickLineStyle}"
                               MinorTickLineStyle="{StaticResource TimeAxisMinorTickLineStyle}"/>
            </s:SciChartSurface.XAxis>
            <s:SciChartSurface.YAxis>
                <s:NumericAxis Visibility="Collapsed"/>
            </s:SciChartSurface.YAxis>
        </s:SciChartSurface>
    </Grid>

    <!--  Create an X Axis with GrowBy  -->
     <s:SciChartSurface.XAxis>
           <s:NumericAxis Style="{StaticResource HiddenAxisStyle}"
                    VisibleRangeLimitMode="Min"
                    VisibleRangeLimit="0,0"
                    VisibleRange="{Binding DataContext.XRange, Mode=TwoWay, RelativeSource={RelativeSource AncestorType=ItemsControl, AncestorLevel=2}}"/>
     </s:SciChartSurface.XAxis>
I tried to bind annotation in ParentViewModel like XRange Binding method, But it doesn’t work.
This is View.xaml.
<Grid Grid.IsSharedSizeScope="True" IsEnabled="{Binding IsLoading, Converter={StaticResource InvertBooleanConverter}}">


    <!-- BottomAxis -->
        <s:SciChartSurface Grid.Column="1">
            <s:SciChartSurface.XAxis>
                <s:NumericAxis Height="30"
                               AxisAlignment="Bottom"
                               VisibleRange="{Binding XRange, Mode=TwoWay}"
                               LabelProvider="{StaticResource TimeLabelProvider}"
                               MajorTickLineStyle="{StaticResource TimeAxisMajorTickLineStyle}"
                               MinorTickLineStyle="{StaticResource TimeAxisMinorTickLineStyle}"/>
            </s:SciChartSurface.XAxis>
            <s:SciChartSurface.YAxis>
                <s:NumericAxis Visibility="Collapsed"/>
            </s:SciChartSurface.YAxis>
        </s:SciChartSurface>
    </Grid>

    <!-- Channels -->
        <ScrollViewer Background="#1C1C1E"
                      VerticalScrollBarVisibility="Auto"
                      HorizontalScrollBarVisibility="Disabled">

            <b:Interaction.Behaviors>
                <common:DigitalAnalyzerScrollBehavior ChannelHeightDelta="10" ChangeChannelHeightCommand="{Binding ChangeChannelHeightCommand}"/>
            </b:Interaction.Behaviors>

            <ItemsControl x:Name="chartItemsControl" ItemsSource="{Binding ChannelViewModels}">

                <b:Interaction.Behaviors>
                    <common:FocusedChannelScrollBehavior ScrollToFocusedChannel="False"/>
                </b:Interaction.Behaviors>

                <ItemsControl.ItemTemplate>
                    <DataTemplate DataType="{x:Type local:ChannelViewModel}">
                        <Grid Background="#2D2C32" Height="{Binding ChannelHeight, Mode=OneWay}" Focusable="False" UseLayoutRounding="False" >
                            <Grid.ColumnDefinitions>
                                <ColumnDefinition SharedSizeGroup="ChannelNames" />
                                <ColumnDefinition />
                            </Grid.ColumnDefinitions>

                            <Border BorderThickness="0,0,0,1" BorderBrush="#1C1C1E">
                                <DockPanel>
                                    <Border DockPanel.Dock="Left"
                                            Background="{Binding ChannelColor, Mode=OneWay}"
                                            Width="5"/>

                                    <TextBlock DockPanel.Dock="Left"
                                               Margin="10,5"
                                               VerticalAlignment="Center"
                                               Foreground="White"
                                               Text="{Binding ChannelName}"/>
                                </DockPanel>
                            </Border>

                            <s:SciChartSurface x:Name="channelSurface" Grid.Column="1"
                                               RenderableSeries="{Binding RenderableSeries}"
                                               Annotations="{s:AnnotationsBinding  DataContext.Annotations, Mode=TwoWay, RelativeSource={RelativeSource AncestorType=ItemsControl, AncestorLevel=2} }">

                                <!--  Create an X Axis with GrowBy  -->
                                <s:SciChartSurface.XAxis>
                                    <s:NumericAxis Style="{StaticResource HiddenAxisStyle}"
                                                   VisibleRangeLimitMode="Min"
                                                   VisibleRangeLimit="0,0"
                                                   VisibleRange="{Binding DataContext.XRange, Mode=TwoWay, RelativeSource={RelativeSource AncestorType=ItemsControl, AncestorLevel=2}}"/>
                                </s:SciChartSurface.XAxis>

                                <!--  Create a Y Axis with GrowBy. Optional bands give a cool look and feel for minimal performance impact  -->
                                <s:SciChartSurface.YAxis>
                                    <s:NumericAxis Style="{StaticResource HiddenAxisStyle}"
                                                   VisibleRange="{Binding YRange, Mode=OneWay}"/>
                                </s:SciChartSurface.YAxis>

                                <s:SciChartSurface.ChartModifier>
                                    <s:ModifierGroup s:MouseManager.MouseEventGroup="ChannelModifierGroup">
                                        <s:RubberBandXyZoomModifier IsAnimated="False" IsXAxisOnly="True" ZoomExtentsY="False" ReceiveHandledEvents="True" IsEnabled="{Binding IsChecked, Mode=OneWay, ElementName=IsZoomEnabled}"/>
                                        <s:ZoomPanModifier ZoomExtentsY="False" XyDirection="XDirection" IsEnabled="{Binding IsChecked, Mode=OneWay, ElementName=IsPanEnabled}"/>
                                        <s:ZoomExtentsModifier XyDirection="XDirection" IsAnimated="False" />
                                        <s:MouseWheelZoomModifier XyDirection="XDirection" />
                                    </s:ModifierGroup>
                                </s:SciChartSurface.ChartModifier>
                            </s:SciChartSurface>

                            <Border Grid.Column="1"
                                    BorderThickness="0,0,0,1"
                                    BorderBrush="#2D2C32"
                                    VerticalAlignment="Bottom"/>
                        </Grid>
                    </DataTemplate>
                </ItemsControl.ItemTemplate>
            </ItemsControl>
        </ScrollViewer>
    </Border>


</Grid>
This is ViewModel.cs
public class DigitalAnalyzerExampleViewModel : BaseViewModel
{
    private bool _isLoading;
    private DoubleRange _xRange;

    public DigitalAnalyzerExampleViewModel()
    {
        ChannelViewModels = new ObservableCollection<ChannelViewModel>();
        Annotations = new ObservableCollection<IAnnotationViewModel>();
        Annotations.Add(new BoxAnnotationViewModel() { X1 = 0, X2 = 1000, Y1 = 0, Y2 = 1 }); //I want to implement sharing annotation like this.

        SelectedChannelType = "Digital";
        SelectedChannelCount = 32;
        SelectedPointCount = 1000000;
        SelectedResamplingPrecision =ResamplingPrecision.Default;
        SelectedStrokeThickness = 1;

        ChangeChannelHeightCommand = new ActionCommand<object>((d) =>
        {
            var delta = (double)d;
            foreach (var channelViewModel in ChannelViewModels)
            {
                channelViewModel.SetChannelHeightDelta(delta);
            }
        });

        AddChannelCommand = new ActionCommand(async () =>
        {
            IsLoading = true;

            var isDigital = SelectedChannelType == "Digital";
            await AddChannels(isDigital ? 1 : 0, isDigital ? 0 : 1);

            IsLoading = false;
        });

        LoadChannelsCommand = new ActionCommand(async () =>
        {
            IsLoading = true;

            // Clear ViewModels
            foreach (var channelVm in ChannelViewModels)
            {
                channelVm.Clear();
            }
            ChannelViewModels.Clear();
            XRange = null;

            // Create a bunch of Digital channels
            await AddChannels(SelectedChannelCount, 0);

            XRange = new DoubleRange(0, SelectedPointCount);
            IsLoading = false;
        });

        LoadChannelsCommand.Execute(null);
    }


    public ObservableCollection<ChannelViewModel> ChannelViewModels { get; private set; }
    public ObservableCollection<IAnnotationViewModel> Annotations { get; private set; }

    public string SelectedChannelType { get; set; }


    public ResamplingPrecision SelectedResamplingPrecision { get; set; }

    public int SelectedChannelCount { get; set; }

    public ActionCommand<object> ChangeChannelHeightCommand { get; }

    public ActionCommand AddChannelCommand { get; }

    public ActionCommand LoadChannelsCommand { get; }

    public long TotalPoints => ChannelViewModels.Sum(c => (long)c.DataCount);

    public bool IsLoading
    {
        get => _isLoading;
        set
        {
            _isLoading = value;
            OnPropertyChanged(nameof(IsLoading));
        }
    }

    public bool IsEmpty => ChannelViewModels.Count <= 0;

    public DoubleRange XRange
    {
        get => _xRange;
        set
        {
            _xRange = value;
            OnPropertyChanged(nameof(XRange));
        }
    }
}
+Attached image below is what i want to implement.
++I also attached tried code in .zip .
- Hyunji Jeon asked 2 years ago
- last active 2 years ago
Hello!
I am trying to programmatically set a range for HeatmapColorPalette and attached HeatmapColorMap to min and max of my data.
Binding HeatmapColorPalette.Maximum to a property in my View Model works well. However, when I add HeatmapColorMap everything breaks, the heat map no longer responds to changes in View Model.
What am I doing wrong?
Here is my View:
<Window x:Class="SciChartHeatMap.MainWindow"
    xmlns="http://schemas.microsoft.com/winfx/2006/xaml/presentation"
    xmlns:x="http://schemas.microsoft.com/winfx/2006/xaml"
    xmlns:d="http://schemas.microsoft.com/expression/blend/2008"
    xmlns:mc="http://schemas.openxmlformats.org/markup-compatibility/2006"
    xmlns:local="clr-namespace:SciChartHeatMap"
    xmlns:s="http://schemas.abtsoftware.co.uk/scichart"
    d:DataContext="{d:DesignInstance Type=local:HeatMapViewModel, IsDesignTimeCreatable=True}"
    mc:Ignorable="d"
    Title="MainWindow" Height="450" Width="800">
<Grid>
    <Grid.Resources>
        <s:GradientStopsToLinearGradientBrushConverter x:Key="ColorsToLinearGradientBrushConverter"/>
    </Grid.Resources>
    <Grid.ColumnDefinitions>
        <ColumnDefinition/>
        <ColumnDefinition Width="Auto"/>
        <ColumnDefinition Width="Auto"/>
    </Grid.ColumnDefinitions>
    <Grid.RowDefinitions>
        <RowDefinition Height="Auto"/>
        <RowDefinition/>
    </Grid.RowDefinitions>
    <s:SciChartSurface Grid.Row="0" Grid.RowSpan="2">
        <s:SciChartSurface.RenderableSeries>
        <s:FastUniformHeatmapRenderableSeries x:Name="HeatMapSeries" DataSeries="{Binding Data}" Opacity="0.9">
            <s:FastUniformHeatmapRenderableSeries.ColorMap>
                <s:HeatmapColorPalette Maximum="{Binding ColorMaximum}">
                    <s:HeatmapColorPalette.GradientStops>
                        <GradientStop Offset="0" Color="DarkBlue"/>
                        <GradientStop Offset="0.2" Color="CornflowerBlue"/>
                        <GradientStop Offset="0.4" Color="DarkGreen"/>
                        <GradientStop Offset="0.6" Color="Chartreuse"/>
                        <GradientStop Offset="0.8" Color="Yellow"/>
                        <GradientStop Offset="1" Color="Red"/>
                    </s:HeatmapColorPalette.GradientStops>
                </s:HeatmapColorPalette>
            </s:FastUniformHeatmapRenderableSeries.ColorMap>
        </s:FastUniformHeatmapRenderableSeries>
        </s:SciChartSurface.RenderableSeries>
        <s:SciChartSurface.XAxis>
            <s:NumericAxis
                FlipCoordinates="False"
                ScientificNotation="None"
                AutoTicks="False"
                MajorDelta="1"
                MinorDelta="0.5"
                AxisAlignment="Top"/>
        </s:SciChartSurface.XAxis>
        <s:SciChartSurface.YAxis>
            <s:NumericAxis
                FlipCoordinates="True"
                ScientificNotation="None"
                AxisAlignment="Left"/>
        </s:SciChartSurface.YAxis>
    </s:SciChartSurface>

    <!-- Enabling this will break the program
    <s:HeatmapColorMap
        Grid.Column="1"
        Grid.Row="0"
        Grid.RowSpan="2"
        Margin="5,0,5,0"
        HorizontalAlignment="Right"
        VerticalAlignment="Stretch"
        DataContext="{Binding Source={x:Reference Name=HeatMapSeries}, Mode=OneWay}"
        ColorMap="{Binding ColorMap.GradientStops, Converter={StaticResource ColorsToLinearGradientBrushConverter}}"
        Maximum="{Binding ColorMap.Maximum}"
        Orientation="Vertical">
    </s:HeatmapColorMap>
    -->

    <Label
        Grid.Row="0"
        Grid.Column="2"
        Content="{Binding ColorMaximum}"
        Width="50"
        HorizontalContentAlignment="Center"/>
    <Slider
        Grid.Column="2"
        Grid.Row="1"
        Orientation="Vertical"
        Minimum="0"
        Maximum="10"
        HorizontalAlignment="Center"
        Value="{Binding ColorMaximum}"/>
</Grid>
The idea in this small example is for slider to control both HeatmapColorPalette.Maximum and s:HeatmapColorMap.Maximum
The code in my View Model is pretty simple:
private double mColorMax;

public double ColorMaximum
    {
        get => mColorMax;

        set
        {
            mColorMax = value;
            OnPropertyChanged();
        }
    }
My View Model implements INotifyPropertyChanged
I will appreciate any suggestions.
Thank you in advance!
- Alexander Gdalevich asked 5 years ago
- last active 5 years ago
Hi,
I have several chart panes that share a mouse group and a shared visual range (I inject the shared visual range of type IRange in the constructor of the pane view model). I then set the XAxis visual range to the shared visual range inside each pane view model. However, when I use either of the below approaches outside of the pane view model to adjust the min and max of shared visual range, the Xaxis.VisualRange of each pane does not reflect that change.
Approach A: _sharedVisualRange.Min = ….; _sharedVisualRange.Max = …
Approach B: _sharedVisualRange.SetMinMax(….)
Neither approach actually impacts the XAxis.VisualRange.Min/Max.
Initially when I created the XAxis in code I set its VisualRange equal to the shared visual range that was injected via constructor, like :
XAxis = new CategoryDateTimeAxis()
{
……
……
VisualRange = _sharedVisualRange,
…..
};
Please note that all the above refers to code in the view model. I bind the XAxis in the pane view model to the XAxis of the surface in xaml.
My entire synchronization heavily relies on the assumption of this working, but it does not.
- bbmat asked 6 years ago
- last active 6 years ago
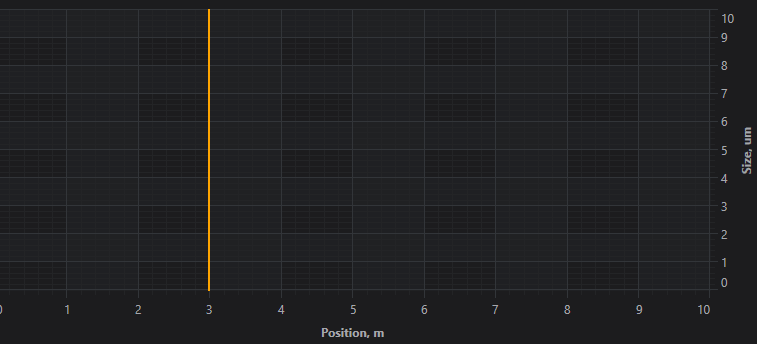
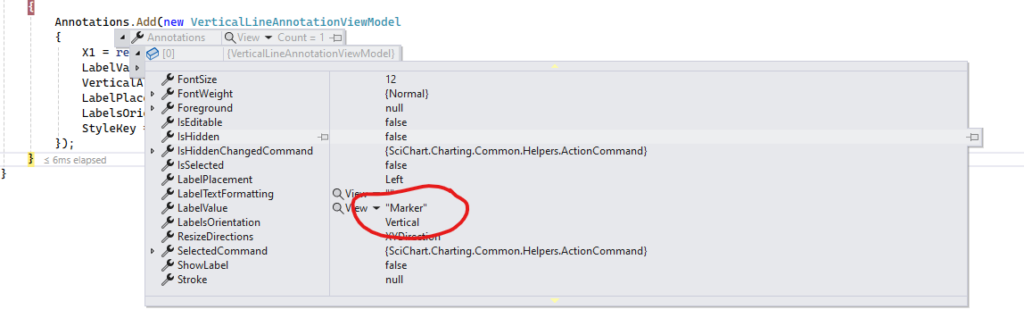
Hello,
I have this
private readonly string CHART_MARKER_TEXT = "Marker";
private readonly string CHART_MARKER_STYLE = "VerticalLineAnnotationStyle"; // defined in Chart.xaml

    AddVerticalLineAnnotation(new AnnotationRequest() { XValue = 3, LabelText = CHART_MARKER_TEXT, AnnotationStyle = CHART_MARKER_STYLE });

private void AddVerticalLineAnnotation(AnnotationRequest request)
{
    Annotations.Add(new VerticalLineAnnotationViewModel
    {
        X1 = request.XValue,
        LabelValue = !string.IsNullOrEmpty(request.LabelText) ? request.LabelText : null,
        VerticalAlignment = VerticalAlignment.Stretch,
        LabelPlacement = LabelPlacement.Left,
        LabelsOrientation = System.Windows.Controls.Orientation.Vertical,
        StyleKey = request.AnnotationStyle,
    });
}
And this
<Style x:Key="VerticalLineAnnotationStyle" TargetType="{x:Type s:VerticalLineAnnotation}">
    <Setter Property="Stroke" Value="Orange" />
    <Setter Property="StrokeThickness" Value="2" />
    <Setter Property="FontSize" Value="12" />
    <Setter Property="FontWeight" Value="Bold" />
</Style>
Why I can’t see Label?
- Fedor Iudin asked 3 months ago
- last active 3 months ago
Hello, SciChart Team!
i have an issue using mouse drag event ( RubberBandXyZoomModifier, ZoomPanMidifier). the message says “NullReferenceException in SciChart.Charting.dll ” or “Thread.cs not found” from time to time.
after some experiments i figured out that the app starts to crush after i change XAxis type .
i have a simple mvvm user control used to display both arrays of double and datebound data, XAxes of SciChart Surfase is bound to an observable collection of IAxis elements. if i need to change chart type i clear this collection and create an axis of desired type (DateTimeAxisViewModel or NumericAxisViewModel). after that the series can be added, but zooming causes crash with nearly to no info.
i attached a solution, which lacks only scichart dlls in order to run (hopefully), Window_Loaded method has a commented line which changes chart type and makes app crush on zooming, would be nice if you checked it out.
Thanks in advance!
Alexander
- Alexander Volkov asked 6 years ago
- last active 6 years ago
Hello support team.
I have a question about the resampling modes and their behavior.
I have a LineRenderableSeries with the resampling mode.mid. Therefore, depending on the zoom level and available pixels of the display screen, the information of the min and max values are lost. I had the idea to create a second LineRenderableSeries with the Opacity 0.5 and the ResamplingMode.Min Max. Thus I have behind the main line with the resampling mode.mid a “cloud” with the MinMax info. This allows the user to see this information as well. However, I would deactivate this cloud if it is not necessary due to the zoom level and the pixels.
How can I request this from SciChartControl? Or does it make more sense to use a different functionality?
I use the Mvvm classes LineRenderableSeriesViewModel, and XyDataSeries.
Thank you very much!
- Andreas Köhler asked 6 years ago
- last active 6 years ago
Hi,
I’m looking to draw a BoxAnnotation onto a SciChartGroup ItemTemplate SciStockChart where the user will left mouse click, drag to define the size and releases to create the BoxAnnotation.
How should I go about doing this? Should I be looking at CustomModifiers or CustomAnnotations?
Any pointers will be very helpful
Thanks
David
- David T asked 9 years ago
Hello Scichart Team,
Can you guys provide me with some guidance to implement a custom IRenderableSeriesViewModel implementation that is supported in MVVM binding in Scichartsurface? Specifically, I’m looking to create a chart series that can be bound to my ViewModel and support custom styling and data handling.
I have tried following the tutorial found here…
Worked Example – CustomRenderableSeries in MVVM
https://www.scichart.com/documentation/win/current/webframe.html#Worked%20Example%20-%20CustomRenderableSeries%20in%20MVVM.html
I was getting a cast error from scicharts. I have attached the picture showing the detailed error.
Concerning the XAML code I have tried both the normal Binding keyword and s:SeriesBinding keyword to the RenderableSeries in the SciChartSurface.
Let me know how to go about this!
- Arjun Sivaprasadam asked 1 year ago
- last active 1 year ago
I think this is a pretty simple question but i am not sure what i am missing.I have a toggle button on my legend that is intended to allow the users to select all the series or deselect all the series.
the button essentially goes through the Renderable series view models and set the IsSelected to either true or false, this approach however, doesn’t work. I looked at the SelectionModifier and i can see that has a protected DeselectAll method and i am thinking to leverage that to solve this use case.
what is the best solution to accomplish this? isn’t this functionality something that perhaps be standard and could just be turned on?
- Joseph McClean asked 6 years ago
- last active 6 years ago
Hello,
I’m currently rewriting a program in .net7 WPF using MVVM as much as possible.
In my MainViewModel:
I read data from a CSV file and transforming it into an ObservableCollection of LineRenderableSeriesViewModel (stored in the « RenderableSeriesViewModels » variable) . Additionally, the Y axes are transformed into ObservableCollection of IAxisViewModel (within the « Yaxes » variable).
Each series corresponds to a LineRenderableSeriesViewModel and each Y axis is represented as a NumericAxisViewModel. The X-axis is a DateTime common to all series and is declared only in XAML.
Within my view’s XAML:
I declare RenderableSeries=”{s:SeriesBinding RenderableSeriesViewModels}” and YAxes=”{s:AxesBinding YAxes}. I’ve defined a legend template to add several elements:
– DataContext=”{Binding RenderableSeries}”
– A checkbox to toggle serie visibility (IsVisible binding).
– A checkbox to toggle Y-axis visibility for the serie (YAxis.Visibility binding).
– A color picker to change the color of a serie, bound to “Stroke”, “YAxis.TickTextBrush”, and “YAxis.BorderBrush”
– A slider for adjusting serie thickness (StrokeThickness binding).
Results:
Each element acts on the graph as expected: RenderableSeries updates and the graph refreshes correctly.
In the MainViewModel, RenderableSeriesViewModels and YAxes are not updated for all elements:
– “IsVisible” and “StrokeThickness” for the concerned series are instantly modified in RenderableSeriesViewModels but “Stroke” is not.
– “YAxes” is not updated.
The code for the LegendTemplate and a screenshot of the resulting legend are in the attachements.
Could you please help me to understand what I do wrong?
- Nicolas MARTINEZ asked 7 months ago
- last active 5 months ago
Hi,
I’m creating a CustomChartModifier which I am able to hook to a SciStockChart (a template item in a SciChartGroup MVVM) and now I’m having difficulties in adding the BoxAnnotation to the Chart.
This is the code I’m using in my ChartModifier and placing a breakpoint shows me that indeed the code runs through this method, however, I do not see any BoxAnnotation on my chart? I’ve even tried adding the Height and Width properties without any further success. Other CustomModifiers to draw Lines and Ellipses works without problems. Do BoxAnnotations work differently?
I’m looking to have the the user be able to draw a BoxAnnotation on the chart, free hand / dynamically.
SimpleBoxAnnotationModifier.cs
public override void OnModifierMouseDown(ModifierMouseArgs e)
{
        base.OnModifierMouseDown(e);

        var resources = new AnnotationStyles();
        // x:Key="BoxAnnotationStyle" TargetType="s:BoxAnnotation"
        var style = (Style)resources["BoxAnnotationStyle"];

        _annotationCreation = new AnnotationCreationModifier () { AnnotationType = typeof(BoxAnnotation), AnnotationStyle = style };

        this.ModifierSurface.Children.Add(_annotationCreation);
}
AnnotationStyles.xaml
<ResourceDictionary xmlns="http://schemas.microsoft.com/winfx/2006/xaml/presentation"
                xmlns:x="http://schemas.microsoft.com/winfx/2006/xaml"
                xmlns:s="http://schemas.abtsoftware.co.uk/scichart"
                x:Class="ChartModifierBinding.AnnotationStyles">

<Style x:Key="BoxAnnotationStyle" TargetType="s:BoxAnnotation">
    <Setter Property="BorderBrush" Value="#279B27"/>
    <Setter Property="Background" Value="#551964FF"/>
    <Setter Property="BorderThickness" Value="1"/>
    <Setter Property="IsEditable" Value="True"/>
</Style>
Thanks for any pointers or tips!
- David T asked 9 years ago
- last active 8 years ago
I’m trying to create a CustomRenderableSeries in MVVM. I’ve got my custom renderable series working fine outside of MVVM, and it seems pretty simple to wrap it with a ViewModel using the API.
However, the series isn’t displaying (Draw not getting called, and ranges not changing, so it’s not just failing to draw anything).
It’s pretty simple (and I’m going to add caching for the pens and brushes later):
public class CustomXyScatterRenderableSeriesViewModel : BaseRenderableSeriesViewModel
{
    // Tell SciChart what type of RenderableSeries you want to instantiate
    public override Type RenderSeriesType
    {
        get { return typeof(CustomXyScatterRenderableSeries); }
    }
}


public sealed class CustomXyScatterRenderableSeries : CustomRenderableSeries
{
    protected override void Draw(IRenderContext2D renderContext, IRenderPassData renderPassData)
    {
        XyzPointSeries pointSeries = renderPassData.PointSeries as XyzPointSeries;

        // PointMarkers are created once and cached
        var pointMarker = this.GetPointMarker();

        //if (pointMarker == null)
        //    return;

        int setCount = pointSeries.Count;

        IBrush2D brush = renderContext.CreateBrush(Brushes.Red, 0.5);
        IPen2D pen = renderContext.CreatePen(Colors.Transparent, false, 0, 0);
        // Iterate over points collection and render point markers
        for (int i = 0; i < setCount; i++)
        {
            double xPoint = (double)pointSeries.XValues[i];//pointSeries[i].X;
            double yPoint = (double)pointSeries.YValues[i];//pointSeries[i].Y;
            double zPoint = (int)pointSeries.ZPoints[i];

            // Get coordinates for X,Y data values
            var x1 = (int)renderPassData.XCoordinateCalculator.GetCoordinate(xPoint);
            var y1 = (int)renderPassData.YCoordinateCalculator.GetCoordinate(yPoint);
            var z1 = (int)zPoint+2;

            //var pointMarkerRect = new Rect(0, 0, pointMarker.PixelWidth, pointMarker.PixelWidth);
            //double xOffset = pointMarkerRect.Width / 2;
            //double yOffset = pointMarkerRect.Height / 2;

            // Draw PointMarkers
            renderContext.DrawEllipse(pen, brush, new Point(x1, y1), z1 * 2, z1 * 2); //(new Rect(x1 - xOffset, y1 - yOffset, pointMarkerRect.Width, pointMarkerRect.Height), pointMarker, pointMarkerRect);
        }
        brush.Dispose();
        pen.Dispose();
    }
}
When directly, all is good:
<s:SciChartSurface x:Name="SciChartSurface"
                   DebugWhyDoesntSciChartRender="True"
                   GridLinesPanelStyle="{StaticResource GridLinesPanelStyle}"
                   DataContext="{Binding ElementName=userControl}"

                   ViewportManager="{Binding ViewportManager}"
                   ChartTitle="{Binding Title}">

    <s:SciChartSurface.RenderSurface>
        <s3D:Direct3D10RenderSurface />
    </s:SciChartSurface.RenderSurface>

    <s:SciChartSurface.RenderableSeries>
        <helpers:CustomXyScatterRenderableSeries DataSeries="{Binding Data}"  />
    </s:SciChartSurface.RenderableSeries>

    <s:SciChartSurface.XAxis>
        <s:NumericAxis AxisTitle="{Binding XAxisLabel}" LabelProvider="{StaticResource SINumericLabelProvider}"/>
    </s:SciChartSurface.XAxis>
    <s:SciChartSurface.YAxis>
        <s:NumericAxis AxisTitle="{Binding YAxisLabel}" LabelProvider="{StaticResource SINumericLabelProvider}"/>
    </s:SciChartSurface.YAxis>
    <s:SciChartSurface.ChartModifier>
        <s:ModifierGroup>
            <s:MouseWheelZoomModifier x:Name="mouseWheelZoomModifier" />
            <s:RubberBandXyZoomModifier ExecuteOn="MouseRightButton" IsAnimated="True" />
            <s:ZoomPanModifier />
            <s:ZoomExtentsModifier ExecuteOn="MouseDoubleClick" />
        </s:ModifierGroup>
    </s:SciChartSurface.ChartModifier>
</s:SciChartSurface>
But when using the View Model, it fails to display:
<s:SciChartSurface x:Name="SciChartSurface"
                   DebugWhyDoesntSciChartRender="True"
                   GridLinesPanelStyle="{StaticResource GridLinesPanelStyle}"
                   DataContext="{Binding ElementName=userControl}"

                   ViewportManager="{Binding ViewportManager}"
                   ChartTitle="{Binding Title}"
                   RenderableSeries="{s:SeriesBinding Series}">

    <s:SciChartSurface.RenderSurface>
        <s3D:Direct3D10RenderSurface />
    </s:SciChartSurface.RenderSurface>

    ....
</s:SciChartSurface>
I’m not sure what I’m doing wrong, as there doesn’t seem to be much more to it!
Edit: More info, in the code behind, I’m binding to this data for testing:
    public XyzDataSeries<float, float, int> Data { get; set; }
    public ObservableCollection<IRenderableSeriesViewModel> Series { get; set; }

    public LineChart()
    {
        this.DataContext = this;
        Data = new XyzDataSeries<float, float, int>();
        Data.Append(50, 50, 10);
        Data.Append(100, 100, 15);
        Series = new ObservableCollection<IRenderableSeriesViewModel>();
        Series.Add(new CustomXyScatterRenderableSeriesViewModel() { DataSeries = Data });

        InitializeComponent();
    }
- Ken Hobbs asked 8 years ago
- last active 8 years ago
Hi there,
I am relatively new to C# and scicharts so you will have to forgive me a little.
In the project I am working on, I am trying to add dynamic renderable series as the user selects items in a tree. I have looked through the online tutorials and forums but still am having trouble. I am creating my own renderable series view model class derived off of LineRenderableSeriesViewModel. I found documentation that I needed to override the ViewType property and set it to a FastLineRenderableSeriesForMvvm.
When I am creating these objects to add to the ObservableCollection which is bound to my scichart surface, I can set the PointMarker and its properties, but not the SelectedPointMarker properties.
XAML:
    <s:SciChartSurface Style="{StaticResource BasicSciChartSurfaceStyleRateVsTime}"
                       ViewportManager="{Binding RateVsTimePlot.Manipulator.Viewport}"
                       Name="RateVsTime" x:FieldModifier="private"
                       ZoomHistoryManager="{Binding RateVsTimePlot.ZoomHistory}"
                       PreviewMouseLeftButtonDown="PreviewRateVsTimeMouseLeftButtonDown"
                       PreviewMouseLeftButtonUp="PreviewRateVsTimeMouseLeftButtonUp"
                       RenderableSeries="{s:SeriesBinding RateVsTimePlot.RenderableSeriesViewModels}"
                       local:YAxesCollectionBehaviour.AxisSource="{Binding RateVsTimePlot.YAxesViewModels}"
                       local:YAxesCollectionBehaviour.AxisStyle="{StaticResource AxisStyle}"/>
Style:
<Style x:Key="ProdLineStyle" TargetType="s:FastLineRenderableSeriesForMvvm">
    <Setter Property="s:TooltipModifier.IncludeSeries" Value="False"/>
    <Setter Property="SelectedPointMarker">
        <Setter.Value>
            <s:EllipsePointMarker Fill="{Binding SeriesColors.ProductionColor}"
                                  Stroke="{Binding SeriesColors.ProductionColor}"
                                  Width="6" Height="6">
            </s:EllipsePointMarker>
        </Setter.Value>
     </Setter>
</Style>
ViewModel :
        var renderableSeries = new GenericRenderableSeriesViewModel
        {
            DataSeries = dataSeries.DataSeries,
            YAxisId = dataSeries.AxisId,
            IsSelected = IsSelected,
            SeriesColors = _dataColors[fluidRateType],
            DisplayEnabled = AnalysisInteractionMode.IsLineManipulationDisabled,
            PointMarker = new EllipsePointMarker(),
            StyleKey = "ProdLineStyle"
        };

        renderableSeries.SetRenderableSeriesColorSettings();

        renderableSeries.DataSeries.SeriesName = fluidRateType.ToString();
        return renderableSeries;

public void SetRenderableSeriesColorSettings()
    {
        Stroke = SeriesColors.ProductionColor;

        if (PointMarker == null) return;

        PointMarker.Stroke = SeriesColors.ProductionColor;
        PointMarker.Fill = SeriesColors.ProductionColor;
        PointMarker.Height = PointNonSelectedHeight;
        PointMarker.Width = PointNonSelectedWidth;
    }
When I run my app, I see what I am expecting by default, but when I do a point selection rectangle, the behavior is not correct. I only see the line. The points with in the rectangle disappear.
I am trying to move away from having the style set the selectedPointMarker, and doing it through code in the view model just like the function above as users will be able to change these properties in the future. But so far I haven’t found a way to do either.
Am I using the correct classes, or do I need to override something else? Any ideas or suggestions would be greatly appreciated
Thanks
Rylan
- Rylan Herndier asked 7 years ago
- last active 7 years ago
Hello,
how can i implement a vertically stacked y axis chart like in your example (WPF Chart Vertically Stacked YAxis) with MVVM and a varying number of y axes. Your example has a fixed number of y axes and the needed YAxesPanel is directly implemented in your xaml code. What is the best way to achieve the same result with a varying number of y axis?
Best regards
Alexander
- Alexander Lipp asked 5 years ago
- last active 5 years ago
Is there a way to apply functionalities on signals as in average, slope, etc. ?
Thank you
Anders
- Anders Persson asked 2 years ago
- last active 2 years ago
We keep getting asked What’s the best practice way to suspend the SciChartSurface in a multi-pane stock chart demo.
We have multiple ways of doing this.
- You can call SuspendUpdates on a DataSeries
- You can lock the parent surface SyncRoot etc…
- You can call SuspendUpdates on the SciChartSurface instance
By far the most effective and thread-safe way to do this is to call SuspendUpdates directly on the SciChartSurface. But how to do this in a ViewModel?
- Andrew Burnett-Thompson asked 9 years ago
- last active 9 years ago
I am directly editing my XyDataSeries on a chart by using my mouse. As the mouse moves I edit either the x or y value of a point using the methods
    public void SetPointYValueAt(IDataSeries series, int index, double newValue)
    {
        series.YValues[index] = newValue;
        series.InvalidateParentSurface(RangeMode.None);
    }

    public void SetPointXValueAt(IDataSeries series, int index, double newValue, double xMin, double xMax)
    {
        var xValue = newValue;

        // limit x values to keep them sorted
        if (xValue < xMin) xValue = xMin;
        if (xValue > xMax) xValue = xMax;
        series.XValues[index] = xValue;

        series.InvalidateParentSurface(RangeMode.None);
    }
With this code I am not getting an update at my ViewModel:
    public IDataSeries<double, double> MyDataSeries
    {
        get { return _myDataSeries; }
        set
        {
            _myDataSeries = value;
            OnPropertyChanged("MyDataSeries");
        }
    }
Here is my XAML:
<sciChartExtensions:StepLineRenderableSeries x:Name="HResitivitySeries" IsDigitalLine="True" DataSeries="{Binding MyDataSeries, Mode=TwoWay}">
Where StepLineRenderableSeries is derived from FastLineRenderableSeries with IsDigitalLine = true and the HitTest method overridden.
How can I get MyDataSeries to update?
- Stephen Painchaud asked 9 years ago
- last active 9 years ago
