Hello All,
Is there a way to have a cursor modifier display on a mouse left/center/right click instead of automatically showing when the mouse is over the chart? I tried setting the ExecuteOn property but had no effect.
Thanks in advance,
Sergio.
- Sergio Faura asked 12 months ago
- last active 12 months ago
Suppose I have an XYSeries dataset. For this example, Y is a temperature value in Celsius.
The XYSeries without modification I will call raw space. I assume that there is some matrix stack that transforms my “raw space” data series to screen space (the actual pixel on the screen).
Basic Point Transform assumption from my limited Graphics experience:
(Raw Space -> View Space (axis transforms etc) -> Culled Space (culled and interpolated points) -> Screen Space (positioned properly on the screen))
Now all is well if I am just running this graph in Celsius, but perhaps my user wants to change the Y axis to Fahrenheit. For maximum speed I want to generate a transform to edit the dataset, creating an extra space which I will call “Transformed Space”
(Raw Space -> Transformed Space -> View Space -> Culled Space -> Screen Space)
The matrix transform to Fahrenheit (Transformed Space) would be:
| 1   0    0 | | x |
| 0  1.8  32 | | y |
| 0   0    1 | | 1 |
Is it possible to build transforms like this in Scichart or a partial matrices approach like in WPF? Or do I need to loop through and change my raw series every time the units change?
Thank You,
Nicholas Louks
- Nicholas Louks asked 12 months ago
- last active 11 months ago
Hi,
The axis labels are not always showing when zoomed in/out.
Is there a way/workaround to persist the end labels and also make it editable?
Please see attached pic
Thanks
Pramesh
- Pramesh Sharma asked 12 months ago
- last active 11 months ago
Hello! I want to create an AxisMarkerAnnotation but the padding doesn’t match the position of the text on the axis – I would like to align it and what is the way to do it? couldn’t find the right settings
- Sergey Evdokimov asked 12 months ago
- last active 12 months ago
Hi SciChart team,
first of all I want to say that I still think SciChart is great! However, I am quite frustrated at the moment. In small applications, the chart and its annotations work very well (yes “Annotations are Easy!”), but in large industrial applications with many views and millions of lines of code, there are from time to time difficult complications with the chart. This is also the case now with the Annotation Creation Modifier. As far as I can see, the AnnotationCreationModifier.OnModifierMouseUp method uses the annotation’s IsSelected state to determine whether to create a new annotation or complete one. With custom composite annotation it can happen that a mouse click first selects the annotation and only then AnnotationCreationModifier.OnModifierMouseUp is called (see attached screenshots).
Sometimes it works, sometimes it doesn’t, depending on where the mouse is.
The AnnotationCreationModifier should not use the annotation’s IsSelected state to complete its internal “edit mode” and call “OnAnnotationCreated”.
Or is there already a solution for this?
regards,
Tobias
- Tobias asked 12 months ago
- last active 11 months ago
Currently, I am creating a line chart and appending a lot of fetched data to the data series. The problem is that I have to recreate the chart when I move to another page that is using the same chart from the previous page. Therefore, I have to fetch the data and append it to the chart data series again.
Is there any way to reuse the chart itself without recreating the whole chart on another page?
- info vcanus asked 12 months ago
- last active 12 months ago
Hi, I’m struggling to reduce times for loading draw (5,000Series x 5,000points) x 10 charts
which is in Scichart example ‘Load 500Seriesx500points’.
-
Present, Loading (5,000Series x 5,000points) x 10 charts consumes about 1 minutes.
How can i load and draw this more faster? -
And While in loading, how can i generate and show a Progress bar?
- Hyunji Jeon asked 12 months ago
- last active 11 months ago
I am using a axis line chart from the js scichart. I want to change the font size of a legend. How do I change the font size of a legend?
- info vcanus asked 12 months ago
- last active 12 months ago
I have a screen with multiple chart surfaces stacked on top of each other within a ScrollView. I can’t use a single chart surface because each of the charts is combined with other types of views to display extra information about the data in the charts.
I have a few issues I’m trying to solve:
-
Each of the charts uses the same x-axis range. When a user pinches to zoom or drags to pan on a chart, I want all the charts to be synchronized to zoom and pan at the same time. How can I do this?
-
Because the charts are embedded in a ScrollView, when I use the following modifiers it is very difficult to smoothly zoom and pan without the ScrollView being activated to scroll up and down. How can I make it so that the ScrollView is deactivated from moving while the user is attempting to zoom or pan a chart
surface.chartModifiers.add(

XAxisDragModifier().apply {

dragMode = AxisDragModifierBase.AxisDragMode.Pan

minTouchArea = 1000.0f

}

)

surface.chartModifiers.add(

PinchZoomModifier().apply {

direction = Direction2D.XDirection

}

)
- Marcela Guerra asked 12 months ago
- last active 12 months ago
I wanted to experiment with adding a tooltip to the SciChart_ScatterChartPerformanceDemo.
I extended the xaml with
 <s:SciChartSurface.ChartModifier>
            <s:ModifierGroup>
                <s:MouseWheelZoomModifier/>
                <s:TooltipModifier />
            </s:ModifierGroup>
        </s:SciChartSurface.ChartModifier>
However, I have noticed that the tooltip doesn’t seem to react properly to the geometry under the cursor. The tooltip will often show up when the cursor is outside the geometry.
If you use a SquarePointMarker with a width and height of 25, the tooltip pops up even when you’re a fair distance away from the geometry.
The hit detection doesn’t appear to be working correctly?
Edit : Also, it appears I am unable to answer questions here, when I add an answer, it accepts it, but doesn’t show anything?
- forl forl asked 12 months ago
- last active 10 months ago
Hi~
I am trying to create a plot that animates ODS (Operating Deflection Shape) using FRF (Frequency Response Function) data. Is ODS animation possible using scichart’s gemoetry 3D plot?
Thanks.
- kim2 kim asked 12 months ago
- last active 12 months ago
I’m overriding FastLineRenderableSeries so I can do some custom rendering.
I have a data series defined as :
 var xyDataSeries = new XyDataSeries<double>();
            xyDataSeries.Append(0, 0);
            xyDataSeries.Append(1, 1);
Test.DataSeries = xyDataSeries;
and my chart as :
<s:SciChartSurface Loaded="SciChartSurface_Loaded">
        <s:SciChartSurface.RenderableSeries>
            <customSeriesMvvmExample:FastLineRenderableSeriesEx x:Name="Test" />
        </s:SciChartSurface.RenderableSeries>
        <s:SciChartSurface.XAxis>
            <s:NumericAxis/>
        </s:SciChartSurface.XAxis>
        <s:SciChartSurface.YAxis>
            <s:NumericAxis/>
        </s:SciChartSurface.YAxis>
    </s:SciChartSurface>
And then I override InternalDraw :
public class FastLineRenderableSeriesEx : FastLineRenderableSeries
{
    protected override void InternalDraw(IRenderContext2D renderContext, IRenderPassData renderPassData)
    {
        base.InternalDraw(renderContext, renderPassData);

        using (var brush = renderContext.CreateBrush(Colors.Transparent))
        using (var pen = renderContext.CreatePen(Stroke, true, StrokeThickness, Opacity))
        {

            var xCalc = renderPassData.XCoordinateCalculator;
            var yCalc = renderPassData.YCoordinateCalculator;

            var xCoord = xCalc.GetCoordinate(0.5);
            var yCoord = yCalc.GetCoordinate(0.5);

            renderContext.DrawEllipse(pen, brush, new System.Windows.Point(xCoord, yCoord), 150, 150);

            renderContext.DrawLine(pen,
                new System.Windows.Point(xCalc.GetCoordinate(0.6), yCalc.GetCoordinate(0)),
                new System.Windows.Point(xCalc.GetCoordinate(2), yCalc.GetCoordinate(1.4)));
        }
    }
}
The problem is that the base.InternalDraw draws the original data series line very nicely with anti-aliasing, but the custom circle I draw has no AA, and the custom line I draw looks very thin?
what’s going on here?
- forl forl asked 12 months ago
- last active 12 months ago
I am running the app which uses the sci chart object FreeSurfaceRenderableSeries3D.
This is a 3d spherical surfaced object, i tried to run it in release mode, i am unable to do the manual rotation using mouse drag to explore the surface of the 3d object. But the object is on freeze for any mouse activity on screen.
I have attached sample image of state of my app.
Please suggest.
- Vishnu Ramvath asked 12 months ago
- last active 12 months ago
My application supports two themes (dark/light) for the charts. The background of the chart will be set to black if the dark mode is applied, and white if the light mode applied. It works well with the line chart. But there is strange grey background appeared in the heatmap chart when light mode is applied (Please check the attached screenshots). The color of gradient stop of offset 0 (min. heatmap zValues) is set to transparent and it works well with the dark mode. Do you know what’s wrong in my case?
Dark theme object applied to the chart:
{...new SciChartJSDarkTheme(), ...{
        sciChartBackground: "#1c1c1c",
        axisTitleColor: "#dee2e6",
        labelBorderBrush: "#dee2e6",
        tickTextBrush: "#dee2e6",
        majorGridLineBrush: "#1F3D68",
        minorGridLineBrush: "#102A47",
    }
Light theme object applied to the chart:
{...new SciChartJSLightTheme(), ...{
        sciChartBackground: "#fff",
        axisTitleColor: "#333",
        labelBorderBrush: "#333",
        tickTextBrush: "#333",
    }}
Heatmap graditentStops:
[
    { offset: 1, color: COLORS.DARK_RED },
    { offset: 0.8, color: COLORS.RED },
    { offset: 0.6, color: COLORS.YELLOW },
    { offset: 0.5, color: COLORS.GREEN },
    { offset: 0.4, color: COLORS.BLUE },
    { offset: 0.01, color: COLORS.DARK_BLUE },
    { offset: 0, color: "Transparent" },
]
- Quyen Sy asked 12 months ago
I am facing the following two issues related to application crash and unable to perform 3d object rotation in release mode.
Issue 1: Application Crash
I am using PointLineRenderableSeries3D object to render the Data series points.
I have a timer which ticks every 1 sec and have new data series points with some rotation of previous values.
Hence will try to add new points on every 1 sec to the same object data series
timer1.tick +=(() => {
// rendererUpdate is object of PointLineRenderableSeries3D
        using (rendererUpdate.DataSeries.SuspendUpdates())
            {
              var newData = GetNewPointsWithRotation( rendererUpdate.DataSeries, 30);//30 is angle of rotation for older points
                rendererUpdate.DataSeries = newData;
            }
}
Issue 2: When i run the application in release mode, i am unable to perform manual rotation using mouse dragging for the 3d sphere FreeSurfaceRenderableSeries3D object SurfaceMesh referred in the code.
When the application is running in release mode , i tried to drag rotate the 3d shape, but the 3d object is not responding to the mouse drag event (Press hold mouse left button and drag).
The attachment contains the wpf code (xaml and cs) in the same file.
Code refers .jpg file, Please refer any local jpg file to repro the issue.
Please suggest the possible reasons and fixes of the same.
Please provide the possible insights of the same.
- Vishnu Ramvath asked 12 months ago
- last active 10 months ago
I want to create a chart like the attached image file.
I want to mark points with different colors depending on the number of data corresponding to the x and y axes.
As a result of searching, there is a HeatmapColorPalette. Is it good to use this?
If there is a more suitable chart, please introduce it.
thank you
- Seung Woo Jin asked 12 months ago
- last active 12 months ago
Is there any option to hide any axis panel (side wall of the y-axis) in SciChart3D? want to hide the wall marked in red in the image.
- Sunitha Rallabandi asked 12 months ago
- last active 12 months ago
I am trying to implement a waterfall chart with uniform heatmap. The data is updated from the top of the chart and keeps pushing the old data down. I would like to show the y-axis with time. How can I update the y-axis with updated data?
Assume the heatmap is 256 height, I created the zValues array with min value when draw the heatmap:
const SPECTROGRAM_WIDTH = 256;
const minPower = -200;
spectrogramZValues.current = Array.from(Array(SPECTROGRAM_HEIGHT), () => Array(SPECTROGRAM_WIDTH).fill(minPower));
Update zValues array when new data come:
    spectrogramZValues.current.shift();
        spectrogramZValues.current.push(newData);
When the first data pushed to the chart. There will be one row shown in the axis with timestamp t1. When the second data comes, the top row of the y-axis should be t2 and the t1 is pushed down. When the waterfall chart is filled with 256 data, the bottom of the y-axis should be t1 and the top of the y-axis should be t256. Is it possible to implement this?
Now I am using the uniform heatmap to implement it with yStart=0 and yStep=1. I tried to add the labelProvider to the y-axis to show the timestamp of each row. I am keeping an array locally to store the timestamp of each row which will be updated with the new data. I tried to map this array and return the timestamp in the y-axis labelProvider. But it doesn’t work. The y-axis will not be refreshed when data updated.
        yAxis.labelProvider.formatLabel = (dataValue) => {
        const ts = timestampArray[dataValue];
        if (ts) {
            const timeObj = new Date(ts);
            const hours = ('0' + timeObj.getHours()).slice(-2);
            const minutes = ('0' + timeObj.getMinutes()).slice(-2);
            const seconds = ('0' + timeObj.getSeconds()).slice(-2);
            const milliseconds = ('0' + timeObj.getMilliseconds()).slice(-3);
            return `${hours}:${minutes}:${seconds}.${milliseconds}`;
        } else {
            return "";
        }
    };
- Quyen Sy asked 1 year ago
- last active 12 months ago
I am implementing a waterfall chart with non-uniforma heatmap. I found that the live update doesn’t work. I keep updating the zValues with live data but the chart just show 1 row of data. If I resize the chart (my heatmap is inside a resizable container), I can see the updated data (i.e. Each time I resize the chart, the chart updated and show updated data). Do you have any example of live updated non-uniform heatmap? Below are my codes:
Draw the heatmap:
const SPECTROGRAM_HEIGHT = 256;
const SPECTROGRAM_WIDTH = 100;

const { sciChartSurface, wasmContext } = await SciChartSurface.create("spectrogram-chart-root");

const xAxis = new NumericAxis(wasmContext, {
    axisTitle: "Frequency",
    axisTitleStyle: {
        fontSize: CHART_STYLE.AXIS_FONT_SIZE,
        fontFamily: "sans-serif",
        fontWeight: "bold"
    },
    labelStyle: {
        fontSize: CHART_STYLE.LABEL_FONT_SIZE,
        fontFamily: "sans-serif"
    },
    labelFormat: ENumericFormat.Decimal,
    labelPrecision: 6,
    cursorLabelFormat: ENumericFormat.Decimal,
    cursorLabelPrecision: 6,
    drawMajorBands: false,
});

const yAxis = new NumericAxis(wasmContext, {
    axisTitle: "Time",
    axisTitleStyle: {
        fontSize: CHART_STYLE.AXIS_FONT_SIZE,
        fontFamily: "sans-serif",
        fontWeight: "bold"
    },
    labelStyle: {
        fontSize: CHART_STYLE.LABEL_FONT_SIZE,
        fontFamily: "sans-serif"
    },
    drawMajorBands: false,
});

// Add XAxis and YAxis
sciChartSurface.xAxes.add(xAxis);
sciChartSurface.yAxes.add(yAxis);

const colorMap = new HeatmapColorMap({
    minimum: -200,
    maximum: -50,
    gradientStops: [
    { offset: 0, color: "Transparent" },
    { offset: 0.01, color: COLORS.DARK_BLUE },
    { offset: 0.4, color: COLORS.BLUE },
    { offset: 0.5, color: COLORS.GREEN },
    { offset: 0.6, color: COLORS.YELLOW },
    { offset: 0.8, color: COLORS.RED },
    { offset: 1, color: COLORS.DARK_RED },
    ]
});

// Create a Heatmap Data-series. Pass heatValues as a number[][] to the UniformHeatmapDataSeries
zValues = Array.from(Array(SPECTROGRAM_HEIGHT), () => Array(SPECTROGRAM_WIDTH).fill(-200));

const heatmapSeries = new NonUniformHeatmapRenderableSeries(wasmContext, {
    dataSeries: new NonUniformHeatmapDataSeries(wasmContext, { zValues: zValues, xCellOffsets: getHeatmapXOffset, yCellOffsets: getHeatmapYOffset }),
    colorMap: colorMap,
    useLinearTextureFiltering: true,
    fillValuesOutOfRange: true,
});

// Add heatmap to the chart
sciChartSurface.renderableSeries.add(heatmapSeries);
I simply return the index for testing in the getHeatmapXOffset and getHeatmapYOffset functions:
    const getHeatmapXOffset = (index) => {
    return index;
};

const getHeatmapYOffset = (index) => {
    return index;
};
Reset zValues when number of data point changed:
        spectrogramZValues = Array.from(Array(SPECTROGRAM_HEIGHT), () => Array(newWidth).fill(-200));
        heatmapSeries.dataSeries.setZValues(spectrogramZValues);
        sciChartSurface.zoomExtents();
Update the zValues array when there is new data (I tried to add call zoomExtens() after notifyDataChanged but still didn’t work):
    spectrogramZValues.shift();
    spectrogramZValues.push(newData);
    heatmapSeries.current.dataSeries.notifyDataChanged();
- Quyen Sy asked 1 year ago
- last active 1 year ago
Is it possible to change the heatmap legend from vertical to horizontal?
- Quyen Sy asked 1 year ago
- last active 12 months ago
I am trying to create a live updated non-uniform heatmap with uniform xStep but non-uniform yStep. But I got color mapping problem when I tried to create the non-uniform heatmap. The color showing in the chart doesn’t map with the ColorMap value. Below are my codes:
Draw the non-uniform heatmap:
const SPECTROGRAM_HEIGHT = 256;
    const SPECTROGRAM_WIDTH = 100;

    const { sciChartSurface, wasmContext } = await SciChartSurface.create("spectrogram-chart-root");

    const xAxis = new NumericAxis(wasmContext, {
        axisTitle: "Frequency",
        axisTitleStyle: {
            fontSize: CHART_STYLE.AXIS_FONT_SIZE,
            fontFamily: "sans-serif",
            fontWeight: "bold"
        },
        labelStyle: {
            fontSize: CHART_STYLE.LABEL_FONT_SIZE,
            fontFamily: "sans-serif"
        },
        labelFormat: ENumericFormat.Decimal,
        labelPrecision: 6,
        cursorLabelFormat: ENumericFormat.Decimal,
        cursorLabelPrecision: 6,
        drawMajorBands: false,
    });

    const yAxis = new NumericAxis(wasmContext, {
        axisTitle: "Time",
        axisTitleStyle: {
            fontSize: CHART_STYLE.AXIS_FONT_SIZE,
            fontFamily: "sans-serif",
            fontWeight: "bold"
        },
        labelStyle: {
            fontSize: CHART_STYLE.LABEL_FONT_SIZE,
            fontFamily: "sans-serif"
        },
        drawMajorBands: false,
    });

    // Add XAxis and YAxis
    sciChartSurface.xAxes.add(xAxis);
    sciChartSurface.yAxes.add(yAxis);

    const colorMap = new HeatmapColorMap({
        minimum: -200,
        maximum: -50,
        gradientStops: [
            { offset: 1, color: COLORS.DARK_RED },
            { offset: 0.8, color: COLORS.RED },
            { offset: 0.6, color: COLORS.YELLOW },
            { offset: 0.5, color: COLORS.GREEN },
            { offset: 0.4, color: COLORS.BLUE },
            { offset: 0.01, color: COLORS.DARK_BLUE },
            { offset: 0, color: "Transparent" },
        ]
    });

    // Create a Heatmap Data-series. Pass heatValues as a number[][] to the UniformHeatmapDataSeries
    zValues = Array.from(Array(SPECTROGRAM_HEIGHT), () => Array(SPECTROGRAM_WIDTH).fill(-200));

    const heatmapSeries = new NonUniformHeatmapRenderableSeries(wasmContext, {
        dataSeries: new NonUniformHeatmapDataSeries(wasmContext, { zValues: zValues, xCellOffsets: getHeatmapXOffset, yCellOffsets: getHeatmapYOffset }),
        colorMap: colorMap,
        useLinearTextureFiltering: true,
        fillValuesOutOfRange: true,
    });

    // Add heatmap to the chart
    sciChartSurface.renderableSeries.add(heatmapSeries);
I simply return the index for testing in the getHeatmapXOffset and getHeatmapYOffset functions:
const getHeatmapXOffset = (index) => {
    return index;
};

const getHeatmapYOffset = (index) => {
    return index;
};
I fill the zValues array with the minimum value -200, but the data displayed in the chart is COLORS.YELLOW. I don’t understand what’s wrong.
- Quyen Sy asked 1 year ago
- last active 1 year ago
Hello all,
our application is recording data points from a measurement device. The recorded data points are shown in a 2D and 3D chart. Both charts are within one page, the user can switch between the charts via TabControl.
The problem we have is, that when a new data point is added, the chart, which is not in focus (so not selected by the TabControl) does not update.
For the 2D chart we could solve this issue by executing the following code on the TabControl selection changed event:
this.ViewportManager.BeginInvoke(() => { this.ViewportManager.ZoomExtents(); });
For the 3D chart we tried the same approach with the following code (also exectue on the TabControl selection changed event), the function ScaleWorldDimensions adjust the 3D space based on the recorded data:
   Application.Current.Dispatcher.Invoke(() =>
        {
            if (this.ListDataPoints.Count > 0)
            {
                this.ScaleWorldDimensions(this.ListDataPoints);
                this.Surface3D.ViewportManager.ZoomExtents();
            }
        });
But unfortunately this does not solve the issue. Therfore the user either has to switch the tab again or add a new data point when the 3D chart is selected.
Do have hints on how to solve this issue?
Thanks for your support in advanced, in case you need furhter information please let me know.
- Thomas Holler asked 1 year ago
- last active 1 year ago
I used NPM to complete the deployment and development validation of SCICHART JS, and I completed the demo as follows:
At present, I have two unresolved issues that we will make a purchase decision after they are resolved:
1、How to set the sampling rate for chart?
Using the wpf control, the sampling rate can be set through the “FifoCapacity” property of XyDataSeries, but I did not find this property in the JS control.
2、How to hide the preview of the SciChartOverview control?
I don't want to display the data of the bound chart
- max tu asked 1 year ago
- last active 1 year ago
Hello! I am try to create chart with axis on top in my react native app, chart is create succesfuly, but when I start add annotation – it shift to top by axis height – whats may be wrong?
`
// create
surface = new CSciChartSurface(context);
surface.setRenderSurface(new RenderSurface(context));

// Initialize the SciChartBuilder
SciChartBuilder.init(context);

// Obtain the SciChartBuilder instance
sciChartBuilder = SciChartBuilder.instance();

 xAxis = sciChartBuilder
      .newCategoryDateAxis()
      .withTextFormatting(DateChartFormatter.defaultDateFormat)
      .withGrowBy(0.0d, 0.04d)
      .withDrawMajorGridLines(true)
      .withDrawMinorGridLines(false)
      .withDrawMajorBands(false)
      .withDrawMajorTicks(false)
      .withAxisAlignment(AxisAlignment.Top)
      .build();
// same yaxis and any

VerticalLineAnnotation verticalLine = sciChartBuilder.newVerticalLineAnnotation()
        .withPosition(10, 16)
        .withStroke(2, ColorUtil.Orange)
        .withIsEditable(true)
        .build();

Collections.addAll(surface.getYAxes(), yAxis);
Collections.addAll(surface.getXAxes(), xAxis);
Collections.addAll(surface.getRenderableSeries(), lineRenderableSeries);
Collections.addAll(surface.getAnnotations(), verticalLine);

// add to view
this.addView(surface);
`
- Sergey Evdokimov asked 1 year ago
- last active 1 year ago
Hi Andrew,
I have 2 independent questions,
Q1.
I have been working with uniform heatmap and I need a way to fix the aspect ratio to 1, for all resize, zoom events, is there an option in heatmap to fix an aspect ration? Please see the attached video
https://youtu.be/obhH6KLExYw
Q2.
I am trying to implement a lasso select method to select and highlight the heatmap data. I did not find lasso select in the documentation hence I went ahead and implemented my own method.
I am drawing an svg using D3 (offsetX and offsetY variables) and then adding it to the annotation as you will see in the video and trying to get all the hitTest data inside the lasso.
If I use the customAnnotation then heatmap is able to draw correct size and location of the SVG
customAnnotation:
https://youtu.be/gL34sAbxYSE
But it does not pan and zoom with the plot data. after looking through documentation I came across OverviewCustomResizableAnnotation which seems designed for zooming and panning with the data.
But while using the OverviewCustomResizableAnnotation the SVG size keeps changing during the update and is not located at the correct location relative to the data.
sciChartSurfaceRef.current.annotations.add(

new OverviewCustomResizableAnnotation({

id: "lassoSVG",

x1: shortestXinData,

y1: shortestYinData,

isEditable: false,

isSelected: false,

yCoordinateMode: ECoordinateMode.DataValue,

xCoordinateMode: ECoordinateMode.DataValue,

verticalAnchorPoint: EVerticalAnchorPoint.Top,

horizontalAnchorPoint: EHorizontalAnchorPoint.Left,

svgString: new XMLSerializer().serializeToString(svg.node())

})

)
OverviewCustomResizableAnnotation:
https://youtu.be/-AOJ9V3l-xI
Thanks,
Pramod
- pramod butte asked 1 year ago
- last active 1 year ago
Hello! How i can create same style on select chart

i use public class XyCustomPaletteProvider extends PaletteProviderBase<XyRenderableSeriesBase> implements IFillPaletteProvider, IStrokePaletteProvider, IPointMarkerPaletteProvider { but i can pass only single color like this:
I try create three AreaStyle with gradient but nothing could be done…
use version SciChart 4.4.0.4739
- Sergey Evdokimov asked 1 year ago
- last active 1 year ago
Hi,
Is there any way to create a multipane chart in WPF like it done using Sub-Charts API in JavaScript chart where it shares same WebGL chart surface.
I know the way it is done using SciChartGroup where there are multiple SciChartSurfaces added to the group in order to create multipane chart, but if it can be done the way it is done in JavaScript charts, it will improve WPF chart performance drastically I think.
Regards,
Chandra
- Chandra Pratap Singh asked 1 year ago
- last active 1 year ago
When the X-axis mouse scroll to zoom in or out, the use of MouseWheel=”mouseWheelZoomModifier_MouseWheel” monitoring is invalid, how to do the mouse wheel zoom, dynamic loading more data, the mouse wheel shrink, do not need to reduce the data, because in some cases the one-time loading data is too large
- fang yangmao asked 1 year ago
- last active 1 year ago
Hello,
I have several simple SciChartSurfaces in my WPF-grid. They are in the same WPF-column but in different WPF-rows, so they are arranged in a vertical manner.
I have noticed that the Y-Axis (a NumericAxis-objcet) moves automatically slightly to the left to make room for the numbers on the Y-Axis, if necessary.
I would like to ask if there is a way to “synchronize” the position of several similar Charts (or their Y-Axis´s, respectively.), so the different Y-Axis´s would always be in the same position. Ideally, the Y-Axis´s of all the Charts would move as far to the left as necessary to make room for the longest number of all the Axis´s.
I have attached an example of my current situation and the solution I would ideally like to achieve.
Is there any way to “connect” the different Axis of the charts to create the desired result?
Thank you.
- Marc Vahldieck asked 1 year ago
- last active 11 months ago
Hello All,
I was trying to set the visual range property on a numeric axis but i get the error that the “equals” is not a function of NumerixAxis. This happens when i try the following.
export function setXAxisVisibleRange(element, visibleRange) {
     const { sciChartSurface } = resolveContext(element);
     var axis = sciChartSurface.xAxes.get(0);
     axis.visibleRange = visibleRange; **//error here**
}
attached is a picture of a more detailed error. Ultimately what I am trying to do is to sync up the visual range of two charts x axis like in the following tutorial
Thanks for your help in advance.
UPDATE
So my issue was that I had a serialization issue with the NumberRange class. I can now sync up the charts just like in the tutorial. The problem now is that if I scroll or zoom very fast eventually the charts start to flicker in an endless loop. Has anyone ever seen this behavior? One thing I notice is that the min and max value have over 10 decimal points.
Here is a quick printout of the value change events between the two charts when the flickering starts.
Any ideas?
–> CH.1 Min: 0.532180460735786 Max: 3.457511660735786
–> CH.2 Min: -0.17488026755852848 Max: 4.339519732441472
–> CH.2 Min: 0.025927491638795958 Max: 4.088887491638796
–> CH.2 Min: 0.38738145819397996 Max: 3.63774945819398
–> CH.1 Min: 0.5319630448160535 Max: 3.4572942448160537
–> CH.2 Min: 0.532180460735786 Max: 3.457511660735786
–> CH.1 Min: -0.17488026755852848 Max: 4.339519732441472
–> CH.1 Min: 0.025927491638795958 Max: 4.088887491638796
–> CH.1 Min: 0.38738145819397996 Max: 3.63774945819398
–> CH.2 Min: 0.5319630448160535 Max: 3.4572942448160537
–> CH.1 Min: 0.532180460735786 Max: 3.457511660735786
–> CH.2 Min: -0.17488026755852848 Max: 4.339519732441472
- Sergio Faura asked 1 year ago
- last active 1 year ago
I am implementing a heatmap. The data size of the heatmap would be changed. I update the UniformHeatmapDataSeries with the updated zValues according to this post.
There is no problem if I update the UniformHeatmapDataSeries with a larger size zValues array. However, when I update it with a smaller size zValues array, the heatmap width will be decrease (Please refer to my screenshots). How can I keep the heatmap always 100% width?
- Quyen Sy asked 1 year ago
- last active 1 year ago
The console prints an exception when I zoom in and out with the mouse wheel:
SciChartSurface didn’t render, because an exception was thrown:
Message: Arrays yValues and indexes must have the same length
Stack Trace: at swb.iwb(Int32 bij, String bik, Int32 bil, String bim)
at SciChart.Data.Model.UniformXyPointSeries..ctor(Double xStart, Double xStep, Values1 yValues, Values1 indexes)
at SciChart.Charting.Visuals.RenderableSeries.DrawingProviders.PointMarkerDrawingProvider1.OnDraw(IRenderContext2D renderContext, IRenderPassData renderPassData)1 enumerable, Action`1 operation)
at SciChart.Core.Extensions.EnumerableExtensions.ForEachDo[T](IEnumerable
at SciChart.Charting.Visuals.RenderableSeries.BaseRenderableSeries.InternalDraw(IRenderContext2D renderContext, IRenderPassData renderPassData)
at SciChart.Charting.Visuals.RenderableSeries.BaseRenderableSeries.SciChart.Charting.Visuals.IDrawable.OnDraw(IRenderContext2D renderContext, IRenderPassData renderPassData)
at ebu.toj(RenderPassInfo gj, IRenderContext2D gk, Int32 gl)
at ebu.toi(ISciChartSurface gg, RenderPassInfo gh, IRenderContext2D gi)
at ebu.RenderLoop(IRenderContext2D renderContext)
at SciChart.Charting.Visuals.SciChartSurface.DoDrawingLoop()
Here is a simple example program uploaded.
- hundun wds asked 1 year ago
- last active 1 year ago
I was having some issues with 2 of the chart modifiers for a SciChart3DSurface. The FreeLookModifier3D used to work as intended, but now non of the key presses work. However, the “ExecuteOn” middle mouse button does free look the camera, I just can’t move the camera forwards and backwards with the ‘w’ ‘a’ ‘s’ ‘d’ ‘c’ or ‘e’ keys. In short, I figured it was something I did since I’m messing with the keyboard, but I haven’t been able to pin down the problem. Then, the VertexSelectionModifier stopped working as intended. It seems as if it’s successfully attached to the surface, but it fails to select any points. This previously worked, and stopped moving around the time when I moved SQL databases, oddly enough. I’ve uploaded a short video to Google Drive (https://drive.google.com/file/d/1y_C7XUU3mMPJ4h4m6LpFKVwZELtEUup3/view?usp=sharing) that demonstrates that the selection box appears when I hold down the left mouse button. What might be causing the chart modifiers to misbehave.
- Will Wright asked 1 year ago
Hi there,
I encountered a problem that the labels, lineAnnotations and chart are not sharp, a little blurry. Is there any way to fix this?
- Diamond Aleska asked 1 year ago
- last active 1 year ago
Hi I have an application where I would like to get the color information of the the pixel clicked on the uniformheatmap.
I am of course able to get the value, x, y using the hitTestProvider.hitTest but it does not contain any additional information regarding the color of the clicked pixel
Any help of direction is appreciated.
Pramod
- pramod butte asked 1 year ago
- last active 1 year ago
Hello. I noticed that a canvas appears in the DOM tree, which completely duplicates the main chart, but it is set to display: none.
can i ask what it is used for? does it affect performance? and can i remove it?
- [email protected] [email protected] asked 1 year ago
- last active 1 year ago
I am implementing a heatmap. The data size of the heatmap would be changed. When the data size changed, I will replace the zValues of the UniformHeatmapDataSeries with an updated array. But it doesn’t work for me. The heatmap data cannot be plotted after I updated the zValues array. Below are my codes to create the heatmap and update the zValues array.
Draw heatmap:
    const { sciChartSurface, wasmContext } = await SciChartSurface.create("spectrogram-chart-root");
    let xAxisNumberRange = new NumberRange(minFreq/maxFreq);

    spectrogram_xAxis.current = new NumericAxis(wasmContext, {
        axisTitle: "Frequency",
        axisTitleStyle: {
            fontSize: CHART_STYLE.AXIS_FONT_SIZE,
            fontFamily: "sans-serif",
            fontWeight: "bold"
        },
        labelStyle: {
            fontSize: CHART_STYLE.LABEL_FONT_SIZE,
            fontFamily: "sans-serif"
        },
        visibleRange: xAxisNumberRange,
        visibleRangeLimit: xAxisNumberRange,
        zoomExtentsRange: xAxisNumberRange,
        labelFormat: ENumericFormat.Decimal,
        labelPrecision: 2,
        cursorLabelFormat: ENumericFormat.Decimal,
        cursorLabelPrecision: 2,
        drawMajorBands: false,
    });

    // Add XAxis and YAxis
    sciChartSurface.xAxes.add(spectrogram_xAxis.current);
    sciChartSurface.yAxes.add(new NumericAxis(wasmContext, { isVisible: false }));

    // Create a Heatmap Data-series. Pass heatValues as a number[][] to the UniformHeatmapDataSeries
    spectrogramZValues.current = Array.from(Array(SPECTROGRAM_HEIGHT), () => Array(SPECTROGRAM_WIDTH).fill(-200));
    heatmapDataSeries.current = new UniformHeatmapDataSeries(wasmContext, {
        xStart: 0,
        xStep: 1,
        yStart: 0,
        yStep: 1,
        zValues: spectrogramZValues.current
    });

    colorMap.current = new HeatmapColorMap({
        minimum: -200,
        maximum: -50,
        gradientStops: gradientStopsArr.current
    });

    // Create a Heatmap RenderableSeries with the color map. ColorMap.minimum/maximum defines the values in
    // HeatmapDataSeries which correspond to gradient stops at 0..1
    const heatmapSeries = new UniformHeatmapRenderableSeries(wasmContext, {
        dataSeries: heatmapDataSeries.current,
        useLinearTextureFiltering: true,
        isSorted: true,
        isEvenlySpaced: true,
        containsNaN: false,
        colorMap: colorMap.current
    });

    // Add heatmap to the chart
    sciChartSurface.renderableSeries.add(heatmapSeries);
Update heatmap data:
        // Update the chart x-axis
        if (xAxisUpdateRequired) {
            let xAxisNumberRange = new NumberRange(newStartFreq, newStopFreq);
            spectrogram_xAxis.current.visibleRange = xAxisNumberRange;
            spectrogram_xAxis.current.visibleRangeLimit = xAxisNumberRange;
            spectrogram_xAxis.current.zoomExtentsRange = xAxisNumberRange;

            // Reset the heatmap zValues
            heatmapDataSeries.current.clear();
            spectrogramZValues.current = Array.from(Array(SPECTROGRAM_HEIGHT), () => Array(newSampleSize).fill(-200));
            heatmapDataSeries.current.setZValues(spectrogramZValues.current);
        }
        // Update heatmap data
        spectrogramZValues.current.shift();
        spectrogramZValues.current.push(newSpecData);
        heatmapDataSeries.current.notifyDataChanged();
- Quyen Sy asked 1 year ago
- last active 1 year ago
How to modify the official sample program: DigitalAnalyzerPerformanceDemo,
Implement [MouseWheel] to scroll up and down the channel, [CTRL + MouseWheel] to enlarge and narrow the channel data?
I found that [CTRL + MouseWheel] is used by default to shift the Y-axis up and down.
Example program RUL:https://github.com/ABTSoftware/SciChart.Wpf.Examples/tree/master/Sandbox/CustomerExamples/DigitalAnalyzerPerformanceDemo
- hundun wds asked 1 year ago
- last active 1 year ago
I have a chart with default majorDelta 10 for y-axis. Users are allowed to change the scale (majorDelta) of the chart. When it’s changed to 0.1, the y-axis labels are gone. The y-axis labels can still be seen when the majorDelta is 0.2. Please check my screenshots for details.
- Quyen Sy asked 1 year ago
- last active 1 year ago
I would like to modify the XYZ Gizmo in XAML, but I can’t figure out how. What would this code look like?
- Will Wright asked 1 year ago
- last active 1 year ago
I’m encountering some odd behaviour when I rescale my graph to modify the range of the X axis. For certain data series, the line disappears from the chart.
e.g. I have a data series that’s 2899 points long, with X values ranging from -6.17 to 22.81, so I change my X axis range to be from -8 to 24 to fit it all in. When I change the VisibleRange of the SciChartSurface.XAxis, then the line disappears. If I don’t rescale the visible range then the portion that would be visible is rendered fine.
The funny thing about it is, if I remove the last point from the series before adding to the chart, it draws fine, even after I rescale the visible range! The same goes for if I add another point to the end (e.g. even if that point is identical to the existing last point).
Now if I hover the mouse (Rollover) over the chart, the spot to highlight the point in the line still appears as if the graph was still there. It’s like it’s there but invisible.
I’ve tried setting DebugWhyDoesntSciChartRender to true, but this fires only when the chart is initially drawn and no series’ have been added yet, so I get
SciChartSurface didn’t render, RendererErrorCode: [RendererErrorCode: [Because the SciChartSurface.RenderableSeries collection is null or empty. Please ensure that you have set some RenderableSeries with RenderableSeries.DataSeries assigned, or you have set Axis.VisibleRange for all axes in order to view a blank chart.]
RendererErrorCode: [Because none of the SciChartSurface.RenderableSeries has a DataSeries assigned]
However I add the DataSeries’ after this, and when I do that, or rescale the axis, no error is reported.
Here is my XAML code to show the chart:
<s:SciChartSurface
        x:Name="SciChart"
        Grid.Column="0"
        Annotations="{Binding Annotations}"
        DebugWhyDoesntSciChartRender="True"
        GridLinesPanelStyle="{StaticResource GridLinesPanelStyle}"
        RenderableSeries="{s:SeriesBinding ChartSeries}"
        Style="{StaticResource SurfaceStyle}">

        <s:SciChartSurface.RenderSurface>
            <s:HighQualityRenderSurface />
        </s:SciChartSurface.RenderSurface>

        <s:SciChartSurface.XAxis>
            <s:NumericAxis
                AutoRange="Never"
                AutoTicks="False"
                AxisTitle="{Binding XAxis.Label}"
                DrawLabels="{Binding XAxis.ShowLabels}"
                DrawMajorGridLines="{Binding XAxis.MajorGridLines}"
                DrawMinorGridLines="{Binding XAxis.MinorGridLines}"
                DrawMinorTicks="True"
                LabelProvider="{Binding XAxisLabels}"
                MajorDelta="{Binding XAxis.MajorDelta}"
                MinorDelta="{Binding XAxis.MinorDelta}"
                Style="{StaticResource XAxisStyle}"
                TextFormatting="0.##"
                TickLabelStyle="{StaticResource XAxisLabelStyle}"
                TitleStyle="{StaticResource AxisTitleStyle}"
                VisibleRange="{Binding XAxis.DisplayRange.Value}" />
        </s:SciChartSurface.XAxis>

        <s:SciChartSurface.YAxis>
            <s:NumericAxis
                AutoRange="Never"
                AutoTicks="False"
                AxisAlignment="Left"
                AxisTitle="{Binding YAxis.Label}"
                DrawLabels="{Binding YAxis.ShowLabels}"
                DrawMajorGridLines="{Binding YAxis.MajorGridLines}"
                DrawMinorGridLines="{Binding YAxis.MinorGridLines}"
                DrawMinorTicks="True"
                MajorDelta="{Binding YAxis.MajorDelta}"
                MinorDelta="{Binding YAxis.MinorDelta}"
                LabelProvider="{Binding YAxisLabels}"
                Style="{StaticResource YAxisStyle}"
                TextFormatting="0.##"
                TickLabelStyle="{StaticResource AxisLabelStyle}"
                TitleStyle="{StaticResource AxisTitleStyle}"
                VisibleRange="{Binding YAxis.DisplayRange.Value}" />
        </s:SciChartSurface.YAxis>

        <s:SciChartSurface.ChartModifier>
            <s:ModifierGroup>
                <s:LegendModifier
                    x:Name="LegendModifier"
                    Margin="10"
                    HorizontalAlignment="Right"
                    GetLegendDataFor="AllSeries"
                    LegendTemplate="{StaticResource LegendTemplate}"
                    Orientation="Horizontal"
                    ShowLegend="{Binding ShowLegend}"
                    ShowVisibilityCheckboxes="False" />
                <s:RolloverModifier ShowAxisLabels="False">
                    <s:RolloverModifier.LineOverlayStyle>
                        <Style TargetType="Line">
                            <Setter Property="Stroke" Value="{StaticResource VitalCyanBrush}"/>
                            <Setter Property="StrokeThickness" Value="16"/>
                            <Setter Property="Opacity" Value=".2"/>
                            <Setter Property="IsHitTestVisible" Value="False"/>
                            <Setter Property="UseLayoutRounding" Value="True"/>
                        </Style>
                    </s:RolloverModifier.LineOverlayStyle>
                </s:RolloverModifier>
                <s:SeriesSelectionModifier>
                    <s:SeriesSelectionModifier.SelectedSeriesStyle>
                        <!--  When a series is selected (on click), apply this style  -->
                        <Style TargetType="s:BaseRenderableSeries">
                            <Setter Property="Stroke" Value="DeepPink" />
                            <Setter Property="StrokeThickness" Value="3" />
                        </Style>
                    </s:SeriesSelectionModifier.SelectedSeriesStyle>
                </s:SeriesSelectionModifier>
            </s:ModifierGroup>

        </s:SciChartSurface.ChartModifier>
    </s:SciChartSurface>
and here is the code to change the Axis visible range. (In the ViewModel). Note that while this changes both the X Axis and the Y Axis scale, only the X Axis change causes this problem.
        protected override void ScaleAxes(double xaxisLowerValue, double xaxisUpperValue, double yaxisLowerValue, double yaxisUpperValue)
    {
        var xAxisRange = new AxisRange(0, 0);
        var yAxisRange = new AxisRange(0, 0);

        //Resolve time axis
        yAxisRange.MaxValue = CalculateUpperBoundary(yaxisUpperValue, (double)_graphIndicators.BarChartMaxIndicator, YAxis.UpperPadding, YAxis.MajorDelta);
        yAxisRange.MinValue = CalculateLowerBoundary(yaxisLowerValue, (double)_graphIndicators.BarChartMinIndicator, YAxis.LowerPadding, YAxis.MajorDelta);

        //Resolve Volume Axis
        xAxisRange.MaxValue = CalculateUpperBoundary(xaxisUpperValue, xaxisUpperValue, XAxis.UpperPadding, XAxis.MajorDelta);
        xAxisRange.MinValue = CalculateLowerBoundary(xaxisLowerValue, xaxisLowerValue, XAxis.LowerPadding, XAxis.MajorDelta);

        //ensure max and min range have not exceeded the boundary range.
        xAxisRange = EnsureRangeIsWithinBounds(ref xAxisRange, XAxis.BoundingRange);
        yAxisRange = EnsureRangeIsWithinBounds(ref yAxisRange, YAxis.BoundingRange);

        //ensure max and min range are within optimal range.
        xAxisRange = EnsureRangeIsWithinOptimal(ref xAxisRange, XAxis.OptimalRange);
        yAxisRange = EnsureRangeIsWithinOptimal(ref yAxisRange, YAxis.OptimalRange);

        //update the display range
        XAxis.DisplayRange = xAxisRange;
        YAxis.DisplayRange = yAxisRange;
    }
- Colm de Cleir asked 1 year ago
Can SciChart be used in Qt? If so, is there a demo available for reference, or can you provide guidance on how to use it?
- Allen Nee asked 1 year ago
- last active 1 year ago
I need to show cursor on chart on button click.
Same like finance chart api.
- Amol Patil asked 1 year ago
- last active 1 year ago
Hi,
We use SciChart extensively in our WPF applications and make use of CustomRenderableSeries, writing all kinds of different lines and bitmaps directly to the IRenderContext2D depending on the point metadata.
We’re now looking at doing something similar in JavaScript, but can’t find any examples of this kind of customisation in the documentation. In the JavaScript library, is it possible to draw directly to a ‘canvas’ in the same way as in the WPF version? If so, could you please point to an example?
Many thanks,
Graham.
- Graham Stoneman asked 1 year ago
- last active 1 year ago
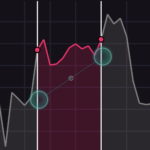
Hello,
I am developing a finance application and I am using AnimatingLineChart for it. I want prices like tickLine to be displayed instantly on this screen. But I’m having 2 problems while developing.
1- As I have included in the screenshot, the price movement seems to be in a straight line because the y-axis ranges are too much. I want to reduce the range here and show the price action in a healthier way. In the screenshot, the blue color is the graph drawn by the line graph, and the red color is the graph I want to draw. I create a very low range when determining the range, but this is not reflected in the chart. I am attaching the code I used below;
final NumericAxis yAxis = sciChartBuilder.newNumericAxis()
.withVisibleRange(new DoubleRange(1.095, 1.096))
.withGrowBy(new DoubleRange(0.1d, 0.1d))
.build();
2- Can I do this without entering a min and max value for Y axis while using this chart type? I want to create a structure in which it will dynamically determine the max and min values according to the price data it receives.
Do you have any suggestions for improving these or a better graphic type for it?
Thank you and have nice work.
- devrim çatak asked 1 year ago
- last active 1 year ago
I have a real time updated chart with very large data size and I am facing the slow client problem. i.e. The data sending speed is faster than the data receiving and handling speed which causes memory growing up issue. I am trying to use Web Workers to increase the data handling speed in frontend. I have found a related post:
https://www.scichart.com/questions/wpf/is-xydataseries-safe-to-being-changed-in-a-separate-thread
It seems possible to update XyDataSeries in the background thread with WPF. My UI is built with NextJS. I tried to use Web Workers to implement multiple threads. But I found that it can’t pass the SciChartSurface or XyDataSeries to the worker thread. Could you show me an example on how to update XyDataSeries in the worker thread with Web Workers?
- Quyen Sy asked 1 year ago
- last active 1 year ago
Hi Scichart Team,
I want to add two border lines on the top and left of the chart on the existing theme —“BrightSpark”, I searched and tried some IThemeProvider memebers but have no luck to solve it.
Please find the detail in attached pic, just like bottom and right sides, add two border lines on the other two sides.
- Keyu Yan asked 1 year ago
- last active 1 year ago
Hello Scichart Team,
Can you guys provide me with some guidance to implement a custom IRenderableSeriesViewModel implementation that is supported in MVVM binding in Scichartsurface? Specifically, I’m looking to create a chart series that can be bound to my ViewModel and support custom styling and data handling.
I have tried following the tutorial found here…
Worked Example – CustomRenderableSeries in MVVM
https://www.scichart.com/documentation/win/current/webframe.html#Worked%20Example%20-%20CustomRenderableSeries%20in%20MVVM.html
I was getting a cast error from scicharts. I have attached the picture showing the detailed error.
Concerning the XAML code I have tried both the normal Binding keyword and s:SeriesBinding keyword to the RenderableSeries in the SciChartSurface.
Let me know how to go about this!
- Arjun Sivaprasadam asked 1 year ago
- last active 1 year ago
Hello,
i’m using the spline filter with the ToSpline method.
The problem I have with this is that the method returns a different type.
I want to apply the filter to my XyDataSeries<long, double>. However, the returned value is of type XyDataSeries<double, double>.
Is there a way to apply the filter and have a XyDataSeries<long, double>?
- Martin Schlidt asked 1 year ago
- last active 1 year ago
What properties should I change to change the position of the information in the bottom left of the chart?
- JONGBOG JOUNG asked 1 year ago
- last active 1 year ago
