Dear Andrew,
Thank you for the past answers. I have a new question. I have a heatmap with 2 line charts at its left aand top position. the top line chart plot the horizontal values where the mouse if hovering and left chart displays vertical values from the mouse position.
This is working great, but the issue is the heatmap is not always square and I am trying the aligh the line charts with the heatmap dimensions
two issues,
-
the heatmap X/Y dimension are not always same, in fact I have a function which listens to the changing heatmap zoom factor and makes sure the X/Y are always “square” as we want to show the heatmap with square pixels. (see video #2) https://youtu.be/wXStF-7bWsw
-
As I dynamically chage the size of the plot the… the proportion of actual chart area to axis lable changes thus varying the overlap. (see video #1) https://youtu.be/loAVpYSRJ38
Let me know if you need more information,
Best,
Pramod
- pramod butte asked 8 months ago
- last active 7 months ago
Hi,
In my application I am using two charts for represent different values. I am using LegendModifier on the first chart. Is it possible when i uncheck the series on first chart and the same color series on second chart also need to hide from the second chart. Any event callback function available in LegendModifier ?
- Arun Surendran asked 2 years ago
- last active 2 years ago
Hi,
I am facing another issue with dataLabels in latest version of Scichart. I saw another question with similar is already posted and the fix is released.
Can you check this code.
I tried to reproduce the issue with the vue js example code, codesandbox. But the issues is behaving differently in example code, codesandbox, and my existing project.
codesandbox: https://codesandbox.io/s/scichart-error-6xc6jw?file=/src/index.ts
codesandbox:- Text in the bottom area are displayed and top area no labes are displayed.
I am attaching the vue js file also. Please check the file also, On the example no labels are displayed.
I am attaching the video of my project also, Here the labels are invisible sometimes, sometimes the labels are showing not properly. Video Link: https://drive.google.com/file/d/1vZ0lO5xdmN9VfFGXMaoTPfTgqRytrEAl/view?usp=sharing
- Mathew George asked 6 months ago
- last active 6 months ago
How to update the text Annotation in JavaScript. I can add the new Text annotation but I can’t update the old text Annotation. whether we have any option in sci chart for JavaScript.
- manoj prabakar asked 1 year ago
- last active 1 year ago
Hi Andrew,
I have 2 independent questions,
Q1.
I have been working with uniform heatmap and I need a way to fix the aspect ratio to 1, for all resize, zoom events, is there an option in heatmap to fix an aspect ration? Please see the attached video
https://youtu.be/obhH6KLExYw
Q2.
I am trying to implement a lasso select method to select and highlight the heatmap data. I did not find lasso select in the documentation hence I went ahead and implemented my own method.
I am drawing an svg using D3 (offsetX and offsetY variables) and then adding it to the annotation as you will see in the video and trying to get all the hitTest data inside the lasso.
If I use the customAnnotation then heatmap is able to draw correct size and location of the SVG
customAnnotation:
https://youtu.be/gL34sAbxYSE
But it does not pan and zoom with the plot data. after looking through documentation I came across OverviewCustomResizableAnnotation which seems designed for zooming and panning with the data.
But while using the OverviewCustomResizableAnnotation the SVG size keeps changing during the update and is not located at the correct location relative to the data.
sciChartSurfaceRef.current.annotations.add(

new OverviewCustomResizableAnnotation({

id: "lassoSVG",

x1: shortestXinData,

y1: shortestYinData,

isEditable: false,

isSelected: false,

yCoordinateMode: ECoordinateMode.DataValue,

xCoordinateMode: ECoordinateMode.DataValue,

verticalAnchorPoint: EVerticalAnchorPoint.Top,

horizontalAnchorPoint: EHorizontalAnchorPoint.Left,

svgString: new XMLSerializer().serializeToString(svg.node())

})

)
OverviewCustomResizableAnnotation:
https://youtu.be/-AOJ9V3l-xI
Thanks,
Pramod
- pramod butte asked 12 months ago
- last active 12 months ago
Hi, im facing a problem related to VisibleRange Auto,
when a value is much higher than the values
already plotted and I try to scroll along the X axis,
the value on the Y axis does not fully show the candle.
Please see the attached images.
As you can see, the biggest value of my last candle is 41.75, however,
the numberRange that is being used in VisibleRange Auto is 41.63.
Is there any way around this?
- rocket trade asked 2 months ago
Good day,
I am evaluating the use of scichart.js as a charting tool for our web dashboard in an offline environment. As a way of testing, I am currently trying to deploy the build of demo-create-react-app from the SDK on IIS. The build works if deployed using serve -s build but I get this error when I try to deploy the build on IIS.
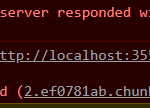
I would also like to confirm if Scichart.js can work in an offline environment since I saw in this forum post that SciChart gets the .wasm and .data files from the CDN.
- Yohann Gabrielle Ticzon asked 2 years ago
- last active 2 years ago
I have a top chart that is a heatmap and there is another bottom chart that is a temperature map. I want the heatmap not show any y-axis labels but still keep the x-axis start aligned from the left side. I tried turning off the y-axis lables (which I do not need in the heatmap), but that moves the heatmap to the left and not kept aligned with the bottom chart.
const yAxis = new NumericAxis(wasmContext, {

autoRange: EAutoRange.Always,

labelFormat: ENumericFormat.Decimal,

labelPrecision: 2,

labelPostfix: "C",

drawLabels: false

});
The above code hides the y-axis labels but also removes the space on the left side so the x-axis of both graphs does not remained aligned. I need a way to somehow keep the start of x-axis aligned for both top and bottom graphs.
- Joel Roberts asked 2 years ago
- last active 2 years ago
Hi,
I’m trying to synchronize the pie chart and the line chart in React. I’ve already done this for two line graphs.
They both use the same data table. And I want to know if it’s possible, if when I zoom in on the line chart, it updates the Pie chart with the new range.
Thanks, (sorry for my english ^^)
- thier tom asked 1 year ago
- last active 1 year ago
Is there a way to place AxisMarkerAnnotation on top of the gridline as shown in the attached images?
Here are some code to defined the xAxis:
xAxis.axisAlignment = EAxisAlignment.Bottom;
xAxis.drawLabels = true;
xAxis.labelStyle.fontFamily = "Roboto";
xAxis.labelStyle.fontSize = 12;
xAxis.labelStyle.alignment = ELabelAlignment.Left;
xAxis.autoRange = EAutoRange.Never;
xAxis.labelStyle.padding = new Thickness (0, 0, 0, 0);
Note: I’m aware that CustomAnnotation offers a better solution in placing the annotation into its designated position by setting y1 = 0. But I need the annotation to drag only around the xAxis, which can be done in AxisMarkerAnnotation so far.
- Suzanne Ong asked 5 months ago
- last active 4 months ago
Hi,
Is it possible to toggle the DataLabels dynamically in the chart? Setting some values to true or false like isVisible property.
- Mathew George asked 7 months ago
- last active 7 months ago
Hello!
What do these warnings mean to me? Do I need to react to them somehow? Maybe they are not always shown, but, for example, in developer mode?
- Roman Gavrilow asked 3 years ago
- last active 3 years ago
Hi, I noticed that Heattexture: [object Object] is logged hundreds/thousands of times while interacting with a heatmap. This isn’t my console log, as it is a very simple implementation and there are no logs on my front end, with nothing called Heattexture in my repository.
I’m guessing that this is a leftover console log that needs to be removed, as it occurs in both my development and production Webpack builds.
Most of the time it does not cause any performance issues, but once I did see the heatmap flickering at roughly the same rate of the console log.
Screenshot attached.
Thanks!
- Henrique Rodrigues asked 3 years ago
- last active 3 years ago
Good afternoon. Please tell me how can I change the Z index of the annotations so that the box annotation can overlap the text. Now no matter how I try to do it, the text is always above the rectangles. Does the JS version have some layers with annotations that can be changed by they Z like in this question – https://www.scichart.com/questions/wpf/changing-an-annotations-z-index
Unfortunately, I did not find this functionality in the JS version.
- Yevhenii Krasovskyi asked 8 months ago
- last active 7 months ago
I tried to use the trial version of SciChart with Next.js. But I got “SciChartSurface.setRuntimeLicenseKey is not a function” error. I don’t know what’s wrong, could you provide guideline for using SciChart with Next.js?
These are the codes in my next.config.js:
const CopyPlugin = require("copy-webpack-plugin");

/** @type {import('next').NextConfig} */
const nextConfig = {
  reactStrictMode: true,
  swcMinify: true,
  webpack: ( config, { buildId, dev, isServer, defaultLoaders, nextRuntime, webpack } ) => {
    config.plugins.push(
            new CopyPlugin({
                patterns: [
                    { from: "node_modules/scichart/_wasm/scichart2d.data", to: "" },
                    { from: "node_modules/scichart/_wasm/scichart2d.wasm", to: "" }
                ]
            })
        );
    return config;
  },
}

module.exports = nextConfig
And I have imported these files in pages/index.js
import {SciChartSurface} from "scichart/Charting/Visuals/SciChartSurface";
import {NumericAxis} from "scichart/Charting/Visuals/Axis/NumericAxis";
- Kelly Chan asked 2 years ago
- last active 2 years ago
Cant display any chart when init by SciChartSurface.create(HtmlElementId), how can I fix it ?
- test11111 123 asked 3 years ago
- last active 3 years ago
I’m looking for some direction on how to implement a modifier that reacts to interaction (mouse up/down etc) with a charts axis
- User clicks on axis
- Provide callback for side effect when clicked
Thanks
- Henrique Rodrigues asked 3 years ago
- last active 3 years ago
Hello,
I need to customize the text for some points on a XyScatterRenderableSeries graph. The problem is that the dataLabelProvider available for XyScatterRenderableSeries is BaseDataLabelProvider, but it doesn’t have a metaDataSelector method and I can’t do it with it. Interestingly, using LineSeriesDataLabelProvider I was able to add text for the points I needed using metadata, but another problem arose. In this case, if there is only one point on the graph, the text will not be drawn.
Here is a small example of how text is drawn for different numbers of points. https://codepen.io/PodaRocheK/pen/jOXYGMJ?editors=0011
Can you advise me on how to display text near points more correctly in the case when I use XyScatterRenderableSeries and often this text should disappear or appear near some points. Thanks a lot!
- Yevhenii Krasovskyi asked 7 months ago
- last active 7 months ago
I create custom annotation with nested input. In the code, I specify the autofocus property.
But autofocus only works once after page reload. With any manipulations with the chart (zoom, scrolling) – autofocus stops working.
Can you help me ?
- Taras Shevchenko asked 2 years ago
Scenario: user selects an area of a heatmap chart using a box annotation via a mouse drag.
I have created a custom modifier to draw the box annotation. I’ve used this as the basis: SimpleDataPointSelectionModifier.ts
My question is: how to I get the X axis start + end values and the Y axis start + end values based on the area of the annotation/mouse coordinates.
Thanks
- Henrique Rodrigues asked 3 years ago
- last active 3 years ago
I am having problem instantiating SciChart.js within a specific project and was hoping you might be able to help. To provide context I can run SciChart fine in simple projects and I suspect that I have a webpack issue.
When running a simple graph instantiation such as –
import React, { useEffect } from "react";
import ReactDOM from "react-dom";
import { SciChartSurface } from "scichart/Charting/Visuals/SciChartSurface";
import { NumericAxis } from "scichart/Charting/Visuals/Axis/NumericAxis";

export function MipsGraph(props) {
    useEffect(() => {
        initSciChart();
    });

    return (
        <div id="depthGraph" style={{height: "100%"}} ></div>
    );
}

async function initSciChart() {
    const { sciChartSurface, wasmContext } = await SciChartSurface.create("depthGraph");

    const xAxis = new NumericAxis(wasmContext);
    const yAxis = new NumericAxis(wasmContext);

    sciChartSurface.xAxes.add(xAxis);
    sciChartSurface.yAxes.add(yAxis);
}
I see the following error
Uncaught (in promise) RuntimeError: abort(TypeError:
WebAssembly.instantiate(): Import #0 module=”env” error: module is not
an object or function). Build with -s ASSERTIONS=1 for more info.
and the warning –
wasm streaming compile failed: TypeError: WebAssembly.instantiate():
Import #0 module=”env” error: module is not an object or function
The warning is raised at line 7544 (after pretty print in chrome dev tools) of scichart2d.js?formatted at a line calling WebAssembly.instantiateStreaming(e,d). both e and d have values.
Debugging originally led me to believe that there was an issue finding the scichart2d.wasm file however network traffic clearly shows the file being fetched.
Any ideas?
- Paul Hodgson asked 3 years ago
- last active 3 years ago
My application supports two themes (dark/light) for the charts. The background of the chart will be set to black if the dark mode is applied, and white if the light mode applied. It works well with the line chart. But there is strange grey background appeared in the heatmap chart when light mode is applied (Please check the attached screenshots). The color of gradient stop of offset 0 (min. heatmap zValues) is set to transparent and it works well with the dark mode. Do you know what’s wrong in my case?
Dark theme object applied to the chart:
{...new SciChartJSDarkTheme(), ...{
        sciChartBackground: "#1c1c1c",
        axisTitleColor: "#dee2e6",
        labelBorderBrush: "#dee2e6",
        tickTextBrush: "#dee2e6",
        majorGridLineBrush: "#1F3D68",
        minorGridLineBrush: "#102A47",
    }
Light theme object applied to the chart:
{...new SciChartJSLightTheme(), ...{
        sciChartBackground: "#fff",
        axisTitleColor: "#333",
        labelBorderBrush: "#333",
        tickTextBrush: "#333",
    }}
Heatmap graditentStops:
[
    { offset: 1, color: COLORS.DARK_RED },
    { offset: 0.8, color: COLORS.RED },
    { offset: 0.6, color: COLORS.YELLOW },
    { offset: 0.5, color: COLORS.GREEN },
    { offset: 0.4, color: COLORS.BLUE },
    { offset: 0.01, color: COLORS.DARK_BLUE },
    { offset: 0, color: "Transparent" },
]
- Quyen Sy asked 11 months ago
I am considering applying server-side licensing for my javerScript application.
In the document below, there is a phrase “Our server-side licensing component is written in C++.”
(https://support.scichart.com/index.php?/Knowledgebase/Article/View/17256/42/)
However, there is only asp.net sample code on the provided github.
(https://github.com/ABTSoftware/SciChart.JS.Examples/tree/master/Sandbox/demo-dotnet-server-licensing)
I wonder if there is a sample code implemented in C++ for server-side licensing.
Can you provide c++ sample code?
Also, are there any examples to run on Ubuntu?
- eddy trouchaud asked 1 year ago
- last active 1 year ago
We have implemented majorTick to make the x-axis only show the more important time, but we still have some problems that cannot be solved
-
The inter-day tick has been added to the majorTick, but it still often cannot be displayed. We need to display the inter-day tick first, not the last majorTick of the previous day
-
Even though I zoomed in to the enough width, it seems that the label of the cross-day tick is still not displayed. I can’t find the reason.
The following is a schematic video:
https://youtu.be/GklhvOo4dr4
Is there a way to make the specified tick/xValue/index have a higher display priority?
Thank you very much for your help
- chinghung lai asked 2 years ago
Error from chart in div chart1 Error: getNativeXValues is invalid for heatmap type series. Try getting or setting zValues instead
at UniformHeatmapDataSeries.BaseHeatmapDataSeries.getNativeXValues (BaseHeatmapDataSeries.js:430:1)
Help! Please!
- Alexandr Zhuk asked 2 years ago
- last active 2 years ago
Vertical Chart and pointMarker points are ploatted on somewhere on the canvas.
- Jerin Mathew asked 3 years ago
- last active 3 years ago
Hello,
How can I animate an update of a candle or a bar in an OHLC type charts? I use realtime stock chart like this example.
When i update candle it redraws immediately with new values. But i want it to be updated with animation.
- Vita Bubko asked 3 years ago
- last active 2 years ago
I have a chart with stacked xAxes, and I am trying to calculate the stackedLength of each xAxis base on the total length or width available for the xAxes.
The issue come when I am changing the size of the screen or changing the width of the chart using flex-basis. When I do that, I get the error message in the picture below.
My question is, is there a way for me to listen/subscribe to the width change or get the latest width?
- Nung Khual asked 9 months ago
- last active 9 months ago
Hi, I want to color the axis label by its value,
eg.
value < 0 -> show red color
value = 0 -> show gray color
value > 0 -> show green color
similar to this question, but in javascript platform, it seems the LabelProvider has function related to the value(string) formatting only. Is there any ways to styling the label? Thanks!
- chinghung lai asked 2 years ago
- last active 2 years ago
Hello,
I switched from NumericAxis to DateTimeNumericAxis to view x axis labels in hh:mm format. It is definitely showing the labels in this format which is what I wanted, but for some reason it always show “Jan 1” in the first label. I simply want to show hh:mm labels based on the X values. One thing to now is that this is a live updating chart, not static data.
What am I missing? attached is a picture showing the issue and a picture with the DateTimeNumericAxis configuration.
Thanks.
Sergio.
- Sergio Faura asked 3 months ago
- last active 2 months ago
I am implementing a heatmap. The data size of the heatmap would be changed. When the data size changed, I will replace the zValues of the UniformHeatmapDataSeries with an updated array. But it doesn’t work for me. The heatmap data cannot be plotted after I updated the zValues array. Below are my codes to create the heatmap and update the zValues array.
Draw heatmap:
    const { sciChartSurface, wasmContext } = await SciChartSurface.create("spectrogram-chart-root");
    let xAxisNumberRange = new NumberRange(minFreq/maxFreq);

    spectrogram_xAxis.current = new NumericAxis(wasmContext, {
        axisTitle: "Frequency",
        axisTitleStyle: {
            fontSize: CHART_STYLE.AXIS_FONT_SIZE,
            fontFamily: "sans-serif",
            fontWeight: "bold"
        },
        labelStyle: {
            fontSize: CHART_STYLE.LABEL_FONT_SIZE,
            fontFamily: "sans-serif"
        },
        visibleRange: xAxisNumberRange,
        visibleRangeLimit: xAxisNumberRange,
        zoomExtentsRange: xAxisNumberRange,
        labelFormat: ENumericFormat.Decimal,
        labelPrecision: 2,
        cursorLabelFormat: ENumericFormat.Decimal,
        cursorLabelPrecision: 2,
        drawMajorBands: false,
    });

    // Add XAxis and YAxis
    sciChartSurface.xAxes.add(spectrogram_xAxis.current);
    sciChartSurface.yAxes.add(new NumericAxis(wasmContext, { isVisible: false }));

    // Create a Heatmap Data-series. Pass heatValues as a number[][] to the UniformHeatmapDataSeries
    spectrogramZValues.current = Array.from(Array(SPECTROGRAM_HEIGHT), () => Array(SPECTROGRAM_WIDTH).fill(-200));
    heatmapDataSeries.current = new UniformHeatmapDataSeries(wasmContext, {
        xStart: 0,
        xStep: 1,
        yStart: 0,
        yStep: 1,
        zValues: spectrogramZValues.current
    });

    colorMap.current = new HeatmapColorMap({
        minimum: -200,
        maximum: -50,
        gradientStops: gradientStopsArr.current
    });

    // Create a Heatmap RenderableSeries with the color map. ColorMap.minimum/maximum defines the values in
    // HeatmapDataSeries which correspond to gradient stops at 0..1
    const heatmapSeries = new UniformHeatmapRenderableSeries(wasmContext, {
        dataSeries: heatmapDataSeries.current,
        useLinearTextureFiltering: true,
        isSorted: true,
        isEvenlySpaced: true,
        containsNaN: false,
        colorMap: colorMap.current
    });

    // Add heatmap to the chart
    sciChartSurface.renderableSeries.add(heatmapSeries);
Update heatmap data:
        // Update the chart x-axis
        if (xAxisUpdateRequired) {
            let xAxisNumberRange = new NumberRange(newStartFreq, newStopFreq);
            spectrogram_xAxis.current.visibleRange = xAxisNumberRange;
            spectrogram_xAxis.current.visibleRangeLimit = xAxisNumberRange;
            spectrogram_xAxis.current.zoomExtentsRange = xAxisNumberRange;

            // Reset the heatmap zValues
            heatmapDataSeries.current.clear();
            spectrogramZValues.current = Array.from(Array(SPECTROGRAM_HEIGHT), () => Array(newSampleSize).fill(-200));
            heatmapDataSeries.current.setZValues(spectrogramZValues.current);
        }
        // Update heatmap data
        spectrogramZValues.current.shift();
        spectrogramZValues.current.push(newSpecData);
        heatmapDataSeries.current.notifyDataChanged();
- Quyen Sy asked 12 months ago
- last active 12 months ago
Hello, I am using SciChartJS and have a new requirement from our users as follows that I need help with the implementation. Any pointers from anyone would be a great help.
**Requirements: **
- Assume that x-axis is Time and y-axis is prices.
- There are multiple series in the chart (e.g., Bid Price, Ask Price)
- Allow user to select a time on xAxis using
CTRL + CLICK - When the user selects the time, show the rollover line and the tooltip for all series at the selected time
- This rollover line and tooltip should remain visible until the user selects a new time on the x-axis at which point the rollover tooltip should display the tooltip for the new point.
I started inheriting the RolloverModifier but couldn’t find an appropriate method to show the tooltip.
So, I started implementing the above feature using CustomModifierBase2d and adding a VerticalLineAnnotation for the rollover line. But again, struggling with the tooltip.
If someone could help me out or give me pointers, that would be highly appreciated.
Best Regards,
Sachin Patel.
- sachin patel asked 9 months ago
- last active 8 months ago
Hello I have been having a difficult time getting the correct time displayed on my xAxis and labels.
Passing in an xValue to an OHLC data series of 60 and the setting cursorLabelFormat: ENumericFormat.Date_DDMMHHMM this should produce a label “01/01 00:01” With the year as 1970.
When the computers timezone is set to UTC + 0 this behaves as expected.
However when the computers timezone is set to anything negative (UTC – 7) the label is formatted as “31/12 00:01” with the year 1969. If scichart is trying to convert to local time I would expect a reading of “31/12 17:01” 1969.
And when the timezone is set to anything positive (UTC + 7) the label is formatted as it is UTC +0 “01/01 00:01” 1970 again I would expect the hour to corrispond to the UTC offset if scichart is trying to convert to local time.
Looking at the later case I would assume that no time conversion is taking place which is what I would prefer. But looking at the former case (UTC -X) there appears to be some manipulation happening somewhere, I just have not been able to find any documentation explaining this. Am I missing something to get this to work properly out of the box without a custom label provider?
Thank you,
Update:
I do not want to worry about timezones. I want sciChart to plot the time that I give it. Again this is acting as expected when the computer timezone is in anything greater than UTC 0. But when the computer timezone is less than UTC 0 the label and axes are showing a date 24 hours prior to what I give it.
See attached images for the error. Note the only change that is happening is changing the computer timezone from UTC – 4 to UTC + 4.
See below for code setting up the chart.
Why is changing the computer timezone affecting the data labels?
export async function example(element) {
    let { sciChartSurface, wasmContext } = chartInstances.hasOwnProperty(element.id) && chartInstances[element.id];

    // initialize sciChart and add created chart to chartInstances
    if (sciChartSurface === undefined) {
        const newContext = await SciChartSurface.create(element.id);
        sciChartSurface = newContext.sciChartSurface;
        wasmContext = newContext.wasmContext;
        chartInstances[element.id] = { sciChartSurface, wasmContext };
    }

    //create and add xAxis
    let xAxis = new CategoryAxis(wasmContext, {
        drawLabels: true,
        drawMajorTickLines: true,
        drawMinorTickLines: true,
        axisAlignment: EAxisAlignment.Bottom,
        autoRange: EAutoRange.Once,
        cursorLabelFormat: ENumericFormat.Date_DDMMHHMM,
        labelFormat: ENumericFormat.Date_DDMMYYYY,
    });

    sciChartSurface.xAxes.add(xAxis);

    //create and add yAxis
    let yAxis = new NumericAxis(wasmContext, {
        maxAutoTicks: 5,
        autoRange: EAutoRange.Always,
        growBy: new NumberRange(0.3, 0.11),
        axisAlignment: EAxisAlignment.Right,
        labelPrecision: 4
    });
    sciChartSurface.yAxes.add(yAxis);

    //add chart modifiers
    sciChartSurface.chartModifiers.add(new ZoomPanModifier({ xyDirection: EXyDirection.XDirection }));
    sciChartSurface.chartModifiers.add(new ZoomExtentsModifier({ xyDirection: EXyDirection.XDirection }));
    sciChartSurface.chartModifiers.add(new MouseWheelZoomModifier({ xyDirection: EXyDirection.XDirection }));
    sciChartSurface.chartModifiers.add(new RolloverModifier({ modifierGroup: "first", showTooltip: false }));
    sciChartSurface.chartModifiers.add(new CursorModifier(
        {
            crosshairStroke: "#9598a1",
            crosshairStrokeDashArray: [10, 5],
        }));

    //apply desired theme
    sciChartSurface.applyTheme(new SciChartJSDarkTheme());

    //create three bars
    _ohlcDataSeries = new OhlcDataSeries(wasmContext, {
        xValues: [60,120,180], //1 min, 2 min, 3 min post epoch
        openValues: [10,10,10],
        highValues: [15,15,15],
        lowValues: [5,5,5],
        closeValues: [11,11,11],
        dataSeriesName: "PriceDataSeries"
    });

    //create and style fastCandRendSeries
    const fcRendSeries = new FastCandlestickRenderableSeries(wasmContext,
        {
            dataSeries: _ohlcDataSeries,
            strokeThickness: 1,
            dataPointWidth: 0.5,
            brushUp: "#50ff50B2",
            brushDown: "#ff5050B2",
            strokeUp: "#50ff50",
            strokeDown: "#ff5050",
            animation: new WaveAnimation({ fadeEffect: true, duration: 800 })
        });
    sciChartSurface.renderableSeries.add(fcRendSeries);
}
- Leland asked 2 years ago
- last active 2 years ago
Hello,
Can you show this example(https://codepen.io/PodaRocheK/pen/yLGxGEL?editors=0011) and tell me, why metadata labels are not displayed in some cases? May be you can tell me how to do it correctly? A have similar chart with a lot of datapoints and can’t understand why labels show only in some time(20s or > 1m after start the chart)
Thank you!
- Yevhenii Krasovskyi asked 6 months ago
- last active 6 months ago
Hi,
Our website is running on a web hosting service supported by the university. To work with the SciChart JS, do we have to install the npm and configure it accordingly? If so, we probably have to contact IT department for assistance, since we don’t have permission to do so.
Please advise. Thanks.
- Gang Xu asked 3 years ago
- last active 9 months ago
Hello Scichart Team again,
I’m trying to replicate anything like this (check Screenshot_2.png).
I can update the scichart background, but I just wanted to have a single color in the background, but it seems that there is an overlap of colors in X / Y as I show in the next printscreen (check Screenshot_3.png)
How I can solve this?
Waiting for feedback.
Many thanks,
Pedro Cruz
- Ricardo Diz asked 3 years ago
- last active 3 years ago
What languages are wrappers for the licensing server in? Where can I get information on what c++ functions to call?
- Ryan Campo asked 2 years ago
- last active 2 years ago
I am trying to build my application with Electron. When the Electron application is run, it will open the UI in the browser (not opened with chromium). I created two Electron applications with same codes but with different versions of SciChart (i.e. version 2 and version 3). When I run with the Electron application with SciChart v2, the SciChart can be loaded properly. When when I run the Electron application with SciChart v3, I got error (please refer to the screenshot) and the SciChart cannot be loaded. I am not sure what’s wrong. Do you have any idea?
- Quyen Sy asked 1 year ago
- last active 1 year ago
The project is developed on SciChart JS.
The x axis is date time numeric and y axis is numeric.
There is a option for the user to select the x axis interval. The interval values are 5 Min, 10 Min, 15 Min, 30 Min, 1 Hour, 6 Hour, 12 Hour, Days, Weeks, Months & Years.
When the user the selects a interval in the select option, the x axis should be updated with the selected interval.
For Example, If the user selects the 5 Min in the select option, then the x axis interval should be 5 Min.
For 5 Min X Axis Interval
16-Jan-2023 07:00
16-Jan-2023 07:05
16-Jan-2023 07:10
16-Jan-2023 07:15
16-Jan-2023 07:20
16-Jan-2023 07:25
16-Jan-2023 07:30
For 1 Hour X Axis Interval
16-Jan-2023 07:00
16-Jan-2023 08:00
16-Jan-2023 09:00
16-Jan-2023 10:00
16-Jan-2023 11:00
16-Jan-2023 12:00
16-Jan-2023 13:00
16-Jan-2023 14:00
So let me know how to change the interval in the x axis (date time numeric) based on the selection.
I have attached the zip file which contains the HTML file.
- Leo Leslin asked 1 year ago
- last active 5 months ago
On Vertical chart Label overlapping on smaller height. I have tried maxAutoTicks also and on the lower height, it’s getting one error. This error is occurring when the width is 0 sometimes. Can you please check this issues?
- Jerin Mathew asked 3 years ago
- last active 3 years ago
Is there a test demo that was done using SciChart WPF 2D.
- linxi zheng asked 1 year ago
- last active 1 year ago
If the y axis values are same then the lines are not visible on the chart and the labels are also not visible on the chart. Can you draw the lines on the middle of the chart to get more visible?
async initTrack() {
  const { wasmContext, sciChartSurface } = await SciChartSurface.create(
    "chart" + this.element
  );
  sciChartSurface.xAxes.add(
    new NumericAxis(wasmContext, { axisAlignment: EAxisAlignment.Top })
  );
  sciChartSurface.yAxes.add(
    new NumericAxis(wasmContext, {
      axisAlignment: EAxisAlignment.Left
    })
  );

  const dataSeries = new XyDataSeries(wasmContext);
  for (let i = 0; i <= 1000; i++) {
    dataSeries.append(i, 10);
  }

  const rendSeries = new FastLineRenderableSeries(wasmContext, {
    dataSeries: dataSeries,
    strokeThickness: 1,
    stroke: "red"
  });
  sciChartSurface.renderableSeries.add(rendSeries);
  sciChartSurface.chartModifiers.add(cursorModifier);

  return { wasmContext, sciChartSurface };
}
- Arun Surendran asked 3 years ago
- last active 3 years ago
Hi,
DataLabels Not Displaying in all cases in flippedCoordinates. Based on values only its showing. I have created a sample application with some dummy data.
- First Series is showing the labels properly
- If the first value in array changed then it will show the value.
- If all values are 0 then also its not showing the label.
Can you check the attached file for the sample code.
When the chart is not flipped then its works fine when i am checking.
- Mathew George asked 7 months ago
- last active 7 months ago
I updated schichart to the very last version and turn on the memory usage debug mode to see if there are any memory leaks in our application and ran into the following problem.
When MemoryUsageHelper.isMemoryUsageDebugEnabled = true; and sciChartSurface has the following modifiers(RolloverModifier, CursorModifier) when moving the mouse over the chart I have the following console warnings.
From RolloverModifier instance

From CursorModifier instance

The message below is written on your docs about debugging, so I gues this is the case with the chart modifiers console warnings.
Usually this boils down to failing to call SciChartSurface.delete() (or series.delete(), annotation.delete() when adding/removing objects) or plain JavaScript memory leaks where references to SciChart are held in the customer application & not garbage collected by the browser.
Steps To Reproduce
- Follow the codesandbox example by the link https://codesandbox.io/s/ts-band-chart-xwlxcm?file=/src/App.tsx;
- Once the chart is loaded and rendered, try moving the mouse cursor over the chart;
- Open the browser console ⇒ You will see the warnings I wrote about above.
The current behavior
Moving the mouse over the chart causes warning logs to appear in the browser console and possibly memory leaks.
The expected behavior
No warning logs while moving the mouse over the chart.
- Sergey Chernyakov asked 8 months ago
- last active 8 months ago
Hi,
I’ve got some questions to expand on this topic: https://www.scichart.com/questions/js/how-do-you-export-or-save-a-chart-as-an-image-in-js-library
1) Can you export areas of a chart that are not visible on the screen? I have a large line chart, like a seismograph, that is never fully displayed on the screen because it is too long.
2) Can you export from a chart that is not visible on the screen?
Thank you
- max keirn asked 2 weeks ago
- last active 2 weeks ago
I used NPM to complete the deployment and development validation of SCICHART JS, and I completed the demo as follows:
At present, I have two unresolved issues that we will make a purchase decision after they are resolved:
1、How to set the sampling rate for chart?
Using the wpf control, the sampling rate can be set through the “FifoCapacity” property of XyDataSeries, but I did not find this property in the JS control.
2、How to hide the preview of the SciChartOverview control?
I don't want to display the data of the bound chart
- max tu asked 12 months ago
- last active 12 months ago
I am adding a LegendModifier to display legends for my chart as below:
_sciChartSurface.chartModifiers.add(new SciChart.LegendModifier({ showCheckboxes: true }));
My legend currently looks like the below, with very poor legend visibility:
![enter image description here][1]
I want to know how to set this legend to be opaque so that the labels may be seen clearly. What would be event better would be to just have a constant class for my legend collection (perhaps .sciChartLegendsContainer or whatever) so that I can apply my own css styling myself, without having to hack around with javascript.
Thanks
- Malcolm Geddes asked 3 years ago
- last active 3 years ago
Hi,
I am facing a issue with RolloverModifier. I have multiple charts in single window. For some points the lines over the chart are missing.
Please find the attached images for some examples and the code for reproduce the issue. on the attachment you can see that the line on some chart is missing when mouse on left and right corner area of the chart.
Posting again because on latest version also the same issue not resolved.
https://www.scichart.com/questions/js/rollovermodifier-in-multiple-chart-line-missing-on-some-areas
- Arun Surendran asked 2 years ago
- last active 2 years ago
Hello, how do I remove the shadow from tooltips, generated by the VerticalSliceModifier?
Thanks!
- Michael Geronimo asked 5 months ago
- last active 5 months ago
