Hello,
I am trying out SciCharts and am looking to recreate the example 3D uniform surface mesh chart example and don’t have a good hold on the architecture yet. I don’t see directions as to which file to paste the example code into. I’m looking at the code example where it creates a “final camera3D camera – schiChart3DBuilder.newCamera3D().build();” and goes from there. (…/webframe.html#The%20Surface%20Mesh%203E%20Chart%20Type.html)
I have the 3D surface created and rendering. I just need to get started to go from there. Thank you.
- Christy Lott asked 2 years ago
- last active 2 years ago
ZoomPanModifier date format charts zoom out continuously then showing NaN on the scale. It happened because the zoom level goes under the invalid date. Can you add the Minimum Zoom/Pan and Maximum Zoom/Pan area to be configured on options?
- Arun Surendran asked 3 years ago
- last active 3 years ago
Hi,
Our website is running on a web hosting service supported by the university. To work with the SciChart JS, do we have to install the npm and configure it accordingly? If so, we probably have to contact IT department for assistance, since we don’t have permission to do so.
Please advise. Thanks.
- Gang Xu asked 3 years ago
- last active 9 months ago
Is it possible to display the values always on the chart.
- Arun Surendran asked 2 years ago
- last active 2 years ago
I am using the MouseWheelZoomModifier and ZoomExtentsModifier on the line chart. Beside double clicking the chart area to Zoom Extents the chart, I would like to add a button outside the chart and this button will trigger the Zoom Extents. Is it possible to do it?
- Kelly Chan asked 1 year ago
- last active 1 year ago
I have a real time updated chart with very large data size and I am facing the slow client problem. i.e. The data sending speed is faster than the data receiving and handling speed which causes memory growing up issue. I am trying to use Web Workers to increase the data handling speed in frontend. I have found a related post:
https://www.scichart.com/questions/wpf/is-xydataseries-safe-to-being-changed-in-a-separate-thread
It seems possible to update XyDataSeries in the background thread with WPF. My UI is built with NextJS. I tried to use Web Workers to implement multiple threads. But I found that it can’t pass the SciChartSurface or XyDataSeries to the worker thread. Could you show me an example on how to update XyDataSeries in the worker thread with Web Workers?
- Quyen Sy asked 1 year ago
- last active 1 year ago
I tried to apply offset on the data in a live updating multiple lines chart. But it doesn’t work for me. Below are my codes for adding trace and updating data:
Add a trace to the chart without data in the beginning:
const xyDataSeries = new XyDataSeries(wasmContext);
const offsetFilter = new XyScaleOffsetFilter(xyDataSeries, { scale: 1, offset: 50 });
let trace1 = new FastLineRenderableSeries(wasmContext, {
    type: ESeriesType.LineSeries,
id: 1,
stroke: #333,
strokeThickness: 1,
dataIsSortedInX: true,
dataEvenlySpacedInX: true,
containsNaN: false,
dataSeries: offsetFilter,
});
sciChartSurface.renderableSeries.add(trace1);
Update chart data later:
sciChartSurface.renderableSeries.items.forEach(serie => {
    serie.dataSeries.clear();
serie.dataSeries.appendRange(dataX, dataY);
});
I can’t see the offset 50 applied on the chart data. Not sure what’s wrong with my codes.
- Quyen Sy asked 1 year ago
- last active 1 year ago
Hi,
When we published the product of Test Domain, a black rectangle will appear in the SciChart line graph. How should we avoid it?
The tester told me he was reluctant to update to Production Domain in this situation.
Thank for your help
- chinghung lai asked 2 years ago
Good afternoon. My team and I are looking at your library to create a depth chart, like here, but have run into a few problems:
1. if we have, for example, a “buySeries” array larger than the “sellSeries” array, the graph is not drawn very nicely.
2. the labels are not drawn correctly when we have too small numbers, I tried to solve the problem with xAxis.textFormatting = ‘0.#####’ or ‘0.00###’, but that doesn’t work for some reason.
3. If we want to add labels while hovering over the chart with showLabel = true , then we get 4 labels, two on yAxis. is it possible to make the buySeries label appear only on the left, for example, and the sellSeries label only on the right? (second screenshot)
- Andrew Smidth asked 1 year ago
- last active 1 year ago
Hello,
Can you show this example(https://codepen.io/PodaRocheK/pen/yLGxGEL?editors=0011) and tell me, why metadata labels are not displayed in some cases? May be you can tell me how to do it correctly? A have similar chart with a lot of datapoints and can’t understand why labels show only in some time(20s or > 1m after start the chart)
Thank you!
- Yevhenii Krasovskyi asked 6 months ago
- last active 6 months ago
Hi,
I’ve been trying to customize the RolloverModifier tooltip content with a vertical chart but am at a loss to try to get the format I need. I’d like to take in all the series info and display them in a tooltip together with a small icon and the y-value next to this.
I was able to do this in the CursorModifier content but unable to do so in the RolloverModifier which is what I really want to use.
I’ve included a CodeSandbox link below showing the custom SVG template and output on the CursorModifier I’d like to use for the RolloverModifier. Is this type of output template possible?
Thanks in advance!
- Craig Wendel asked 1 year ago
- last active 1 year ago
I think this question has come up before, but is it possible to render a logarithmic axis in the JS library? If not, is this on the roadmap (and when)?
- Paul Crouch asked 3 years ago
- last active 3 years ago
I encountered an exception inside scichart2d.js when I used hitTestProvider.hitTest.
getHitTestInfo(idx, e) {
let touch0 = e.targetTouches[0];
let rect = e.currentTarget.getBoundingClientRect();
let x = parseInt(touch0.pageX - rect.left);
let y = parseInt(touch0.pageY - rect.top);
const premultipliedX = x * DpiHelper.PIXEL_RATIO;
const premultipliedY = y * DpiHelper.PIXEL_RATIO;
let lineSeries = this.$store.state.components.scitchart.sciObj[idx].sciChartSurface.renderableSeries.items[0];
console.log(`lineSeries.hitTestProvider.hitTest(${premultipliedX}, ${premultipliedY}, ${DpiHelper.PIXEL_RATIO})`);
let result = lineSeries.hitTestProvider.hitTest(premultipliedX, premultipliedY, DpiHelper.PIXEL_RATIO);
return result;
}
The video URL is as follows
https://youtu.be/3GIlv_ldorY
- chinghung lai asked 2 years ago
- last active 2 years ago
Good day,
I am evaluating the use of scichart.js as a charting tool for our web dashboard in an offline environment. As a way of testing, I am currently trying to deploy the build of demo-create-react-app from the SDK on IIS. The build works if deployed using serve -s build but I get this error when I try to deploy the build on IIS.
I would also like to confirm if Scichart.js can work in an offline environment since I saw in this forum post that SciChart gets the .wasm and .data files from the CDN.
- Yohann Gabrielle Ticzon asked 2 years ago
- last active 2 years ago
I need to set range for stock chart from some records(first today’s record, first record of day before yesterday, etc for week, month, start of current year and the first record of chart) to last record.
To set the range i need to get indexes of this rows. Tell me please how can i do this for stock xValues. May be i can mark some records to find if faster or i need to check every records from 0 to MAX and then select the range?
Thank you!
- Yevhenii Krasovskyi asked 10 months ago
- last active 10 months ago
Implementation scenario: multiple polylines are displayed. After clicking the polyline, the name of the polyline is displayed in the icon.
Question: I can get the Series Name through the SeriesSelectionModifier now, but I don’t know how to display the Series Name in the chart when the user clicks a polyline. Is there a corresponding API?
- js scichart asked 1 year ago
- last active 1 year ago
When hardware acceleration is not enabled from the client side i am getting the follwong error in the console and the chart becomes empty.
Can we have a caetain fallback ui for this error so that when hardware acceleration is disabled we can show some error in the client side instead of frozen screen
- Saksham Jaiswal asked 1 year ago
- last active 1 year ago
Hi,
I am trying to get my chart to scroll together with my other HTML elements but have not been successful. Referring to the screenshot attached, if I were to disable the position:absolute style the chart is then able to scroll with the HTML elements if not, whenever I scroll the other HTML elements would scroll but the Chart will stay in its position.
Is there property that I can set on the chart to disable the absolute position?
- yeung weng thong asked 3 years ago
- last active 3 years ago
I am trying to change the format of CursorModifier
sciChartSurface.chartModifiers.add(
  new CursorModifier({
    modifierGroup: 'Chart',
    showAxisLabels: true,
    showTooltip: false,
    showYLine: false,
    showXLine: true,
  })
);
I have a custom DateLabelProvider for the xAxis that return dates in this format ‘MM/dd HH:mm’ but the CursorModifier tooltip is showing the ‘MM/dd/YYYY’ format, how can I change it?
- Jhonatan Laguna asked 3 months ago
- last active 3 months ago
If I have a use case, where heatmap data can be sparse in time, and I’m zooming around and panning trough the chart, it is quite possible to end up missing heatmap data, because at certain zoom levels, the heatmap lines just disappear.
Any tips to make this not happen?
Codepen showing the issue: https://codepen.io/jrfv/full/KKbrBdN
Make sure to zoom out slowly, and/or pan around, you should see one, or both lines disappearing.
I would post a video, but doesn’t seem to be allowed here, I’ll post 2 images at slightly different zoom levels then
- João Velasques asked 7 months ago
- last active 7 months ago
I want to build a column chart but I got the following error:
ERROR TypeError: Cannot read property ‘append’ of undefined
The error happened in line #42.
My code:
export class OutputAmplitudeComponent implements OnInit, OnDestroy {

constructor(@Inject(SETTING_SERVICE) private settingService: SettingService, private cdr: ChangeDetectorRef) {}

ngOnInit() {
                this.settingService.registerSetting(HarmonicAmpSetting).pipe(takeUntil(this.ngUnsubHarmonicData)).subscribe(setting => {
                    const OutputAmplitudeData = setting.value;

                    for (let x = 1; x < this.numberOfOutput; x++) {
                        if (this.OutputMode === 'Voltage') {
                            if (phaseNum === 1) {
                                this.ampSource.data[x-1].voltage1 = OutputAmplitudeData[x];
                            } else if (phaseNum === 2) {
                                this.ampSource.data[x-1].voltage2 = OutputAmplitudeData[x];
                            } else if (phaseNum === 3) {
                                this.ampSource.data[x-1].voltage3 = OutputAmplitudeData[x];
                            }
                        } else if (this.OutputMode === 'Current') {
                            if (phaseNum === 1) {
                                this.ampSource.data[x-1].current1 = OutputAmplitudeData[x];
                            } else if (phaseNum === 2) {
                                this.ampSource.data[x-1].current2 = OutputAmplitudeData[x];
                            } else if (phaseNum === 3) {
                                this.ampSource.data[x-1].current3 = OutputAmplitudeData[x];
                            }
                        }

                    }
                    this.updateData();
                });
                this.sciChartInit();
            }

updateData(){
    var phaseNum1 = [];
    var xData = [];
    for (let x = 1; x < this.numberOfOutput; x++) {
        if (this.ampSource.data != null && this.ampSource.data[x-1] != null) {
            phaseNum1[x - 1] = parseFloat(this.ampSource.data[x - 1].voltage1);
            xData[x - 1] = x;
            if (!isNaN(phaseNum1[x - 1])) {
                this.dataSeries1.append(x,x);
            } else {
                console.log("No num");
            }
        }
    }
}

async sciChartInit() {

    const { wasmContext, sciChartSurface } = await SciChartSurface.create("chart");

    var phaseNum1 = [];
    var xData = [];
    this.dataSeries1 = new XyDataSeries(wasmContext);
    for (let x = 1; x < this.numberOfOutput; x++) {
        this.dataSeries1.append(x, x);
    }

    const xAxis = new NumericAxis(wasmContext);
    sciChartSurface.xAxes.add(xAxis);
    const yAxis = new NumericAxis(wasmContext);
    sciChartSurface.yAxes.add(yAxis);

    const rendSeries1 = new StackedColumnRenderableSeries(wasmContext);
    rendSeries1.fill = "#dc443f";
    rendSeries1.stroke = "green";
    rendSeries1.strokeThickness = 1;
    rendSeries1.dataSeries = this.dataSeries1;
    rendSeries1.stackedGroupId = "one";

    const verticallyStackedColumnCollection = new StackedColumnCollection(wasmContext);
    verticallyStackedColumnCollection.dataPointWidth = 0.5;
    verticallyStackedColumnCollection.add(rendSeries1);
    verticallyStackedColumnCollection.animation = new ScaleAnimation({ duration: 1000, fadeEffect: true });

    sciChartSurface.renderableSeries.add(verticallyStackedColumnCollection);
    sciChartSurface.chartModifiers.add(new ZoomExtentsModifier(), new ZoomPanModifier(), new MouseWheelZoomModifier());
    sciChartSurface.zoomExtents();

    sciChartSurface.chartModifiers.add(
        new LegendModifier({
            placement: ELegendPlacement.TopRight,
            orientation: ELegendOrientation.Horizontal,
            showLegend: true,
            showCheckboxes: true,
            showSeriesMarkers: true
        })
    );
    return { wasmContext, sciChartSurface };
}}
I don’t understand what is undefined and why.
Thank you.
- ETS Ong asked 3 years ago
- last active 3 years ago
Hello everyone,
I have 2 HorizontalLineAnnotations on the chart as price indicators. Sometimes i need to add to some label more data on the second line of the text. You can see example of correct annotation’s label. How can i add ‘\n’ or ‘
‘ to the text for such result?
Thank you a lot!
- Yevhenii Krasovskyi asked 6 months ago
- last active 4 months ago
I have been trying to integrate Scichart JS in my Ionic 5 (Capacitor) application, but didn’t get succeed on that. I really need help on that
- Subham Dandapat asked 3 years ago
- last active 3 years ago
Hello I have been having a difficult time getting the correct time displayed on my xAxis and labels.
Passing in an xValue to an OHLC data series of 60 and the setting cursorLabelFormat: ENumericFormat.Date_DDMMHHMM this should produce a label “01/01 00:01” With the year as 1970.
When the computers timezone is set to UTC + 0 this behaves as expected.
However when the computers timezone is set to anything negative (UTC – 7) the label is formatted as “31/12 00:01” with the year 1969. If scichart is trying to convert to local time I would expect a reading of “31/12 17:01” 1969.
And when the timezone is set to anything positive (UTC + 7) the label is formatted as it is UTC +0 “01/01 00:01” 1970 again I would expect the hour to corrispond to the UTC offset if scichart is trying to convert to local time.
Looking at the later case I would assume that no time conversion is taking place which is what I would prefer. But looking at the former case (UTC -X) there appears to be some manipulation happening somewhere, I just have not been able to find any documentation explaining this. Am I missing something to get this to work properly out of the box without a custom label provider?
Thank you,
Update:
I do not want to worry about timezones. I want sciChart to plot the time that I give it. Again this is acting as expected when the computer timezone is in anything greater than UTC 0. But when the computer timezone is less than UTC 0 the label and axes are showing a date 24 hours prior to what I give it.
See attached images for the error. Note the only change that is happening is changing the computer timezone from UTC – 4 to UTC + 4.
See below for code setting up the chart.
Why is changing the computer timezone affecting the data labels?
export async function example(element) {
    let { sciChartSurface, wasmContext } = chartInstances.hasOwnProperty(element.id) && chartInstances[element.id];

    // initialize sciChart and add created chart to chartInstances
    if (sciChartSurface === undefined) {
        const newContext = await SciChartSurface.create(element.id);
        sciChartSurface = newContext.sciChartSurface;
        wasmContext = newContext.wasmContext;
        chartInstances[element.id] = { sciChartSurface, wasmContext };
    }

    //create and add xAxis
    let xAxis = new CategoryAxis(wasmContext, {
        drawLabels: true,
        drawMajorTickLines: true,
        drawMinorTickLines: true,
        axisAlignment: EAxisAlignment.Bottom,
        autoRange: EAutoRange.Once,
        cursorLabelFormat: ENumericFormat.Date_DDMMHHMM,
        labelFormat: ENumericFormat.Date_DDMMYYYY,
    });

    sciChartSurface.xAxes.add(xAxis);

    //create and add yAxis
    let yAxis = new NumericAxis(wasmContext, {
        maxAutoTicks: 5,
        autoRange: EAutoRange.Always,
        growBy: new NumberRange(0.3, 0.11),
        axisAlignment: EAxisAlignment.Right,
        labelPrecision: 4
    });
    sciChartSurface.yAxes.add(yAxis);

    //add chart modifiers
    sciChartSurface.chartModifiers.add(new ZoomPanModifier({ xyDirection: EXyDirection.XDirection }));
    sciChartSurface.chartModifiers.add(new ZoomExtentsModifier({ xyDirection: EXyDirection.XDirection }));
    sciChartSurface.chartModifiers.add(new MouseWheelZoomModifier({ xyDirection: EXyDirection.XDirection }));
    sciChartSurface.chartModifiers.add(new RolloverModifier({ modifierGroup: "first", showTooltip: false }));
    sciChartSurface.chartModifiers.add(new CursorModifier(
        {
            crosshairStroke: "#9598a1",
            crosshairStrokeDashArray: [10, 5],
        }));

    //apply desired theme
    sciChartSurface.applyTheme(new SciChartJSDarkTheme());

    //create three bars
    _ohlcDataSeries = new OhlcDataSeries(wasmContext, {
        xValues: [60,120,180], //1 min, 2 min, 3 min post epoch
        openValues: [10,10,10],
        highValues: [15,15,15],
        lowValues: [5,5,5],
        closeValues: [11,11,11],
        dataSeriesName: "PriceDataSeries"
    });

    //create and style fastCandRendSeries
    const fcRendSeries = new FastCandlestickRenderableSeries(wasmContext,
        {
            dataSeries: _ohlcDataSeries,
            strokeThickness: 1,
            dataPointWidth: 0.5,
            brushUp: "#50ff50B2",
            brushDown: "#ff5050B2",
            strokeUp: "#50ff50",
            strokeDown: "#ff5050",
            animation: new WaveAnimation({ fadeEffect: true, duration: 800 })
        });
    sciChartSurface.renderableSeries.add(fcRendSeries);
}
- Leland asked 2 years ago
- last active 2 years ago
Do you have any examples with configurating sci chart component in asp.mvc project. Ideally I’d not want to use any of the node.js pipeline and I just want to add set of javascript files to my project.
- Lukasz Drzewiecki asked 3 years ago
- last active 3 years ago
I have a huge dataset to display in graphical form starting from the daily data for 30 days and then to each minute when zoom in, what is the best way to plot this data using zoom in functionality
- Umer Nawaz asked 1 year ago
- last active 1 year ago
Hi,
the Tooltip from the rolloverModifier shows for the Open-Values the Label “Open”.
I would like to be able to change that. There might be serveral reasons for that. Maybe the shown data are not “openValues” or the word “open” needs to be translated into another language.
I managed to edit the title of a FastCandlestickRenderableSeries by setting a title and get it into the variable like this:
rolloverTitle = newtitle;
renderableSeries0.rolloverModifierProps.tooltipTitle = rolloverTitle;
unfortunately i did not find a way to set the name/label for the open-,low-,close-, or high-values of this Series.
Can someone give ma a hint how to do this?
- Sebastian Affeld asked 8 months ago
- last active 8 months ago
A client responded that the line diagram drawn by scient.js on the mobile phone could not be seen.
We follow the user’s log and find that there is such content
2022/09/21 07:02:27.981 exception thrown: RuntimeError: function signature mismatch,RuntimeError: function signature mismatch
            at <anonymous>:wasm-function[2101]:0x5fc72
            at <anonymous>:wasm-function[1355]:0x2a029
            at <anonymous>:wasm-function[2409]:0x7ef3a
            at Ch (<anonymous>:wasm-function[4028]:0x12f27f)
            at r._main (<anonymous>:16:687711)
            at Object.Ma [as callMain] (<anonymous>:16:688823)
            at <anonymous>:16:565075

2022/09/21 07:02:27.981 Could not load SciChart WebAssembly module.
            Check your build process and ensure that your scichart2d.wasm, scichart2d.data and scichart2d.js files are from the same version
.
We try to reproduce many different devices. At present, it seems that only the device will happen. The following is the information of the device
- chinghung lai asked 2 years ago
- last active 1 year ago
I have two charts in my app. Is there a way that I can make a rollover tooltip on a heatmap chart and the x visible range updates accordingly on another chart when the cursor moving around on the heatmap?
I had this function in Android version with the method InternalUpdate from CustomHeatmapTooltip which extended from UniformHeatmapTooltip. I wonder if there’s a listener for the tooltip.
Thanks.
- Gang Xu asked 2 years ago
- last active 1 year ago
Hello
I have a use case where annotations are draggable and on drag i am making api call to fetch updated data and resetting the the DataSeries.
I am clearing annotations once i get updated data but it is just clearing the svg annotation nodes from dom but not the hit test context (point focus) on wasm side.
Please look at the attached screenshot and suggest something
Thanks
Vamsi
- vamsi kunchaparthi asked 3 years ago
- last active 3 years ago
Error from chart in div chart1 Error: getNativeXValues is invalid for heatmap type series. Try getting or setting zValues instead
at UniformHeatmapDataSeries.BaseHeatmapDataSeries.getNativeXValues (BaseHeatmapDataSeries.js:430:1)
Help! Please!
- Alexandr Zhuk asked 2 years ago
- last active 2 years ago
Is there a way to get discreet colormap for the heatmap? currently no matter how many or how few colors are defined in the colormap table it always adds a gradient. how can we get a discreet ranges for colormap?
Thanks
- pramod butte asked 7 days ago
- last active 15 hours ago
I need to set VerticalLineAnnotations without a label.
My setting is:
const verticalLineAnnotation = new VerticalLineAnnotation({

stroke: "ff2626",

strokeThickness: 3,

x1: -1,

showLabel: false,

isEditable: true,

isHidden: true

});
When the user needs the annotation the VerticalLineAnnotation is made visible by setting isHidden = false. After setting it to false an exception is thrown with following content: “TypeError: Cannot read properties of undefined (reading ‘left’)”.
- René Völkel asked 2 years ago
- last active 2 years ago
I have a bubble chart with EllipsePointMarker as pointMarker and a custom palette provider to set the colors of the markers. I need to set a stroke in one of the markers but doesn’t matter what value I return as a stroke value from the overridePointMarkerArgb function, the stroke isn’t applied. Am I missing something?
- Evandro Cascaes asked 8 months ago
- last active 8 months ago
I am having problem instantiating SciChart.js within a specific project and was hoping you might be able to help. To provide context I can run SciChart fine in simple projects and I suspect that I have a webpack issue.
When running a simple graph instantiation such as –
import React, { useEffect } from "react";
import ReactDOM from "react-dom";
import { SciChartSurface } from "scichart/Charting/Visuals/SciChartSurface";
import { NumericAxis } from "scichart/Charting/Visuals/Axis/NumericAxis";

export function MipsGraph(props) {
    useEffect(() => {
        initSciChart();
    });

    return (
        <div id="depthGraph" style={{height: "100%"}} ></div>
    );
}

async function initSciChart() {
    const { sciChartSurface, wasmContext } = await SciChartSurface.create("depthGraph");

    const xAxis = new NumericAxis(wasmContext);
    const yAxis = new NumericAxis(wasmContext);

    sciChartSurface.xAxes.add(xAxis);
    sciChartSurface.yAxes.add(yAxis);
}
I see the following error
Uncaught (in promise) RuntimeError: abort(TypeError:
WebAssembly.instantiate(): Import #0 module=”env” error: module is not
an object or function). Build with -s ASSERTIONS=1 for more info.
and the warning –
wasm streaming compile failed: TypeError: WebAssembly.instantiate():
Import #0 module=”env” error: module is not an object or function
The warning is raised at line 7544 (after pretty print in chrome dev tools) of scichart2d.js?formatted at a line calling WebAssembly.instantiateStreaming(e,d). both e and d have values.
Debugging originally led me to believe that there was an issue finding the scichart2d.wasm file however network traffic clearly shows the file being fetched.
Any ideas?
- Paul Hodgson asked 3 years ago
- last active 3 years ago
I have a real-time updated chart with multiple series. Is it possible for me to add a custom annotation to the chart by just providing the x1 value? i.e. The y1 value will be the y value of the data point in certain series with the provided x1 value. It will look like that the annotation will be sticked to the series with a fixed x1 value while the chart is updating.
- Kelly Chan asked 1 year ago
- last active 1 year ago
Our application requires registration between visible image and heatmap data. I am able to do this with ScalableAnnotations which registers the image beautifully and is able to scale with the heatmap as shown in the video below.
unfortunately this is exactly opposite of what we need. The issue we are facing is we need the visible image to be under the heatmap and not over the heatmap. In our use case the relevant data in the heatmap is visible and rest of the data is transparent and needs to be over the visible image to colocate where the cancer is.
How do we achieve this?
- pramod butte asked 1 week ago
- last active 7 days ago
Hi,
In the documentation I can’t see any way to make a chart surface fill the available space in all directions.
By default, it fills the available horizontal space, but the ratio of width:height remains fixed.
The only example I’ve seen where this is slightly different is this JS example, where the width flexes independently to fit the available space: https://demo.scichart.com/javascript-2d-3d-chart-tenor-curves-example – I’m not sure exactly what part of the code makes this different to the other examples?
My goal is to allow the user to adjust the height and width of any chart themselves by dragging the size of the container div, with the chart surface ideally just filling the space in a ‘dumb’ way, rather than using JS to manually update the chart size during the drag event.
Thanks,
Joe
- Henrique Rodrigues asked 3 years ago
- last active 2 years ago
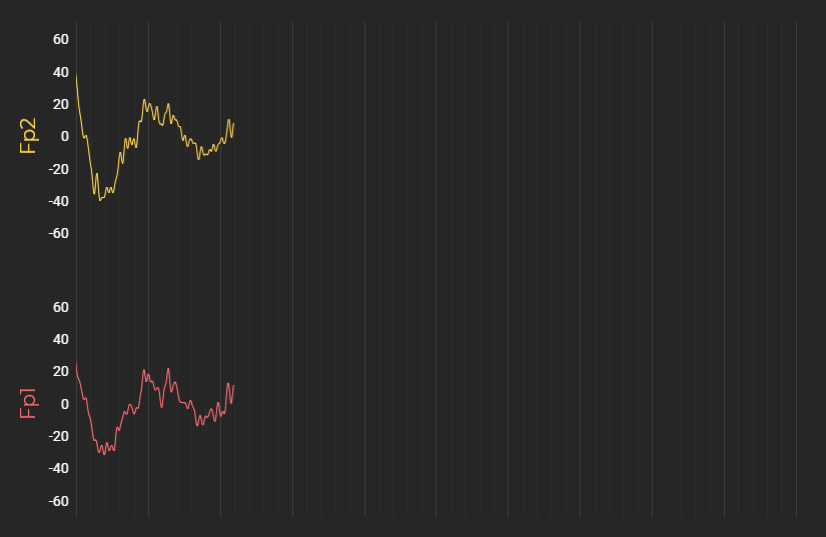
How can I rotate the axis titles in SciChat JS?
We want the the titles Fp1 and Fp2 to be rotated so they are horizontal on the screen instead of vertical.
- Tim Stephansen asked 2 years ago
- last active 2 years ago
Good afternoon. Scichart WPF has two built-in small buttons in the top right corner of the panels for collapsing and closing charts. How can you add such buttons in Scichart javascript and how to correctly describe the functions?
- Alexksandr Shvabskiy asked 6 months ago
- last active 6 months ago
Hello, I need to use tooltips to display information to users. However, after using the tooltip, there will be a jam after the tooltip appears and when zooming. How can I optimize the performance.
The following is the code. I use the js example: “Load 500 Series x 500 Points Performance Demo” for transformation
import { NumericAxis } from "scichart/Charting/Visuals/Axis/NumericAxis";
import { FastLineRenderableSeries } from "scichart/Charting/Visuals/RenderableSeries/FastLineRenderableSeries";
import { EllipsePointMarker } from "scichart/Charting/Visuals/PointMarkers/EllipsePointMarker";
import {
  RolloverModifier,
  TRolloverTooltipDataTemplate
} from "scichart/Charting/ChartModifiers/RolloverModifier";
import { ZoomPanModifier } from "scichart/Charting/ChartModifiers/ZoomPanModifier";
import { ZoomExtentsModifier } from "scichart/Charting/ChartModifiers/ZoomExtentsModifier";
import { MouseWheelZoomModifier } from "scichart/Charting/ChartModifiers/MouseWheelZoomModifier";
import { SciChartSurface } from "scichart";
import {
  IXyDataSeriesOptions,
  XyDataSeries
} from "scichart/Charting/Model/XyDataSeries";
import { NumberRange } from "scichart/Core/NumberRange";
import { EAutoRange } from "scichart/types/AutoRange";
import { convertRgbToHexColor } from "scichart/utils/convertColor";
// eslint-disable-next-line
SciChartSurface.useWasmFromCDN();

const divElementId = "scichart-root";

const color = "#368BC1";

const SERIES = 1500;
const POINTS = 188;


const drawExample = async (updateTimeSpans) => {
  const { sciChartSurface, wasmContext } = await SciChartSurface.create(
    divElementId,{ widthAspect: 3, heightAspect: 2}
  );
  const xAxis = new NumericAxis(wasmContext, {
    visibleRange: new NumberRange(0, POINTS),
    autoRange: EAutoRange.Never
});
sciChartSurface.xAxes.add(xAxis);
const dataSeriesArray= new Array(SERIES);;
const rendSeriesArray=new Array(SERIES);
const yAxis = new NumericAxis(wasmContext, {
    visibleRange: new NumberRange(-5000, 5000),
    autoRange: EAutoRange.Never
});
// yAxis.labelProvider.numericFormat = ENumericFormat.Decimal_0;
sciChartSurface.yAxes.add(yAxis);
for (let i = 0; i < SERIES; i++) {
  const dataSeries= new XyDataSeries(wasmContext);
  const rendSeries= new FastLineRenderableSeries(wasmContext, {
      dataSeries,
     stroke: color,
      strokeThickness: 3,
      pointMarker: new EllipsePointMarker(wasmContext, {
        width: 5,
        height: 5,
        strokeThickness: 2,
        fill: "white",
        stroke: color
      })
  });
  dataSeriesArray[i] = dataSeries;
  rendSeriesArray[i] = rendSeries;
sciChartSurface.renderableSeries.add(rendSeries);
}
sciChartSurface.chartModifiers.add(new ZoomExtentsModifier(), new ZoomPanModifier(), new MouseWheelZoomModifier(),new RolloverModifier(wasmContext));
const loadPoints = () => {
  const newTimeSpans=[];

  // Start counting Points generation time
  const generateTimestamp = Date.now();

  const xValuesArray = new Array(SERIES);
  const yValuesArray = new Array(SERIES);
  const strokeArray =  new Array(SERIES);
  for (let i = 0; i < SERIES; i++) {
      // Allocate data arrays
      xValuesArray[i] = new Array(POINTS);
      yValuesArray[i] = new Array(POINTS);

      // Clear data, if any
      dataSeriesArray[i].clear();

      // Generate stroke
      const r = Math.random();
      const g = Math.random();
      const b = Math.random();
      strokeArray[i] = convertRgbToHexColor(r, g, b);

      // Generate points
      let prevYValue = 0;
      for (let j = 0; j < POINTS; j++) {
          const curYValue = Math.random() * 10 - 5;

          xValuesArray[i][j] = j;
          yValuesArray[i][j] = prevYValue + curYValue;

          prevYValue += curYValue;
      }
  }

  // Add the first time span: Generating 1M data points
  newTimeSpans.push({
      title: "Generate 500x500 Data Points",
      durationMs: Date.now() - generateTimestamp
  });

  // Start counting batch append time
  const appendTimestamp = Date.now();
  for (let i = 0; i < SERIES; i++) {
      dataSeriesArray[i].appendRange(xValuesArray[i], yValuesArray[i]);
      rendSeriesArray[i].stroke = strokeArray[i];
  }

  // Add the second time span: Generation of data point
  newTimeSpans.push({
      title: "Append 500x500 Data Points",
      durationMs: Date.now() - appendTimestamp
  });

  // Subscribe to sciChartSurface.rendered event,
  // and calculate time duration between the append and
  // the first frame after it
  const firstFrameTimestamp = Date.now();
  let frameIndex = 0;
  let nextFramesTimestamp;
  const handler = () => {
      if (frameIndex === 0) {
          // Add the third time span: Render the first frame
          newTimeSpans.push({
              title: "Render the frame",
              durationMs: Date.now() - firstFrameTimestamp
          });
          nextFramesTimestamp = Date.now();
      } else {
          // Unsubscribe from sciChartSurface.rendered
          updateTimeSpans(newTimeSpans);
          sciChartSurface.rendered.unsubscribe(handler);

          // Zoom extents at the end of performance measurement
          sciChartSurface.zoomExtents();
      }
      setTimeout(sciChartSurface.invalidateElement, 0);
      // Increment frame index
      frameIndex++;
  };
  sciChartSurface.rendered.subscribe(handler);
};
  loadPoints()
};

drawExample();
- js scichart asked 1 year ago
- last active 1 year ago
There seems to be no documentation on how to configure scichart when using app router with nextJS, and I am running into an error.
I have followed a combination of this tutorial, and additional setup for nextJS found here, specifically the next.config.js file, copy-files-from-to.json, and additions to package.json. But I continue to get the error: ‘Module has already been declared’. (first/second pics in PDF)
I have attached a photos inside the pdf, including my project structure, and a zip with the files to duplicate.
Steps to replicate:
1) extract files and add root package.json to a directory of your choice
2) from within this directory, use ‘yarn create next-app scichart-prototype’ (use set-up options from 4th image in PDF)
3) Replace root layout.tsx and page.tsx with files in zip, add SciChartDemo directory and add page.tsx from that (also in zip)
4) replace the next.config.mjs file with the next.config.mjs file from the zip
5) add the copy-files-from-to.json from the zip
6) replace the package.json file in scichart-prototype directory with file from the zip.
7) run ‘yarn install’ to add packages
8) run ‘turbo dev’
9) after visiting localhost:3000/ click the Sci Chart Demo link to see error.
Thanks for taking a look.
- max keirn asked 2 months ago
- last active 2 months ago
Hi Scichart Team.
I am working on the MouseWheelZoomModifier (EActionType.Pan).
But my users are using a trackpad (apple magic trackpad).
Currently, they are using 2 fingers and move up or down (vertically) to pan the chart. But they are asked to pan the chart by using 2 fingers and move left or right (horizontally) instead.
Do we have any setting for MouseWheelZoomModifier that help me pan the chart by that way?
- TRUONG LE asked 9 months ago
- last active 9 months ago
Hi, im facing a problem related to VisibleRange Auto,
when a value is much higher than the values
already plotted and I try to scroll along the X axis,
the value on the Y axis does not fully show the candle.
Please see the attached images.
As you can see, the biggest value of my last candle is 41.75, however,
the numberRange that is being used in VisibleRange Auto is 41.63.
Is there any way around this?
- rocket trade asked 2 months ago
Hi there,
I am using scichart on a web application to plot 4 different plots simultaneously ( three using FastBandRenderableSeries and one using UniformHeatmapDataSeries).
When running on local environment everything works as expected (browser is very responsive) but when I push it to the production website it lags and my computer seems to be having hard time with the browser. I am still debugging it but thought to ask in case you have any recommendations ? Do you have performance related tips you can share?
I was reading on other posts about SciChartSurface.RenderPriority but it does not seem to exist in JS Scichart. Is there a workaround you can suggest?
Thank you,
- Ihab Skafi asked 3 years ago
- last active 3 years ago
I’m using an example of RealtimeTickingStockCharts
I’ve added a modifier
new YAxisDragModifier({
            dragMode: EDragMode.Scaling,
        }),
I see icon changed to arrows but scaling does not work. What should I check ?
- Ivan Skiridomov asked 6 months ago
- last active 6 months ago
I am using a axis line chart from the js scichart. I want to change the font size of a legend. How do I change the font size of a legend?
- info vcanus asked 11 months ago
- last active 11 months ago
Hello,
I found an issue with very high memory usage by the application. after some tests I found the problem and moved it to a separate example(https://codepen.io/PodaRocheK/pen/PoVmzvP?editors=0011). Please check this code and observe the memory usage on this page. With prolonged use (after 10 minutes), it is clear that more and more memory is used. After hours, the memory used may already be more than several gigabytes. Tell me what the problem is, maybe I’m doing something wrong. Maybe I’m somehow storing old data incorrectly or adding it incorrectly.
This example is not a working example, it has been sped up in order to quickly identify the problem. In our example, an unnecessary data update will occur once every few seconds and after a night of inactivity, the entire page will die. Please tell me what the problem is.
Thank you!
- Yevhenii Krasovskyi asked 6 months ago
- last active 6 months ago
When I’m using a BoxAnnotation, and it is selected, I can see that the borders are shown expanding past the chart area, on top of the axes.
Ideally they would have the same behaviour as the normal stroke, and keep constrained to the chart area.
Codepen showing the issue: https://codepen.io/jrfv/full/bGzqvoE
Am I missing some configuration to make this work?
Thanks!
- João Velasques asked 6 months ago
- last active 6 months ago
I have a big problem with memory, i try many things but it’s doesn’t effect.
It’s my code for testing memory :
    const { wasmContext, sciChartSurface } = await SciChartSurface.create("bandTest", { theme: new SciChartJSLightTheme() });
    sciChartSurface.title = "Axis 1";
    sciChartSurface.xAxes.add(new NumericAxis(wasmContext, { axisTitle: "Column number", axisTitleStyle: {fontSize: 12} }));
    sciChartSurface.yAxes.add(new NumericAxis(wasmContext, { axisAlignment: EAxisAlignment.Left, axisTitleStyle: {fontSize: 12} }));
    setTimeout(sciChartSurface.delete(),2000);
sciChartSurface.delete() have no effect for memory
I run snapshot without this code and another snapshot with this code. (snap 14 is before call SciChart and snap 15 is after call the code bellow)
What can I do?
Regards
- Marjorie lesage asked 9 months ago
- last active 8 months ago
