SciChart® the market leader in Fast WPF Charts, WPF 3D Charts, iOS Chart, Android Chart and JavaScript Chart Components
Please note! These examples are new to SciChart iOS v4 release! SciChart’s OpenGL ES and Metal iOS and Metal macOS Chart library ships with hundred of Objective-C and Swift iOS&macOS Chart Examples which you can browse, play with and view the source-code. All of this is possible with the new and improved SciChart iOS Examples Suite and demo application for Mac, which ships as part of the SciChart SDK.
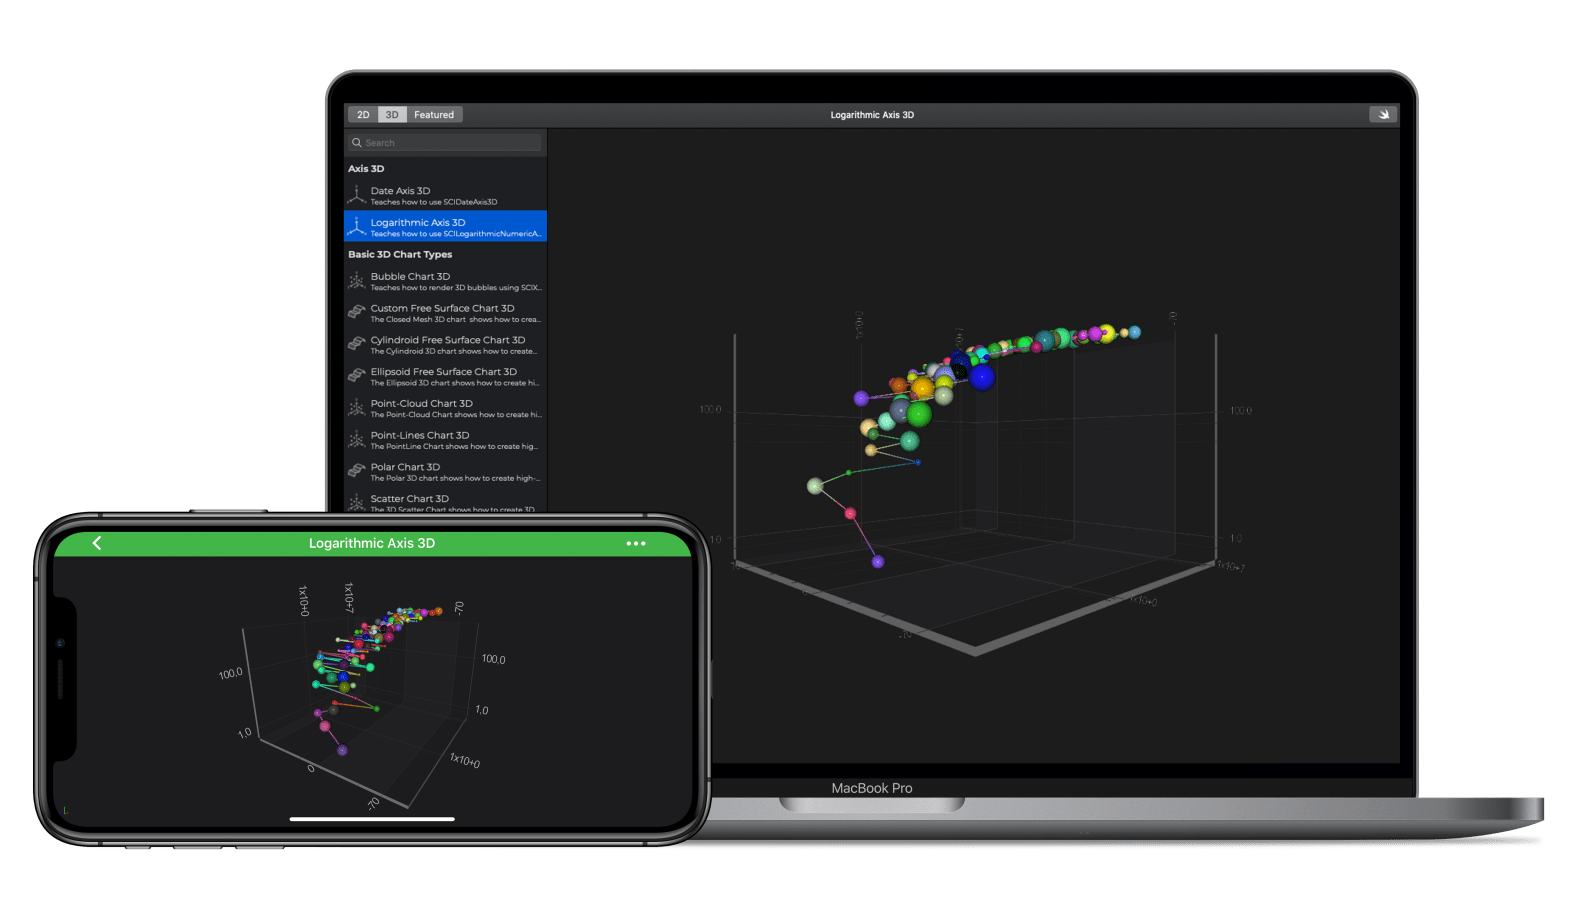
This example showcases the rich SciChart iOS 3D Charts API that provides many different Axis types out of the box. One of the axis types is Logarithmic Axis, that is widely used in charts in wide range of iOS applications.
The LogarithmicNumericAxis3D is a Logarithmic Value-Axis and is suitable when the data on that axis is a Numeric value e.g. Double, Int, Long, Float.
You can read more about how to set different axis types in SciChart iOS 3D and other axis types in our documentation:
The Swift and Objective-C source code for the iOS and macOS Logarithmic Axis3D example is included below (Scroll down!).
Did you know that we have the source code for all our example available for free on Github?
Clone the SciChart.iOS.Examples from Github.
Also the SciChart iOS and Scichart macOS Trials contain the full source for the examples (link below).
//******************************************************************************
// SCICHART® Copyright SciChart Ltd. 2011-2019. All rights reserved.
//
// Web: http://www.scichart.com
// Support: support@scichart.com
// Sales: sales@scichart.com
//
// LogarithmicAxis3DChartView.m is part of the SCICHART® Examples. Permission is hereby granted
// to modify, create derivative works, distribute and publish any part of this source
// code whether for commercial, private or personal use.
//
// The SCICHART® examples are distributed in the hope that they will be useful, but
// without any warranty. It is provided "AS IS" without warranty of any kind, either
// expressed or implied.
//******************************************************************************
#import "LogarithmicAxis3DChartView.h"
#import "SCDDataManager.h"
@implementation LogarithmicAxis3DChartView
- (Class)associatedType { return SCIChartSurface3D.class; }
- (void)initExample {
SCILogarithmicNumericAxis3D *xAxis = [SCILogarithmicNumericAxis3D new];
xAxis.growBy = [[SCIDoubleRange alloc] initWithMin:0.1 max:0.1];
xAxis.drawMajorBands = NO;
xAxis.textFormatting = @"#.#e+0";
xAxis.scientificNotation = SCIScientificNotation_LogarithmicBase;
SCILogarithmicNumericAxis3D *yAxis = [SCILogarithmicNumericAxis3D new];
yAxis.growBy = [[SCIDoubleRange alloc] initWithMin:0.1 max:0.1];
yAxis.drawMajorBands = NO;
yAxis.textFormatting = @"#.0";
yAxis.scientificNotation = SCIScientificNotation_None;
SCINumericAxis3D *zAxis = [SCINumericAxis3D new];
zAxis.growBy = [[SCIDoubleRange alloc] initWithMin:0.5 max:0.5];
const int count = 100;
SCDDoubleSeries* data1 = [SCDDataManager getExponentialCurveWithExponent:1.8 count:count];
SCIXyzDataSeries3D *ds1 = [[SCIXyzDataSeries3D alloc] initWithXType:SCIDataType_Double yType:SCIDataType_Double zType:SCIDataType_Double];
SCIPointMetadataProvider3D *metadataProvider = [SCIPointMetadataProvider3D new];
for (int i = 0; i < count; ++i) {
double x = [data1.xValues getValueAt:i];
double y = [data1.yValues getValueAt:i];
double z = [SCDDataManager getGaussianRandomNumber:15 stdDev:1.5];
[ds1 appendX:@(x) y:@(y) z:@(z)];
SCIPointMetadata3D *metaData = [[SCIPointMetadata3D alloc] initWithVertexColor:[SCDDataManager randomColor] andScale:[SCDDataManager randomScale]];
[metadataProvider.metadata addObject:metaData];
}
SCISpherePointMarker3D *pointMarker = [SCISpherePointMarker3D new];
pointMarker.size = 5.f;
SCIPointLineRenderableSeries3D *rSeries = [SCIPointLineRenderableSeries3D new];
rSeries.dataSeries = ds1;
rSeries.strokeThickness = 2.0;
rSeries.pointMarker = pointMarker;
rSeries.metadataProvider = metadataProvider;
[SCIUpdateSuspender usingWithSuspendable:self.surface withBlock:^{
self.surface.xAxis = xAxis;
self.surface.yAxis = yAxis;
self.surface.zAxis = zAxis;
[self.surface.renderableSeries add:rSeries];
[self.surface.chartModifiers add:[SCDExampleBaseViewController createDefaultModifiers3D]];
}];
}
@end
//******************************************************************************
// SCICHART® Copyright SciChart Ltd. 2011-2019. All rights reserved.
//
// Web: http://www.scichart.com
// Support: support@scichart.com
// Sales: sales@scichart.com
//
// LogarithmicAxis3DChartView.swift is part of the SCICHART® Examples. Permission is hereby granted
// to modify, create derivative works, distribute and publish any part of this source
// code whether for commercial, private or personal use.
//
// The SCICHART® examples are distributed in the hope that they will be useful, but
// without any warranty. It is provided "AS IS" without warranty of any kind, either
// expressed or implied.
//******************************************************************************
class LogarithmicAxis3DChartView: SCDSingleChartViewController<SCIChartSurface3D> {
override var associatedType: AnyClass { return SCIChartSurface3D.self }
override func initExample() {
let xAxis = SCILogarithmicNumericAxis3D()
xAxis.growBy = SCIDoubleRange(min: 0.1, max: 0.1)
xAxis.drawMajorBands = false
xAxis.textFormatting = "#.#e+0"
xAxis.scientificNotation = .logarithmicBase
let yAxis = SCILogarithmicNumericAxis3D()
yAxis.growBy = SCIDoubleRange(min: 0.1, max: 0.1)
yAxis.drawMajorBands = false
yAxis.textFormatting = "#.0"
yAxis.scientificNotation = .none
let zAxis = SCINumericAxis3D()
zAxis.growBy = SCIDoubleRange(min: 0.5, max: 0.5)
let count = 100
let data = SCDDataManager.getExponentialCurve(withExponent: 1.8, count: 100)
let dataSeries = SCIXyzDataSeries3D(xType: .double, yType: .double, zType: .double)
let pointMetaDataProvider = SCIPointMetadataProvider3D()
for i in 0 ..< count {
let x = data.xValues.getValueAt(i)
let y = data.yValues.getValueAt(i)
let z = SCDDataManager.getGaussianRandomNumber(15, stdDev: 1.5)
dataSeries.append(x: x, y: y, z: z)
let metadata = SCIPointMetadata3D(vertexColor: SCDDataManager.randomColor(), andScale: SCDDataManager.randomScale())
pointMetaDataProvider.metadata.add(metadata)
}
let pointMarker = SCISpherePointMarker3D()
pointMarker.size = 5.0
let rSeries = SCIPointLineRenderableSeries3D()
rSeries.dataSeries = dataSeries
rSeries.strokeThickness = 2.0
rSeries.pointMarker = pointMarker
rSeries.metadataProvider = pointMetaDataProvider
SCIUpdateSuspender.usingWith(surface) {
self.surface.xAxis = xAxis
self.surface.yAxis = yAxis
self.surface.zAxis = zAxis
self.surface.renderableSeries.add(rSeries)
self.surface.chartModifiers.add(SCDExampleBaseViewController.createDefaultModifiers3D())
}
}
}