iOS & macOS charts - Examples
Please note! These examples are new to SciChart iOS v4 release! SciChart’s OpenGL ES and Metal iOS and Metal macOS Chart library ships with hundred of Objective-C and Swift iOS & macOS Chart Examples which you can browse, play with and view the source-code. All of this is possible with the new and improved SciChart iOS Examples Suite and demo application for Mac, which ships as part of the SciChart SDK.
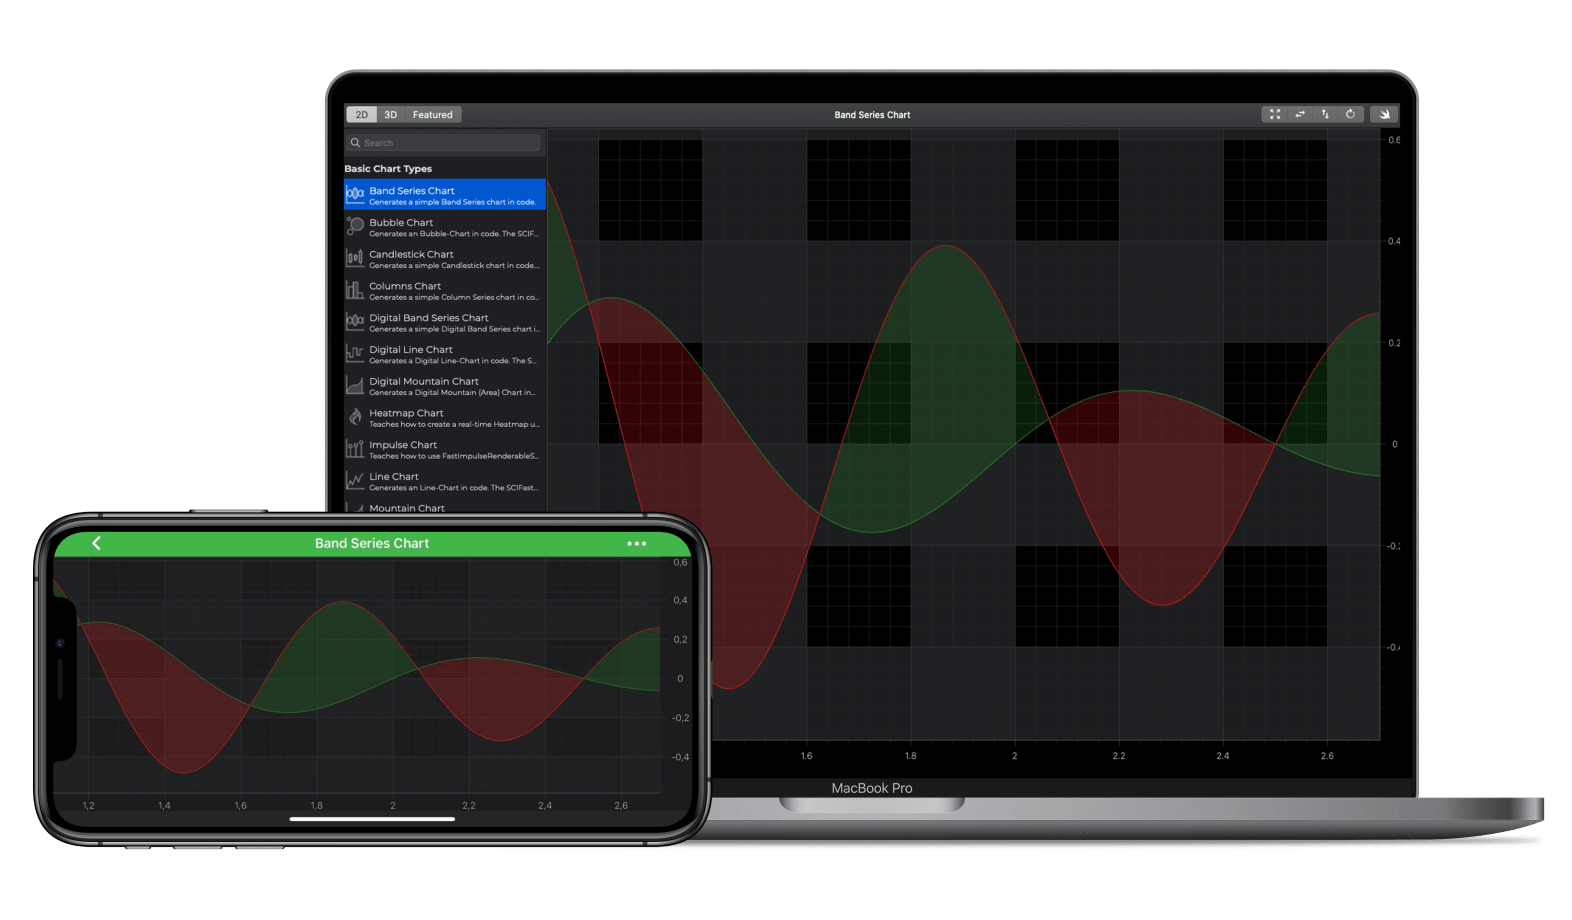
Generates a simple iOS Band Series chart in code. See Documentation on how to use this type here: The iOS Band Chart Documentation.
The SCIFastBandRenderableSeries draws two lines, denoted by Y1 and Y2, and an optional fill between the lines. The Filled area changes color depending on whether Y1 is above Y2 or not. The Band Series can be used to display:
– Envelopes
– Bollinger Bands
– Profit & Loss
– Warnings, such as when a value is above a threshold.
Data is provided by a SCIXyyDataSeries. This uses Y1 and Y2 values to draw the lines.
Dual lines are colored by the Stroke and Fill Styles. Stroke, StrokeY1 and shaded bands are drawn using FillY1 and Fill, depending on whether Y1 is greater than Y2.

The Swift and Objective-C source code for the iOS and macOS Band Series Chart example is included below (Scroll down!).
Did you know that we have the source code for all our example available for free on Github?
Clone the SciChart.iOS.Examples from Github.
Also the SciChart iOS and Scichart macOS Trials contain the full source for the examples (link below).
