SciChart® the market leader in Fast WPF Charts, WPF 3D Charts, iOS Chart, Android Chart and JavaScript Chart Components
Please note! These examples are new to SciChart iOS v4 release! SciChart’s OpenGL ES and Metal iOS and Metal macOS Chart library ships with hundred of Objective-C and Swift iOS&macOS Chart Examples which you can browse, play with and view the source-code. All of this is possible with the new and improved SciChart iOS Examples Suite and demo application for Mac, which ships as part of the SciChart SDK.
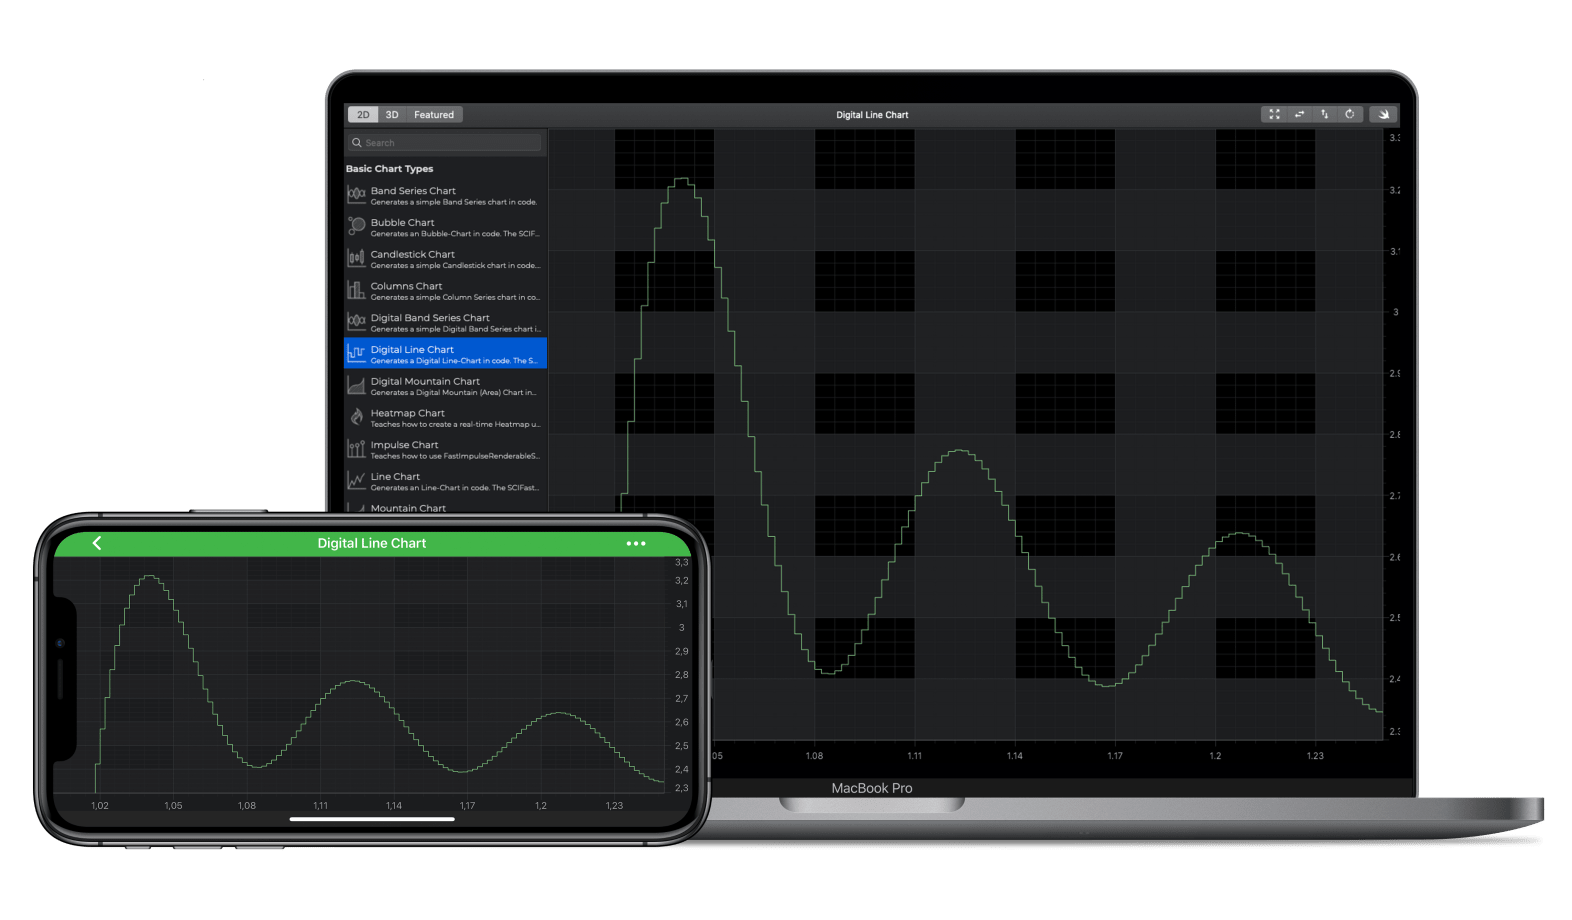
Generates an iOS Digital (Step) Line Chart in code. See Documentation on how to use this type here: The iOS Digital Line Chart Documentation.
The SCIFastLineRenderableSeries can be used to render a high performance iOS Line Chart in either Swift or Objective C. SciChart iOS supports millions of points out of the box, and is suitable for use in real-time scientific, medical and trading applications.
Data is provided by a DataSeries, e.g. the SCIXyDataSeries, SCIXyyDataSeries (uses Y1 only) or SCIOhlcDataSeries (renders close).
The Swift and Objective-C source code for the iOS and macOS Digital Line Chart example is included below (Scroll down!).
Did you know that we have the source code for all our example available for free on Github?
Clone the SciChart.iOS.Examples from Github.
Also the SciChart iOS and Scichart macOS Trials contain the full source for the examples (link below).
//******************************************************************************
// SCICHART® Copyright SciChart Ltd. 2011-2019. All rights reserved.
//
// Web: http://www.scichart.com
// Support: support@scichart.com
// Sales: sales@scichart.com
//
// DigitalLineChartView.m is part of the SCICHART® Examples. Permission is hereby granted
// to modify, create derivative works, distribute and publish any part of this source
// code whether for commercial, private or personal use.
//
// The SCICHART® examples are distributed in the hope that they will be useful, but
// without any warranty. It is provided "AS IS" without warranty of any kind, either
// expressed or implied.
//******************************************************************************
#import "DigitalLineChartView.h"
#import "SCDDataManager.h"
@implementation DigitalLineChartView
- (Class)associatedType { return SCIChartSurface.class; }
- (void)initExample {
id<ISCIAxis> xAxis = [SCINumericAxis new];
xAxis.growBy = [[SCIDoubleRange alloc] initWithMin:0.1 max:0.1];
xAxis.visibleRange = [[SCIDoubleRange alloc] initWithMin:1 max:1.25];
id<ISCIAxis> yAxis = [SCINumericAxis new];
yAxis.growBy = [[SCIDoubleRange alloc] initWithMin:0.5 max:0.5];
yAxis.visibleRange = [[SCIDoubleRange alloc] initWithMin:2.3 max:3.3];
SCDDoubleSeries *fourierSeries = [SCDDataManager getFourierSeriesWithAmplitude:1.0 phaseShift:0.1 count:5000];
SCIXyDataSeries *dataSeries = [[SCIXyDataSeries alloc] initWithXType:SCIDataType_Double yType:SCIDataType_Double];
[dataSeries appendValuesX:fourierSeries.xValues y:fourierSeries.yValues];
SCIFastLineRenderableSeries *rSeries = [SCIFastLineRenderableSeries new];
rSeries.dataSeries = dataSeries;
rSeries.strokeStyle = [[SCISolidPenStyle alloc] initWithColorCode:0xFF99EE99 thickness:1.0];
rSeries.isDigitalLine = YES;
[SCIUpdateSuspender usingWithSuspendable:self.surface withBlock:^{
[self.surface.xAxes add:xAxis];
[self.surface.yAxes add:yAxis];
[self.surface.renderableSeries add:rSeries];
[self.surface.chartModifiers add:[SCDExampleBaseViewController createDefaultModifiers]];
[SCIAnimations waveSeries:rSeries duration:3.0 andEasingFunction:[SCICubicEase new]];
}];
}
@end
//******************************************************************************
// SCICHART® Copyright SciChart Ltd. 2011-2019. All rights reserved.
//
// Web: http://www.scichart.com
// Support: support@scichart.com
// Sales: sales@scichart.com
//
// DigitalLineChartView.swift is part of the SCICHART® Examples. Permission is hereby granted
// to modify, create derivative works, distribute and publish any part of this source
// code whether for commercial, private or personal use.
//
// The SCICHART® examples are distributed in the hope that they will be useful, but
// without any warranty. It is provided "AS IS" without warranty of any kind, either
// expressed or implied.
//******************************************************************************
class DigitalLineChartView: SCDSingleChartViewController<SCIChartSurface> {
override var associatedType: AnyClass { return SCIChartSurface.self }
override func initExample() {
let xAxis = SCINumericAxis()
xAxis.growBy = SCIDoubleRange(min: 0.1, max: 0.1)
xAxis.visibleRange = SCIDoubleRange(min: 1, max: 1.25)
let yAxis = SCINumericAxis()
yAxis.growBy = SCIDoubleRange(min: 0.1, max: 0.1)
yAxis.visibleRange = SCIDoubleRange(min: 2.3, max: 3.3)
let fourierSeries = SCDDataManager.getFourierSeries(withAmplitude: 1.0, phaseShift: 0.1, count: 5000)
let dataSeries = SCIXyDataSeries(xType: .double, yType: .double)
dataSeries.append(x: fourierSeries.xValues, y: fourierSeries.yValues)
let rSeries = SCIFastLineRenderableSeries()
rSeries.strokeStyle = SCISolidPenStyle(color: 0xFF99EE99, thickness: 1.0)
rSeries.dataSeries = dataSeries
rSeries.isDigitalLine = true
SCIUpdateSuspender.usingWith(surface) {
self.surface.xAxes.add(xAxis)
self.surface.yAxes.add(yAxis)
self.surface.renderableSeries.add(rSeries)
self.surface.chartModifiers.add(SCDExampleBaseViewController.createDefaultModifiers())
SCIAnimations.wave(rSeries, duration: 3.0, andEasingFunction: SCICubicEase())
}
}
}