SciChart® the market leader in Fast WPF Charts, WPF 3D Charts, iOS Chart, Android Chart and JavaScript Chart Components
Please note! These examples are new to SciChart iOS v4 release! SciChart’s OpenGL ES and Metal iOS and Metal macOS Chart library ships with hundred of Objective-C and Swift iOS&macOS Chart Examples which you can browse, play with and view the source-code. All of this is possible with the new and improved SciChart iOS Examples Suite and demo application for Mac, which ships as part of the SciChart SDK.
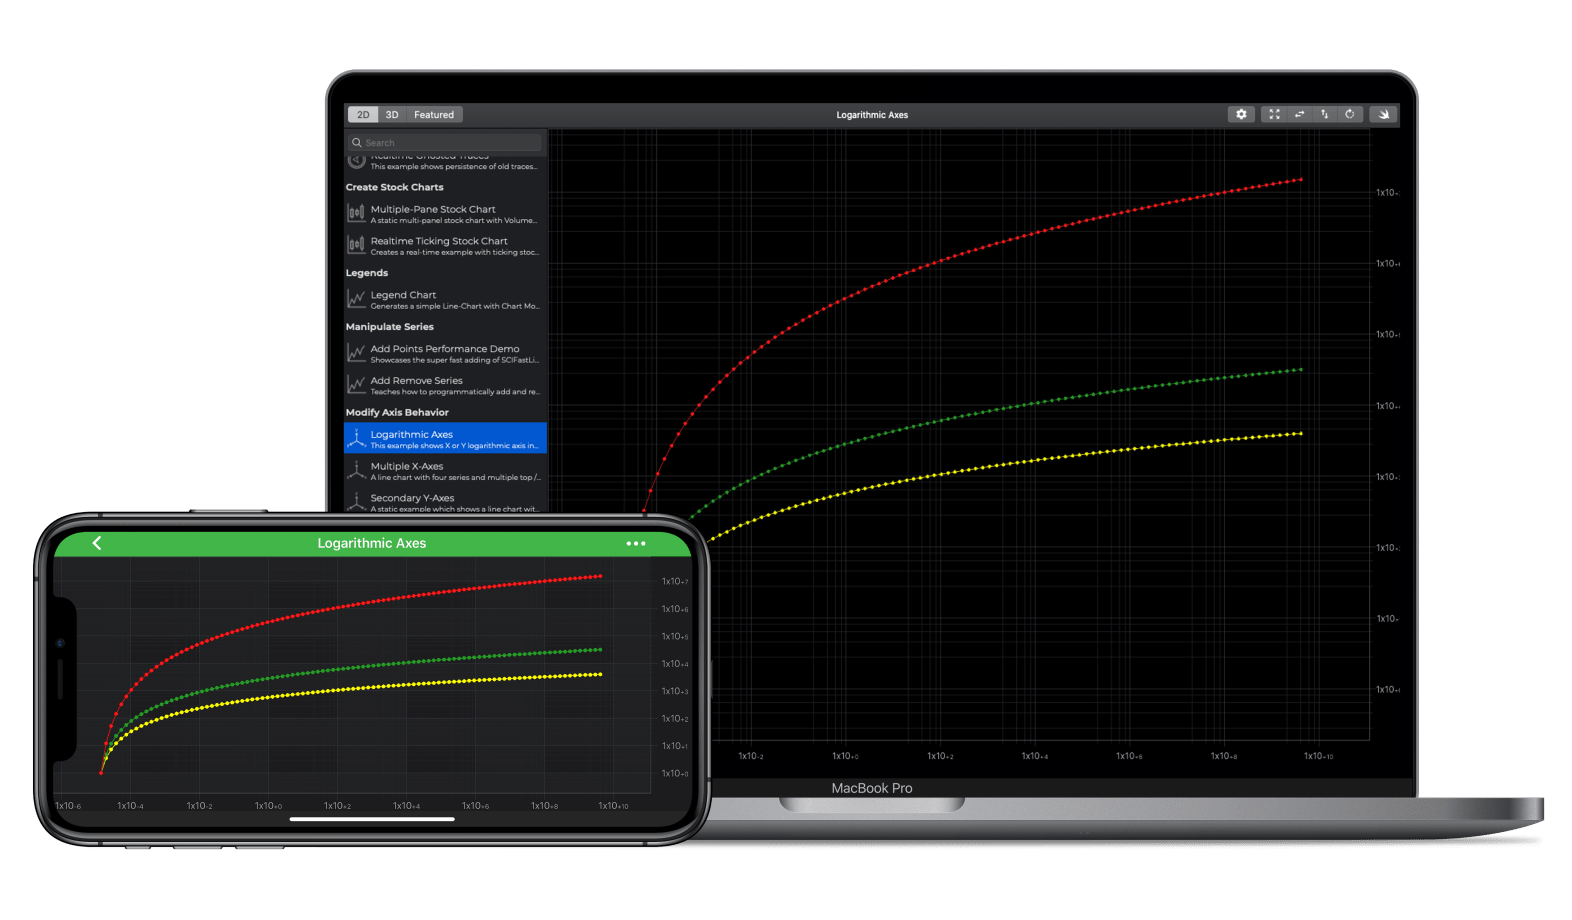
This example demonstrates iOS Charts with X or Y logarithmic axis using SciChart.iOS.
The SCILogarithmicNumericAxis type can be set on the XAxis or YAxis of the SCIChartSurface in order to add a logarithmic scale to an iOS chart.
The Logarithmic Base may be set as a double value to change the Logarithmic Base of the axis, e.g. Log10, LogE, Log2.
Axis labels are formatted using Scientific notation with Superscript.
The Swift and Objective-C source code for the iOS and macOS Chart Logarithmic Axis Example example is included below (Scroll down!).
Did you know that we have the source code for all our example available for free on Github?
Clone the SciChart.iOS.Examples from Github.
Also the SciChart iOS and Scichart macOS Trials contain the full source for the examples (link below).
//******************************************************************************
// SCICHART® Copyright SciChart Ltd. 2011-2019. All rights reserved.
//
// Web: http://www.scichart.com
// Support: support@scichart.com
// Sales: sales@scichart.com
//
// LogarithmicAxisChartView.m is part of the SCICHART® Examples. Permission is hereby granted
// to modify, create derivative works, distribute and publish any part of this source
// code whether for commercial, private or personal use.
//
// The SCICHART® examples are distributed in the hope that they will be useful, but
// without any warranty. It is provided "AS IS" without warranty of any kind, either
// expressed or implied.
//******************************************************************************
#import "LogarithmicAxisChartView.h"
#import "SCDDataManager.h"
@implementation LogarithmicAxisChartView
- (void)initExample {
self.xAxis = [self generateLogarithmicAxis];
self.yAxis = [self generateLogarithmicAxis];
SCIXyDataSeries *dataSeries1 = [[SCIXyDataSeries alloc] initWithXType:SCIDataType_Double yType:SCIDataType_Double];
dataSeries1.seriesName = @"Curve A";
SCIXyDataSeries *dataSeries2 = [[SCIXyDataSeries alloc] initWithXType:SCIDataType_Double yType:SCIDataType_Double];
dataSeries2.seriesName = @"Curve B";
SCIXyDataSeries *dataSeries3 = [[SCIXyDataSeries alloc] initWithXType:SCIDataType_Double yType:SCIDataType_Double];
dataSeries3.seriesName = @"Curve C";
SCDDoubleSeries *doubleSeries1 = [SCDDataManager getExponentialCurveWithExponent:1.8 count:100];
SCDDoubleSeries *doubleSeries2 = [SCDDataManager getExponentialCurveWithExponent:2.25 count:100];
SCDDoubleSeries *doubleSeries3 = [SCDDataManager getExponentialCurveWithExponent:3.59 count:100];
[dataSeries1 appendValuesX:doubleSeries1.xValues y:doubleSeries1.yValues];
[dataSeries2 appendValuesX:doubleSeries2.xValues y:doubleSeries2.yValues];
[dataSeries3 appendValuesX:doubleSeries3.xValues y:doubleSeries3.yValues];
unsigned int line1Color = 0xFFFFFF00;
unsigned int line2Color = 0xFF279B27;
unsigned int line3Color = 0xFFFF1919;
SCIFastLineRenderableSeries *line1 = [SCIFastLineRenderableSeries new];
line1.dataSeries = dataSeries1;
line1.strokeStyle = [[SCISolidPenStyle alloc] initWithColorCode:line1Color thickness:1.5];
line1.pointMarker = [self getPointMarkerWithSize:5 colorCode:line1Color];
SCIFastLineRenderableSeries *line2 = [SCIFastLineRenderableSeries new];
line2.dataSeries = dataSeries2;
line2.strokeStyle = [[SCISolidPenStyle alloc] initWithColorCode:line2Color thickness:1.5];
line2.pointMarker = [self getPointMarkerWithSize:5 colorCode:line2Color];
SCIFastLineRenderableSeries *line3 = [SCIFastLineRenderableSeries new];
line3.dataSeries = dataSeries3;
line3.strokeStyle = [[SCISolidPenStyle alloc] initWithColorCode:line3Color thickness:1.5];
line3.pointMarker = [self getPointMarkerWithSize:5 colorCode:line3Color];
[SCIUpdateSuspender usingWithSuspendable:self.surface withBlock:^{
[self.surface.xAxes add:self.xAxis];
[self.surface.yAxes add:self.yAxis];
[self.surface.renderableSeries add:line1];
[self.surface.renderableSeries add:line2];
[self.surface.renderableSeries add:line3];
[self.surface.chartModifiers add:[SCDExampleBaseViewController createDefaultModifiers]];
[SCIAnimations sweepSeries:line1 duration:3.0 andEasingFunction:[SCICubicEase new]];
[SCIAnimations sweepSeries:line2 duration:3.0 andEasingFunction:[SCICubicEase new]];
[SCIAnimations sweepSeries:line3 duration:3.0 andEasingFunction:[SCICubicEase new]];
}];
}
- (SCIEllipsePointMarker *)getPointMarkerWithSize:(int)size colorCode:(uint)colorCode {
SCIEllipsePointMarker *pointMarker = [SCIEllipsePointMarker new];
pointMarker.size = CGSizeMake(size, size);
pointMarker.strokeStyle = nil;
pointMarker.fillStyle = [[SCISolidBrushStyle alloc] initWithColorCode:colorCode];
return pointMarker;
}
@end
//******************************************************************************
// SCICHART® Copyright SciChart Ltd. 2011-2019. All rights reserved.
//
// Web: http://www.scichart.com
// Support: support@scichart.com
// Sales: sales@scichart.com
//
// LogarithmicAxisChartView.swift is part of the SCICHART® Examples. Permission is hereby granted
// to modify, create derivative works, distribute and publish any part of this source
// code whether for commercial, private or personal use.
//
// The SCICHART® examples are distributed in the hope that they will be useful, but
// without any warranty. It is provided "AS IS" without warranty of any kind, either
// expressed or implied.
//******************************************************************************
class LogarithmicAxisChartView: SCDLogarithmicAxisChartViewControllerBase {
override func initExample() {
xAxis = generateLogarithmicAxis()
yAxis = generateLogarithmicAxis()
let dataSeries1 = SCIXyDataSeries(xType: .double, yType: .double)
dataSeries1.seriesName = "Curve A"
let dataSeries2 = SCIXyDataSeries(xType: .double, yType: .double)
dataSeries2.seriesName = "Curve B"
let dataSeries3 = SCIXyDataSeries(xType: .double, yType: .double)
dataSeries3.seriesName = "Curve C"
let SCDDoubleSeries1 = SCDDataManager.getExponentialCurve(withExponent: 1.8, count: 100)
let SCDDoubleSeries2 = SCDDataManager.getExponentialCurve(withExponent: 2.25, count: 100)
let SCDDoubleSeries3 = SCDDataManager.getExponentialCurve(withExponent: 3.59, count: 100)
dataSeries1.append(x: SCDDoubleSeries1.xValues, y: SCDDoubleSeries1.yValues)
dataSeries2.append(x: SCDDoubleSeries2.xValues, y: SCDDoubleSeries2.yValues)
dataSeries3.append(x: SCDDoubleSeries3.xValues, y: SCDDoubleSeries3.yValues)
let line1Color: UInt32 = 0xFFFFFF00
let line2Color: UInt32 = 0xFF279B27
let line3Color: UInt32 = 0xFFFF1919
let line1 = SCIFastLineRenderableSeries()
line1.dataSeries = dataSeries1
line1.strokeStyle = SCISolidPenStyle(colorCode: line1Color, thickness: 1.5)
line1.pointMarker = getPointMarker(size: 5, colorCode: line1Color)
let line2 = SCIFastLineRenderableSeries()
line2.dataSeries = dataSeries2
line2.strokeStyle = SCISolidPenStyle(colorCode: line2Color, thickness: 1.5)
line2.pointMarker = getPointMarker(size: 5, colorCode: line2Color)
let line3 = SCIFastLineRenderableSeries()
line3.dataSeries = dataSeries3
line3.strokeStyle = SCISolidPenStyle(colorCode: line3Color, thickness: 1.5)
line3.pointMarker = getPointMarker(size: 5, colorCode: line3Color)
SCIUpdateSuspender.usingWith(surface) {
self.surface.xAxes.add(self.xAxis)
self.surface.yAxes.add(self.yAxis)
self.surface.renderableSeries.add(line1)
self.surface.renderableSeries.add(line2)
self.surface.renderableSeries.add(line3)
self.surface.chartModifiers.add(SCDExampleBaseViewController.createDefaultModifiers())
SCIAnimations.sweep(line1, duration: 3.0, easingFunction: SCICubicEase())
SCIAnimations.sweep(line2, duration: 3.0, easingFunction: SCICubicEase())
SCIAnimations.sweep(line3, duration: 3.0, easingFunction: SCICubicEase())
}
}
fileprivate func getPointMarker(size: Int, colorCode: UInt32) -> SCIEllipsePointMarker {
let pointMarker = SCIEllipsePointMarker()
pointMarker.size = CGSize(width: CGFloat(size), height: CGFloat(size))
pointMarker.strokeStyle = nil
pointMarker.fillStyle = SCISolidBrushStyle(colorCode: colorCode)
return pointMarker
}
}
//******************************************************************************
// SCICHART® Copyright SciChart Ltd. 2011-2020. All rights reserved.
//
// Web: http://www.scichart.com
// Support: support@scichart.com
// Sales: sales@scichart.com
//
// SCDLogarithmicAxisChartViewControllerBase.m is part of the SCICHART® Examples. Permission is hereby granted
// to modify, create derivative works, distribute and publish any part of this source
// code whether for commercial, private or personal use.
//
// The SCICHART® examples are distributed in the hope that they will be useful, but
// without any warranty. It is provided "AS IS" without warranty of any kind, either
// expressed or implied.
//******************************************************************************
#import "SCDLogarithmicAxisChartViewControllerBase.h"
#import "SCDSettingsPresenter.h"
#import "SCDToolbarButtonsGroup.h"
#import "SCDToolbarItem.h"
#import "SCDToolbarPopupItem.h"
#import "SCDLabeledSettingsItem.h"
#import "SCDSwitchItem.h"
#import "SCDSettingsItemsGroup.h"
#import "SCDConstants.h"
@implementation SCDLogarithmicAxisChartViewControllerBase {
NSArray<NSString *> *_logBaseValues;
SCDSettingsPresenter *_settingsPresenter;
NSUInteger _selectedLogBaseIndex;
double _selectedLogBase;
BOOL _isXLogAxis;
BOOL _isYLogAxis;
}
@synthesize xAxis = _xAxis;
@synthesize yAxis = _yAxis;
- (Class)associatedType { return SCIChartSurface.class; }
- (void)commonInit {
_selectedLogBase = 10;
_selectedLogBaseIndex = 2;
_isXLogAxis = YES;
_isYLogAxis = YES;
_logBaseValues = @[@"2", @"5", @"10", @"E"];
}
- (NSArray<id<ISCDToolbarItem>> *)provideExampleSpecificToolbarItems {
__weak typeof(self) wSelf = self;
SCDToolbarButtonsGroup *settingsToolbar = [[SCDToolbarButtonsGroup alloc] initWithToolbarItems:@[
[[SCDToolbarItem alloc] initWithTitle:@"Logarithmic axis settings" image:[SCIImage imageNamed:@"chart.settings"] andAction:^{ [wSelf p_SCD_openSettings]; }]
]];
settingsToolbar.identifier = TOOLBAR_MODIFIERS_SETTINGS;
return @[settingsToolbar];
}
- (void)p_SCD_openSettings {
_settingsPresenter = [[SCDSettingsPresenter alloc] initWithSettingsItems:[self p_SCD_createSettingsItems] andIdentifier:TOOLBAR_MODIFIERS_SETTINGS];
}
- (NSArray<id<ISCDToolbarItem>> *)p_SCD_createSettingsItems {
__weak typeof(self) wSelf = self;
SCDSettingsItemsGroup *useLogarithmicItemsGroup = [[SCDSettingsItemsGroup alloc] initWithItems:@[
[[SCDSwitchItem alloc] initWithTitle:@"X-Axis" isSelected:_isXLogAxis andAction:^(BOOL isXLogAxis) {
[wSelf p_SCD_onIsXLogAxisChange:isXLogAxis];
}],
[[SCDSwitchItem alloc] initWithTitle:@"Y-Axis" isSelected:_isXLogAxis andAction:^(BOOL isYLogAxis) {
[wSelf p_SCD_onIsYLogAxisChange:isYLogAxis];
}]
]];
SCDToolbarPopupItem *logarithmicPopupItem = [[SCDToolbarPopupItem alloc] initWithTitles:_logBaseValues selectedIndex:_selectedLogBaseIndex andAction:^(NSUInteger selectedIndex) {
[wSelf p_SCD_onSelectedLogBaseChange:selectedIndex];
}];
return @[
[[SCDLabeledSettingsItem alloc] initWithLabelText:@"Use Logarithmic on:" item:useLogarithmicItemsGroup iOS_orientation:SCILayoutConstraintAxisVertical],
[[SCDLabeledSettingsItem alloc] initWithLabelText:@"Logarithmic base:" item:logarithmicPopupItem]
];
}
- (void)p_SCD_onSelectedLogBaseChange:(NSUInteger)index {
_selectedLogBaseIndex = index;
switch (_selectedLogBaseIndex) {
case 0: _selectedLogBase = 2; break;
case 1: _selectedLogBase = 5; break;
case 2: _selectedLogBase = 10; break;
case 3: _selectedLogBase = M_E; break;
default:
break;
}
[self p_SCD_trySetLogBase:_selectedLogBase forAxis:_xAxis];
[self p_SCD_trySetLogBase:_selectedLogBase forAxis:_yAxis];
}
- (void)p_SCD_trySetLogBase:(double)logBase forAxis:(id<ISCIAxis>)axis {
if ([axis conformsToProtocol:@protocol(ISCILogarithmicNumericAxis)]) {
((id<ISCILogarithmicNumericAxis>)axis).logarithmicBase = logBase;
}
}
- (void)p_SCD_onIsXLogAxisChange:(BOOL)isXLogAxis {
_isXLogAxis = isXLogAxis;
_xAxis = _isXLogAxis ? [self generateLogarithmicAxis] : [self generateLinearAxis];
[SCIUpdateSuspender usingWithSuspendable:self.surface withBlock:^{
[self.surface.xAxes clear];
[self.surface.xAxes add:self->_xAxis];
}];
}
- (void)p_SCD_onIsYLogAxisChange:(BOOL)isYLogAxis {
_isYLogAxis = isYLogAxis;
_yAxis = _isYLogAxis ? [self generateLogarithmicAxis] : [self generateLinearAxis];
[SCIUpdateSuspender usingWithSuspendable:self.surface withBlock:^{
[self.surface.yAxes clear];
[self.surface.yAxes add:self->_yAxis];
}];
}
- (id<ISCIAxis>)generateLogarithmicAxis {
SCILogarithmicNumericAxis *axis = [SCILogarithmicNumericAxis new];
axis.growBy = [[SCIDoubleRange alloc] initWithMin:0.1 max:0.1];
axis.scientificNotation = SCIScientificNotation_LogarithmicBase;
axis.textFormatting = @"#.#E+0";
axis.drawMajorBands = NO;
axis.logarithmicBase = _selectedLogBase;
return axis;
}
- (id<ISCIAxis>)generateLinearAxis {
SCINumericAxis *axis = [SCINumericAxis new];
axis.growBy = [[SCIDoubleRange alloc] initWithMin:0.1 max:0.1];
axis.scientificNotation = SCIScientificNotation_Normalized;
axis.textFormatting = @"#.#E+0";
axis.drawMajorBands = NO;
return axis;
}
@end