SciChart® the market leader in Fast WPF Charts, WPF 3D Charts, iOS Chart, Android Chart and JavaScript Chart Components
Please note! These examples are new to SciChart iOS v4 release! SciChart’s OpenGL ES and Metal iOS and Metal macOS Chart library ships with hundred of Objective-C and Swift iOS&macOS Chart Examples which you can browse, play with and view the source-code. All of this is possible with the new and improved SciChart iOS Examples Suite and demo application for Mac, which ships as part of the SciChart SDK.
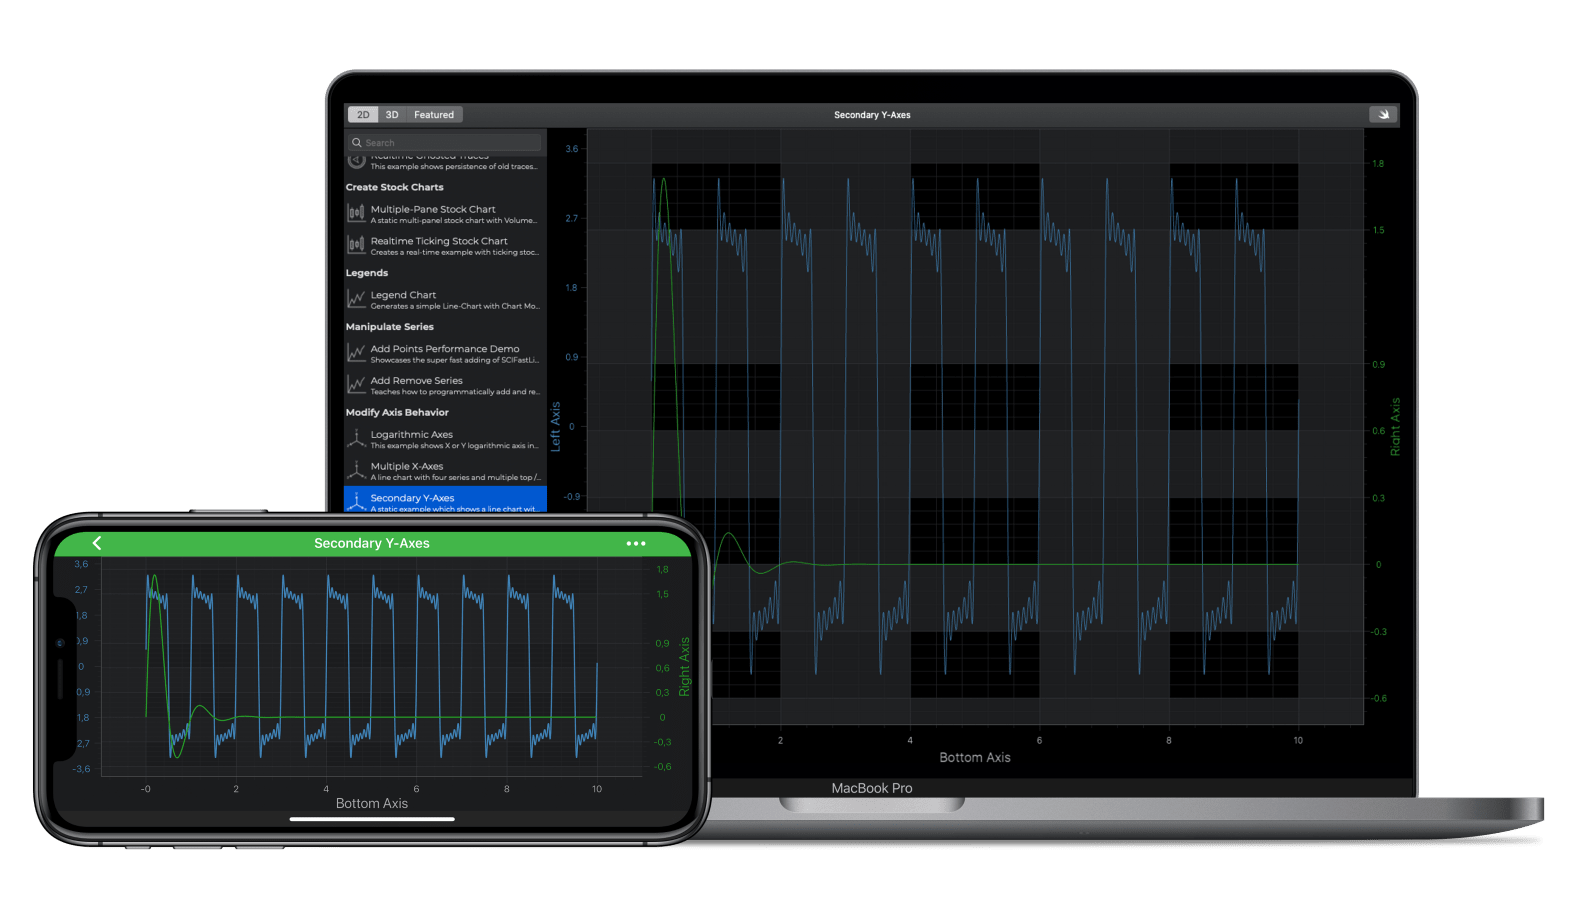
This example demonstrates how to create an iOS line chart with a secondary Y-Axis. SciChart iOS supports unlimited, multiple top or bottom X-Axes and unlimited, multiple left and right Y-Axes. This example shows in a simple way how to register a line series on each axis.
To add multiple YAxis to an iOS Chart, add SCIAxisBase derived types to the SCIChartSurface.yAxes property.
You can set the alignment of any YAxis to Left, Right, Top, Bottom using the SCIAxisAlignment enumeration.
Finally, RenderableSeries can be registered on an axis using the RenderablerSeries.xAxisId, RenderableSeries.yAxisId properties.
The Swift 4 and Objective-C source code for the iOS Secondary Y-Axis Demo example is included below (Scroll down!).
Did you know that we have the source code for all our example available for free on Github?
Clone the SciChart.iOS.Examples from Github.
Also the SciChart iOS and Scichart macOS Trials contain the full source for the examples (link below).
//******************************************************************************
// SCICHART® Copyright SciChart Ltd. 2011-2019. All rights reserved.
//
// Web: http://www.scichart.com
// Support: support@scichart.com
// Sales: sales@scichart.com
//
// SecondaryYAxesChartView.m is part of the SCICHART® Examples. Permission is hereby granted
// to modify, create derivative works, distribute and publish any part of this source
// code whether for commercial, private or personal use.
//
// The SCICHART® examples are distributed in the hope that they will be useful, but
// without any warranty. It is provided "AS IS" without warranty of any kind, either
// expressed or implied.
//******************************************************************************
#import "SecondaryYAxesChartView.h"
#import "SCDDataManager.h"
@implementation SecondaryYAxesChartView
- (Class)associatedType { return SCIChartSurface.class; }
- (BOOL)showDefaultModifiersInToolbar { return NO; }
- (void)initExample {
id<ISCIAxis> xAxis = [SCINumericAxis new];
xAxis.growBy = [[SCIDoubleRange alloc] initWithMin:0.1 max:0.1];
xAxis.axisTitle = @"Bottom Axis";
id<ISCIAxis> rightYAxis = [SCINumericAxis new];
rightYAxis.growBy = [[SCIDoubleRange alloc] initWithMin:0.1 max:0.1];
rightYAxis.axisId = @"rightAxisId";
rightYAxis.axisTitle = @"Right Axis";
rightYAxis.axisAlignment = SCIAxisAlignment_Right;
rightYAxis.tickLabelStyle = [[SCIFontStyle alloc] initWithFontSize:12 andTextColorCode:0xFF279B27];
rightYAxis.titleStyle = [[SCIFontStyle alloc] initWithFontSize:18 andTextColorCode:0xFF279B27];
id<ISCIAxis> leftYAxis = [SCINumericAxis new];
leftYAxis.growBy = [[SCIDoubleRange alloc] initWithMin:0.1 max:0.1];
leftYAxis.axisId = @"leftAxisId";
leftYAxis.axisTitle = @"Left Axis";
leftYAxis.axisAlignment = SCIAxisAlignment_Left;
leftYAxis.tickLabelStyle = [[SCIFontStyle alloc] initWithFontSize:12 andTextColorCode:0xFF4083B7];
leftYAxis.titleStyle = [[SCIFontStyle alloc] initWithFontSize:18 andTextColorCode:0xFF4083B7];
SCIXyDataSeries *ds1 = [[SCIXyDataSeries alloc] initWithXType:SCIDataType_Double yType:SCIDataType_Double];
SCIXyDataSeries *ds2 = [[SCIXyDataSeries alloc] initWithXType:SCIDataType_Double yType:SCIDataType_Double];
SCDDoubleSeries *ds1Points = [SCDDataManager getFourierSeriesWithAmplitude:1.0 phaseShift:0.1 count:5000];
SCDDoubleSeries *ds2Points = [SCDDataManager getDampedSinewaveWithAmplitude:3.0 DampingFactor:0.005 PointCount:5000 Freq:10];
[ds1 appendValuesX:ds1Points.xValues y:ds1Points.yValues];
[ds2 appendValuesX:ds2Points.xValues y:ds2Points.yValues];
SCIFastLineRenderableSeries *rSeries1 = [SCIFastLineRenderableSeries new];
rSeries1.dataSeries = ds1;
rSeries1.strokeStyle = [[SCISolidPenStyle alloc] initWithColorCode:0xFF4083B7 thickness:1.0];
rSeries1.yAxisId = @"leftAxisId";
SCIFastLineRenderableSeries *rSeries2 = [SCIFastLineRenderableSeries new];
rSeries2.dataSeries = ds2;
rSeries2.strokeStyle = [[SCISolidPenStyle alloc] initWithColorCode:0xFF279B27 thickness:2.0];
rSeries2.yAxisId = @"rightAxisId";
[SCIUpdateSuspender usingWithSuspendable:self.surface withBlock:^{
[self.surface.xAxes add:xAxis];
[self.surface.yAxes add:leftYAxis];
[self.surface.yAxes add:rightYAxis];
[self.surface.renderableSeries add:rSeries1];
[self.surface.renderableSeries add:rSeries2];
[self.surface.chartModifiers add:[SCDExampleBaseViewController createDefaultModifiers]];
[SCIAnimations sweepSeries:rSeries1 duration:3.0 andEasingFunction:[SCICubicEase new]];
[SCIAnimations sweepSeries:rSeries2 duration:3.0 andEasingFunction:[SCICubicEase new]];
}];
}
@end
//******************************************************************************
// SCICHART® Copyright SciChart Ltd. 2011-2019. All rights reserved.
//
// Web: http://www.scichart.com
// Support: support@scichart.com
// Sales: sales@scichart.com
//
// SecondaryYAxesChartView.swift is part of the SCICHART® Examples. Permission is hereby granted
// to modify, create derivative works, distribute and publish any part of this source
// code whether for commercial, private or personal use.
//
// The SCICHART® examples are distributed in the hope that they will be useful, but
// without any warranty. It is provided "AS IS" without warranty of any kind, either
// expressed or implied.
//******************************************************************************
class SecondaryYAxesChartView: SCDSingleChartViewController<SCIChartSurface> {
override var associatedType: AnyClass { return SCIChartSurface.self }
override var showDefaultModifiersInToolbar: Bool { return false }
override func initExample() {
let xAxis = SCINumericAxis()
xAxis.growBy = SCIDoubleRange(min: 0.1, max: 0.1)
xAxis.axisTitle = "Bottom Axis"
let rightYAxis = SCINumericAxis()
rightYAxis.growBy = SCIDoubleRange(min: 0.1, max: 0.1)
rightYAxis.axisId = "rightAxisId"
rightYAxis.axisTitle = "Right Axis"
rightYAxis.axisAlignment = .right
rightYAxis.titleStyle = SCIFontStyle(fontSize: 18, andTextColorCode: 0xFF279B27)
rightYAxis.tickLabelStyle = SCIFontStyle(fontSize: 12, andTextColorCode: 0xFF279B27)
let leftYAxis = SCINumericAxis()
leftYAxis.growBy = SCIDoubleRange(min: 0.1, max: 0.1)
leftYAxis.axisId = "leftAxisId"
leftYAxis.axisTitle = "Left Axis"
leftYAxis.axisAlignment = .left
leftYAxis.titleStyle = SCIFontStyle(fontSize: 18, andTextColorCode: 0xFF4083B7)
leftYAxis.tickLabelStyle = SCIFontStyle(fontSize: 12, andTextColorCode: 0xFF4083B7)
let ds1 = SCIXyDataSeries(xType: .double, yType: .double)
let ds2 = SCIXyDataSeries(xType: .double, yType: .double)
let ds1Points = SCDDataManager.getFourierSeries(withAmplitude: 1.0, phaseShift: 0.1, count: 5000)
let ds2Points = SCDDataManager.getDampedSinewave(withAmplitude: 3.0, dampingFactor: 0.005, pointCount: 5000, freq: 10)
ds1.append(x: ds1Points.xValues, y: ds1Points.yValues)
ds2.append(x: ds2Points.xValues, y: ds2Points.yValues)
let rSeries1 = SCIFastLineRenderableSeries()
rSeries1.dataSeries = ds1
rSeries1.strokeStyle = SCISolidPenStyle(colorCode: 0xFF4083B7, thickness: 2.0)
rSeries1.yAxisId = "leftAxisId"
let rSeries2 = SCIFastLineRenderableSeries()
rSeries2.dataSeries = ds2
rSeries2.strokeStyle = SCISolidPenStyle(colorCode: 0xFF279B27, thickness: 2.0)
rSeries2.yAxisId = "rightAxisId"
SCIUpdateSuspender.usingWith(surface) {
self.surface.xAxes.add(xAxis)
self.surface.yAxes.add(leftYAxis)
self.surface.yAxes.add(rightYAxis)
self.surface.renderableSeries.add(rSeries1)
self.surface.renderableSeries.add(rSeries2)
self.surface.chartModifiers.add(SCDExampleBaseViewController.createDefaultModifiers())
SCIAnimations.sweep(rSeries1, duration: 3.0, easingFunction: SCICubicEase())
SCIAnimations.sweep(rSeries2, duration: 3.0, easingFunction: SCICubicEase())
}
}
}