SciChart® the market leader in Fast WPF Charts, WPF 3D Charts, iOS Chart, Android Chart and JavaScript Chart Components
Please note! These examples are new to SciChart iOS v4 release! SciChart’s OpenGL ES and Metal iOS and Metal macOS Chart library ships with hundred of Objective-C and Swift iOS&macOS Chart Examples which you can browse, play with and view the source-code. All of this is possible with the new and improved SciChart iOS Examples Suite and demo application for Mac, which ships as part of the SciChart SDK.
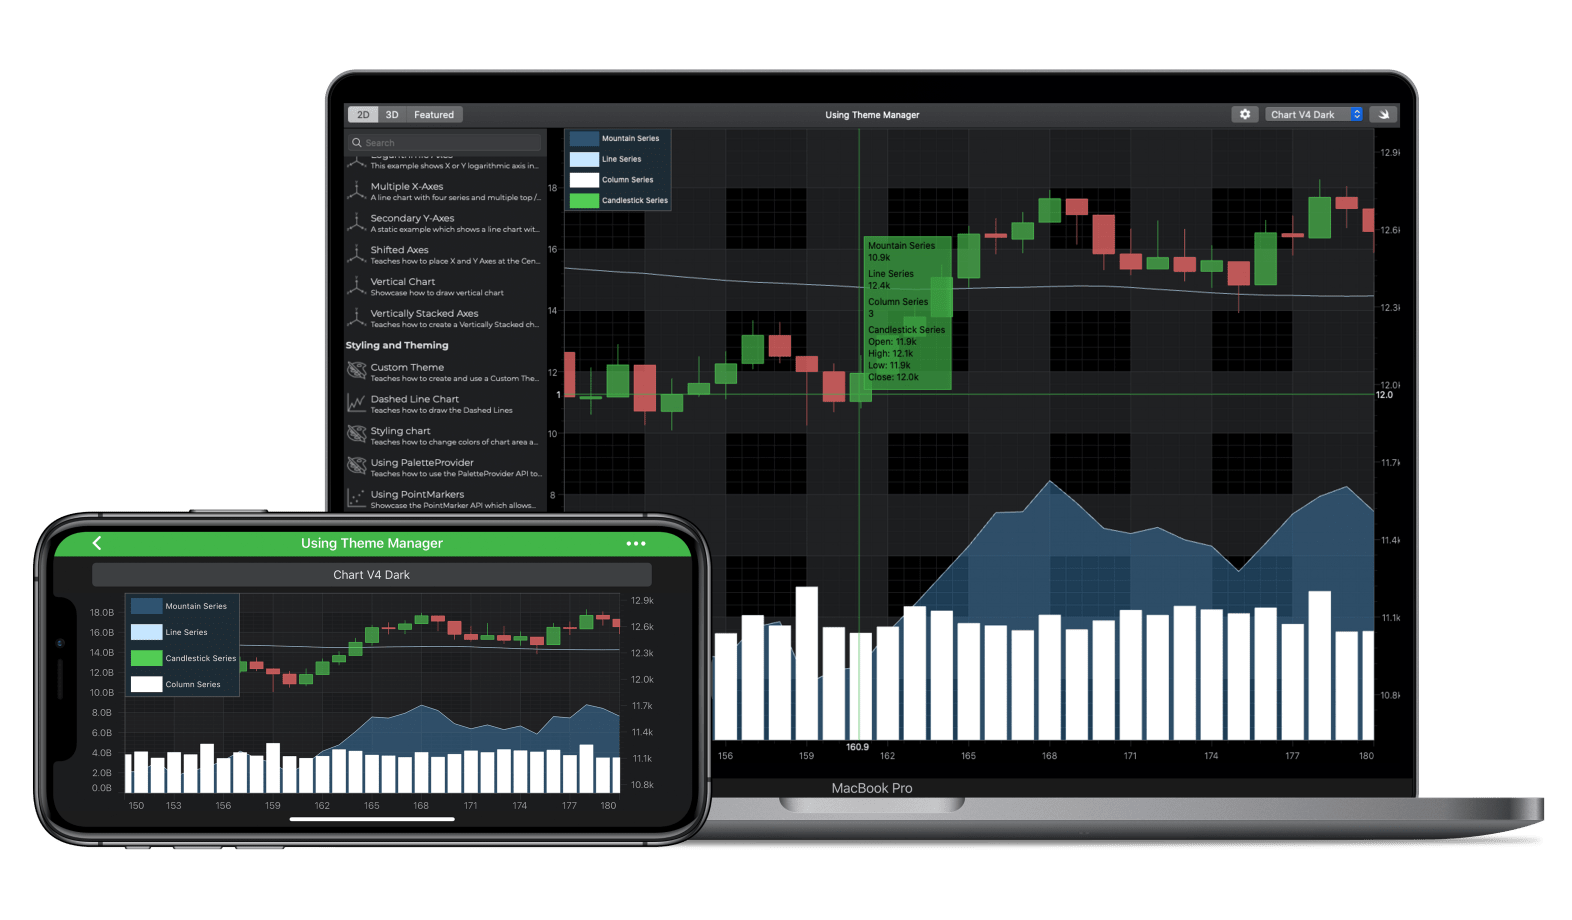
In SciChart you can apply one of our 8 in-built themes to an iOS Chart, or even create your own! This is possible using the ThemeManager or ThemeProvider API.
Calling the SCIChartSurface.applyThemeProvider function with a string key to load one of our predefined themes, changes the look and feel of the chart.
For more info, see the source code for the example below.
The Swift and Objective-C source code for the iOS and macOS Chart Theme Manager example is included below (Scroll down!).
Did you know that we have the source code for all our example available for free on Github?
Clone the SciChart.iOS.Examples from Github.
Also the SciChart iOS and Scichart macOS Trials contain the full source for the examples (link below).
//******************************************************************************
// SCICHART® Copyright SciChart Ltd. 2011-2019. All rights reserved.
//
// Web: http://www.scichart.com
// Support: support@scichart.com
// Sales: sales@scichart.com
//
// UsingThemeManagerView.m is part of the SCICHART® Examples. Permission is hereby granted
// to modify, create derivative works, distribute and publish any part of this source
// code whether for commercial, private or personal use.
//
// The SCICHART® examples are distributed in the hope that they will be useful, but
// without any warranty. It is provided "AS IS" without warranty of any kind, either
// expressed or implied.
//******************************************************************************
#import "UsingThemeManagerView.h"
#import "ThousandsLabelProvider.h"
#import "BillionsLabelProvider.h"
#import "SCDDataManager.h"
@implementation UsingThemeManagerView
- (Class)associatedType { return SCIChartSurface.class; }
- (void)initExample {
id<ISCIAxis> xAxis = [SCINumericAxis new];
xAxis.growBy = [[SCIDoubleRange alloc] initWithMin:0.1 max:0.1];
xAxis.visibleRange = [[SCIDoubleRange alloc] initWithMin:150 max:180];
id<ISCIAxis> yRightAxis = [SCINumericAxis new];
yRightAxis.growBy = [[SCIDoubleRange alloc] initWithMin:0.1 max:0.1];
yRightAxis.axisAlignment = SCIAxisAlignment_Right;
yRightAxis.autoRange = SCIAutoRange_Always;
yRightAxis.axisId = @"PrimaryAxisId";
yRightAxis.labelProvider = [ThousandsLabelProvider new];
id<ISCIAxis> yLeftAxis = [SCINumericAxis new];
yLeftAxis.growBy = [[SCIDoubleRange alloc] initWithMin:0 max:3];
yLeftAxis.axisAlignment = SCIAxisAlignment_Left;
yLeftAxis.autoRange = SCIAutoRange_Always;
yLeftAxis.axisId = @"SecondaryAxisId";
yLeftAxis.labelProvider = [BillionsLabelProvider new];
SCDPriceSeries *priceSeries = [SCDDataManager getPriceDataIndu];
SCIXyDataSeries *mountainDataSeries = [[SCIXyDataSeries alloc] initWithXType:SCIDataType_Double yType:SCIDataType_Double];
mountainDataSeries.seriesName = @"Mountain Series";
SCIXyDataSeries *lineDataSeries = [[SCIXyDataSeries alloc] initWithXType:SCIDataType_Double yType:SCIDataType_Double];
lineDataSeries.seriesName = @"Line Series";
SCIXyDataSeries *columnDataSeries = [[SCIXyDataSeries alloc] initWithXType:SCIDataType_Double yType:SCIDataType_Long];
columnDataSeries.seriesName = @"Column Series";
SCIOhlcDataSeries *candlestickDataSeries = [[SCIOhlcDataSeries alloc] initWithXType:SCIDataType_Double yType:SCIDataType_Double];
candlestickDataSeries.seriesName = @"Candlestick Series";
[mountainDataSeries appendValuesX:priceSeries.indexesAsDouble y:[SCDDataManager offset:priceSeries.lowData offset:-1000]];
[lineDataSeries appendValuesX:priceSeries.indexesAsDouble y:[SCDDataManager computeMovingAverageOf:priceSeries.closeData length:50]];
[columnDataSeries appendValuesX:priceSeries.indexesAsDouble y:priceSeries.volumeData];
[candlestickDataSeries appendValuesX:priceSeries.indexesAsDouble open:priceSeries.openData high:priceSeries.highData low:priceSeries.lowData close:priceSeries.closeData];
SCIFastMountainRenderableSeries *mountainSeries = [SCIFastMountainRenderableSeries new];
mountainSeries.dataSeries = mountainDataSeries;
mountainSeries.yAxisId = @"PrimaryAxisId";
SCIFastLineRenderableSeries *lineSeries = [SCIFastLineRenderableSeries new];
lineSeries.dataSeries = lineDataSeries;
lineSeries.yAxisId = @"PrimaryAxisId";
SCIFastColumnRenderableSeries *columnSeries = [SCIFastColumnRenderableSeries new];
columnSeries.dataSeries = columnDataSeries;
columnSeries.yAxisId = @"SecondaryAxisId";
SCIFastCandlestickRenderableSeries *candlestickSeries = [SCIFastCandlestickRenderableSeries new];
candlestickSeries.dataSeries = candlestickDataSeries;
candlestickSeries.yAxisId = @"PrimaryAxisId";
SCILegendModifier *legendModifier = [SCILegendModifier new];
legendModifier.showCheckBoxes = NO;
[SCIUpdateSuspender usingWithSuspendable:self.surface withBlock:^{
[self.surface.xAxes add:xAxis];
[self.surface.yAxes add:yRightAxis];
[self.surface.yAxes add:yLeftAxis];
[self.surface.renderableSeries add:mountainSeries];
[self.surface.renderableSeries add:lineSeries];
[self.surface.renderableSeries add:columnSeries];
[self.surface.renderableSeries add:candlestickSeries];
[self.surface.chartModifiers add:legendModifier];
[SCIAnimations scaleSeries:mountainSeries withZeroLine:10500 duration:3.0 andEasingFunction:[SCIElasticEase new]];
[SCIAnimations scaleSeries:lineSeries withZeroLine:11700 duration:3.0 andEasingFunction:[SCIElasticEase new]];
[SCIAnimations scaleSeries:columnSeries withZeroLine:12250 duration:3.0 andEasingFunction:[SCIElasticEase new]];
[SCIAnimations scaleSeries:candlestickSeries withZeroLine:10500 duration:3.0 andEasingFunction:[SCIElasticEase new]];
}];
}
@end
//******************************************************************************
// SCICHART® Copyright SciChart Ltd. 2011-2019. All rights reserved.
//
// Web: http://www.scichart.com
// Support: support@scichart.com
// Sales: sales@scichart.com
//
// UsingThemeManagerView.swift is part of the SCICHART® Examples. Permission is hereby granted
// to modify, create derivative works, distribute and publish any part of this source
// code whether for commercial, private or personal use.
//
// The SCICHART® examples are distributed in the hope that they will be useful, but
// without any warranty. It is provided "AS IS" without warranty of any kind, either
// expressed or implied.
//******************************************************************************
class UsingThemeManagerView: SCDThemeManagerViewControllerBase<SCIChartSurface> {
override var associatedType: AnyClass { return SCIChartSurface.self }
override func initExample() {
let xAxis = SCINumericAxis()
xAxis.growBy = SCIDoubleRange(min: 0.1, max: 0.1)
xAxis.visibleRange = SCIDoubleRange(min: 150, max: 180)
let yRightAxis = SCINumericAxis()
yRightAxis.growBy = SCIDoubleRange(min: 0.1, max: 0.1)
yRightAxis.axisAlignment = .right
yRightAxis.autoRange = .always
yRightAxis.axisId = "PrimaryAxisId"
yRightAxis.labelProvider = SCDThousandsLabelProvider()
let yLeftAxis = SCINumericAxis()
yLeftAxis.growBy = SCIDoubleRange(min: 0, max: 3)
yLeftAxis.axisAlignment = .left
yLeftAxis.autoRange = .always
yLeftAxis.axisId = "SecondaryAxisId"
yLeftAxis.labelProvider = SCDBillionsLabelProvider()
let priceData = SCDDataManager.getPriceDataIndu()
let mountainDataSeries = SCIXyDataSeries(xType: .double, yType: .double)
mountainDataSeries.seriesName = "Mountain Series"
let lineDataSeries = SCIXyDataSeries(xType: .double, yType: .double)
lineDataSeries.seriesName = "Line Series"
let columnDataSeries = SCIXyDataSeries(xType: .double, yType: .long)
columnDataSeries.seriesName = "Column Series"
let candlestickDataSeries = SCIOhlcDataSeries(xType: .double, yType: .double)
candlestickDataSeries.seriesName = "Candlestick Series"
mountainDataSeries.append(x: priceData.indexesAsDouble, y: SCDDataManager.offset(priceData.closeData, offset: -1000))
lineDataSeries.append(x: priceData.indexesAsDouble, y: SCDDataManager.computeMovingAverage(of: priceData.closeData, length: 50))
columnDataSeries.append(x: priceData.indexesAsDouble, y: priceData.volumeData)
candlestickDataSeries.append(x: priceData.indexesAsDouble, open:priceData.openData, high:priceData.highData, low:priceData.lowData, close:priceData.closeData)
let mountainSeries = SCIFastMountainRenderableSeries()
mountainSeries.dataSeries = mountainDataSeries
mountainSeries.yAxisId = "PrimaryAxisId"
let lineSeries = SCIFastLineRenderableSeries()
lineSeries.dataSeries = lineDataSeries
lineSeries.yAxisId = "PrimaryAxisId"
let columnSeries = SCIFastColumnRenderableSeries()
columnSeries.dataSeries = columnDataSeries
columnSeries.yAxisId = "SecondaryAxisId"
let candlestickSeries = SCIFastCandlestickRenderableSeries()
candlestickSeries.dataSeries = candlestickDataSeries
candlestickSeries.yAxisId = "PrimaryAxisId"
let legendModifier = SCILegendModifier()
legendModifier.showCheckBoxes = false
SCIUpdateSuspender.usingWith(surface) {
self.surface.xAxes.add(xAxis)
self.surface.yAxes.add(items: yRightAxis, yLeftAxis)
self.surface.renderableSeries.add(items: mountainSeries, lineSeries,candlestickSeries, columnSeries)
self.surface.chartModifiers.add(legendModifier)
SCIAnimations.scale(mountainSeries, withZeroLine: 10500, duration: 3.0, andEasingFunction: SCIElasticEase())
SCIAnimations.scale(lineSeries, withZeroLine: 11700, duration: 3.0, andEasingFunction: SCIElasticEase())
SCIAnimations.scale(columnSeries, withZeroLine: 12250, duration: 3.0, andEasingFunction: SCIElasticEase())
SCIAnimations.scale(candlestickSeries, withZeroLine: 10500, duration: 3.0, andEasingFunction: SCIElasticEase())
}
}
}