SciChart® the market leader in Fast WPF Charts, WPF 3D Charts, iOS Chart, Android Chart and JavaScript Chart Components
Please note! These examples are new to SciChart iOS v4 release! SciChart’s OpenGL ES and Metal iOS and Metal macOS Chart library ships with hundred of Objective-C and Swift iOS&macOS Chart Examples which you can browse, play with and view the source-code. All of this is possible with the new and improved SciChart iOS Examples Suite and demo application for Mac, which ships as part of the SciChart SDK.
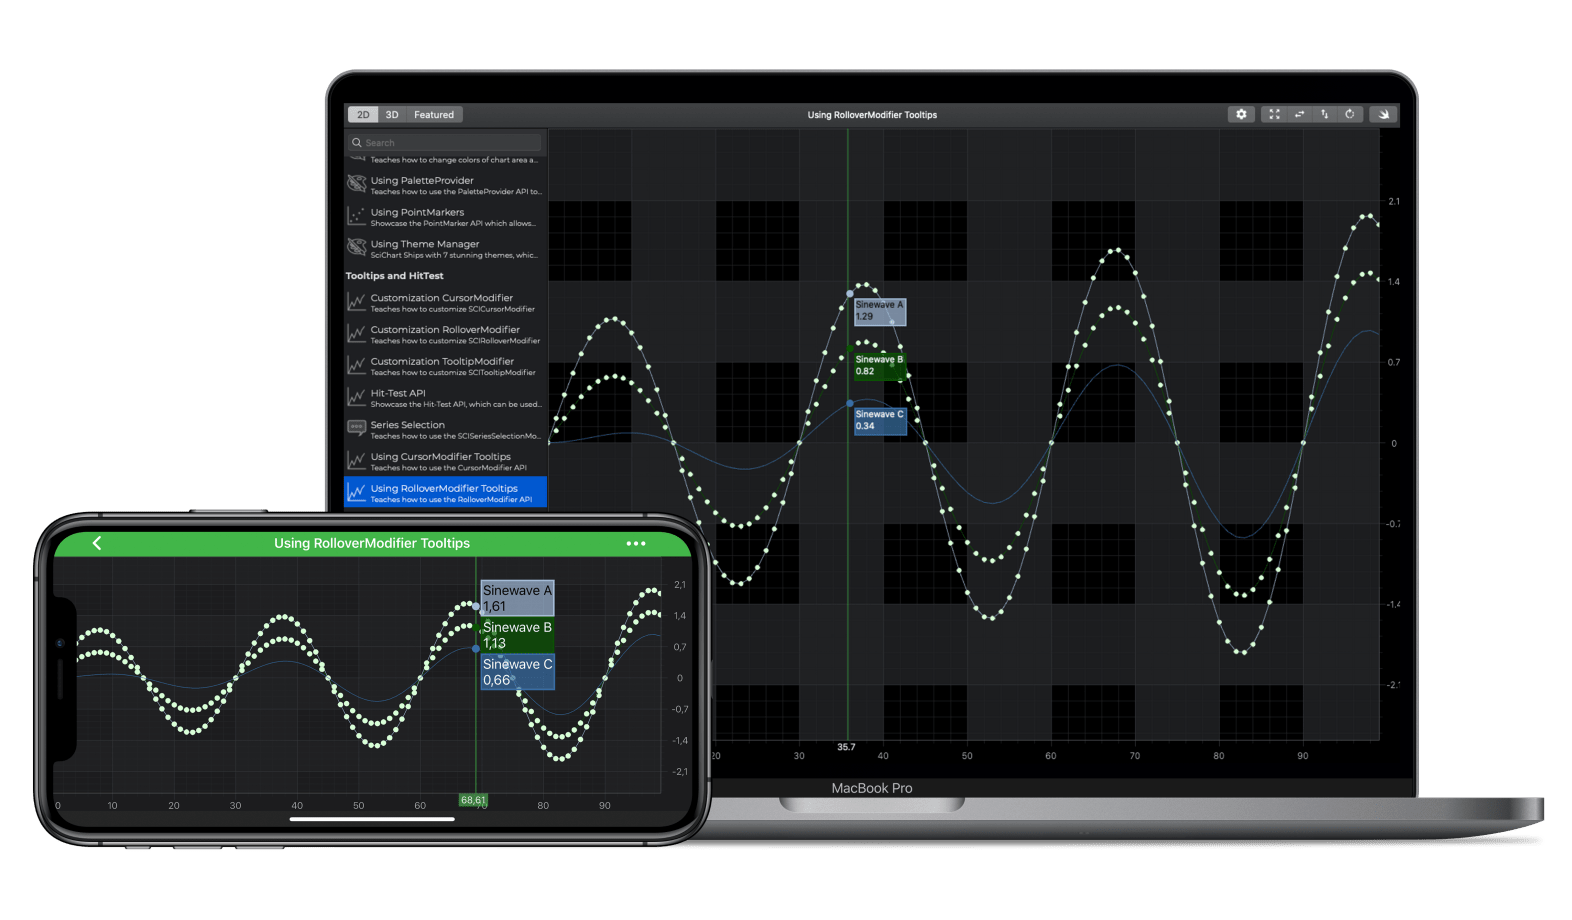
Tooltips may be added to an iOS Chart using the SCIRolloverModifier. This is a SCIChartModifierBase derived type which is attached to the SCIChartSurface.chartModifiers property.
The RolloverModifier provides a vertical line with small ellipse markers where the line intersects the series. Tooltips are displayed next to the marker locations. This tooltip type is particularly useful for stock charts, or for apps displaying a time series, where you need to know the values of many series on an iOS Chart at the same time.
NOTE: See documentation about the SCIRolloverModifier Type here.
The Swift and Objective-C source code for the iOS and macOS Chart with RolloverModifier Tooltips example is included below (Scroll down!).
Did you know that we have the source code for all our example available for free on Github?
Clone the SciChart.iOS.Examples from Github.
Also the SciChart iOS and Scichart macOS Trials contain the full source for the examples (link below).
//******************************************************************************
// SCICHART® Copyright SciChart Ltd. 2011-2019. All rights reserved.
//
// Web: http://www.scichart.com
// Support: support@scichart.com
// Sales: sales@scichart.com
//
// UsingRolloverModifierChartView.m is part of the SCICHART® Examples. Permission is hereby granted
// to modify, create derivative works, distribute and publish any part of this source
// code whether for commercial, private or personal use.
//
// The SCICHART® examples are distributed in the hope that they will be useful, but
// without any warranty. It is provided "AS IS" without warranty of any kind, either
// expressed or implied.
//******************************************************************************
#import "UsingRolloverModifierChartView.h"
@implementation UsingRolloverModifierChartView
- (void)initExample {
id<ISCIAxis> xAxis = [SCINumericAxis new];
id<ISCIAxis> yAxis = [SCINumericAxis new];
yAxis.growBy = [[SCIDoubleRange alloc] initWithMin:0.2 max:0.2];
SCIXyDataSeries *ds1 = [[SCIXyDataSeries alloc] initWithXType:SCIDataType_Int yType:SCIDataType_Double];
ds1.seriesName = @"Sinewave A";
SCIXyDataSeries *ds2 = [[SCIXyDataSeries alloc] initWithXType:SCIDataType_Int yType:SCIDataType_Double];
ds2.seriesName = @"Sinewave B";
SCIXyDataSeries *ds3 = [[SCIXyDataSeries alloc] initWithXType:SCIDataType_Int yType:SCIDataType_Double];
ds3.seriesName = @"Sinewave C";
double count = 100;
double k = 2 * M_PI / 30.0;
for (int i = 0; i < count; i++) {
double phi = k * i;
[ds1 appendX:@(i) y:@((1.0 + i / count) * sin(phi))];
[ds2 appendX:@(i) y:@((0.5 + i / count) * sin(phi))];
[ds3 appendX:@(i) y:@((i / count) * sin(phi))];
}
SCIEllipsePointMarker *ellipsePointMarker = [SCIEllipsePointMarker new];
ellipsePointMarker.fillStyle = [[SCISolidBrushStyle alloc] initWithColorCode:0xFFD7FFD6];
ellipsePointMarker.size = CGSizeMake(7, 7);
SCIFastLineRenderableSeries *rSeries1 = [SCIFastLineRenderableSeries new];
rSeries1.dataSeries = ds1;
rSeries1.pointMarker = ellipsePointMarker;
rSeries1.strokeStyle = [[SCISolidPenStyle alloc] initWithColorCode:0xFFA1B9D7 thickness:1];
SCIFastLineRenderableSeries *rSeries2 = [SCIFastLineRenderableSeries new];
rSeries2.dataSeries = ds2;
rSeries2.pointMarker = ellipsePointMarker;
rSeries2.strokeStyle = [[SCISolidPenStyle alloc] initWithColorCode:0xFF0B5400 thickness:1];
SCIFastLineRenderableSeries *rSeries3 = [SCIFastLineRenderableSeries new];
rSeries3.dataSeries = ds3;
rSeries3.strokeStyle = [[SCISolidPenStyle alloc] initWithColorCode:0xFF386EA6 thickness:1];
self.rolloverModifier = [SCIRolloverModifier new];
self.rolloverModifier.sourceMode = self.sourceMode;
self.rolloverModifier.showTooltip = self.showTooltip;
self.rolloverModifier.showAxisLabel = self.showAxisLabel;
self.rolloverModifier.drawVerticalLine = self.drawVerticalLine;
[SCIUpdateSuspender usingWithSuspendable:self.surface withBlock:^{
[self.surface.xAxes add:xAxis];
[self.surface.yAxes add:yAxis];
[self.surface.renderableSeries add:rSeries1];
[self.surface.renderableSeries add:rSeries2];
[self.surface.renderableSeries add:rSeries3];
[self.surface.chartModifiers add:self.rolloverModifier];
[SCIAnimations sweepSeries:rSeries1 duration:3.0 andEasingFunction:[SCICubicEase new]];
[SCIAnimations sweepSeries:rSeries2 duration:3.0 andEasingFunction:[SCICubicEase new]];
[SCIAnimations sweepSeries:rSeries3 duration:3.0 andEasingFunction:[SCICubicEase new]];
}];
}
@end
//******************************************************************************
// SCICHART® Copyright SciChart Ltd. 2011-2019. All rights reserved.
//
// Web: http://www.scichart.com
// Support: support@scichart.com
// Sales: sales@scichart.com
//
// UsingRolloverModifierChartView.swift is part of the SCICHART® Examples. Permission is hereby granted
// to modify, create derivative works, distribute and publish any part of this source
// code whether for commercial, private or personal use.
//
// The SCICHART® examples are distributed in the hope that they will be useful, but
// without any warranty. It is provided "AS IS" without warranty of any kind, either
// expressed or implied.
//******************************************************************************
class UsingRolloverModifierChartView: SCDUsingRolloverModifierChartViewControllerBase {
override func initExample() {
let xAxis = SCINumericAxis()
let yAxis = SCINumericAxis()
yAxis.growBy = SCIDoubleRange(min: 0.2, max: 0.2)
let ds1 = SCIXyDataSeries(xType: .int, yType: .double)
ds1.seriesName = "Sinewave A"
let ds2 = SCIXyDataSeries(xType: .int, yType: .double)
ds2.seriesName = "Sinewave B"
let ds3 = SCIXyDataSeries(xType: .int, yType: .double)
ds3.seriesName = "Sinewave C"
let count = 100
let k = 2 * .pi / 30.0
for i in 0 ..< count {
let phi = k * Double(i)
ds1.append(x: i, y: (1.0 + Double(i) / Double(count)) * sin(phi))
ds2.append(x: i, y: (0.5 + Double(i) / Double(count)) * sin(phi))
ds3.append(x: i, y: Double(i) / Double(count) * sin(phi))
}
let ellipsePointMarker = SCIEllipsePointMarker()
ellipsePointMarker.fillStyle = SCISolidBrushStyle(colorCode: 0xFFD7FFD6)
ellipsePointMarker.size = CGSize(width: 7, height: 7)
let rSeries1 = SCIFastLineRenderableSeries()
rSeries1.dataSeries = ds1
rSeries1.pointMarker = ellipsePointMarker
rSeries1.strokeStyle = SCISolidPenStyle(colorCode: 0xFFA1B9D7, thickness: 1)
let rSeries2 = SCIFastLineRenderableSeries()
rSeries2.dataSeries = ds2
rSeries2.pointMarker = ellipsePointMarker
rSeries2.strokeStyle = SCISolidPenStyle(colorCode: 0xFF0B5400, thickness: 1)
let rSeries3 = SCIFastLineRenderableSeries()
rSeries3.dataSeries = ds3
rSeries3.strokeStyle = SCISolidPenStyle(colorCode: 0xFF386EA6, thickness: 1)
rolloverModifier = SCIRolloverModifier()
rolloverModifier.sourceMode = sourceMode
rolloverModifier.showTooltip = showTooltip
rolloverModifier.showAxisLabel = showAxisLabel
rolloverModifier.drawVerticalLine = drawVerticalLine
SCIUpdateSuspender.usingWith(surface) {
self.surface.xAxes.add(xAxis)
self.surface.yAxes.add(yAxis)
self.surface.renderableSeries.add(items: rSeries1, rSeries2, rSeries3)
self.surface.chartModifiers.add(self.rolloverModifier)
SCIAnimations.sweep(rSeries1, duration: 3.0, easingFunction: SCICubicEase())
SCIAnimations.sweep(rSeries2, duration: 3.0, easingFunction: SCICubicEase())
SCIAnimations.sweep(rSeries3, duration: 3.0, easingFunction: SCICubicEase())
}
}
}
//******************************************************************************
// SCICHART® Copyright SciChart Ltd. 2011-2020. All rights reserved.
//
// Web: http://www.scichart.com
// Support: support@scichart.com
// Sales: sales@scichart.com
//
// SCDUsingRolloverModifierChartViewControllerBase.m is part of the SCICHART® Examples. Permission is hereby granted
// to modify, create derivative works, distribute and publish any part of this source
// code whether for commercial, private or personal use.
//
// The SCICHART® examples are distributed in the hope that they will be useful, but
// without any warranty. It is provided "AS IS" without warranty of any kind, either
// expressed or implied.
//******************************************************************************
#import "SCDUsingRolloverModifierChartViewControllerBase.h"
#import "SCDSettingsPresenter.h"
#import "SCDToolbarButtonsGroup.h"
#import "SCDToolbarItem.h"
#import "SCDToolbarPopupItem.h"
#import "SCDLabeledSettingsItem.h"
#import "SCDSwitchItem.h"
#import "SCDConstants.h"
@implementation SCDUsingRolloverModifierChartViewControllerBase {
NSArray<NSString *> *_sourceModesNames;
SCDSettingsPresenter *_settingsPresenter;
}
@synthesize rolloverModifier = _rolloverModifier;
@synthesize sourceMode = _sourceMode;
@synthesize showTooltip = _showTooltip;
@synthesize showAxisLabel = _showAxisLabel;
@synthesize drawVerticalLine = _drawVerticalLine;
- (Class)associatedType { return SCIChartSurface.class; }
- (void)commonInit {
_sourceMode = SCISourceMode_AllVisibleSeries;
_showTooltip = YES;
_showAxisLabel = YES;
_drawVerticalLine = YES;
_sourceModesNames = @[
@"AllSeries",
@"AllVisibleSeries",
@"SelectedSeries",
@"UnselectedSeries"
];
}
- (NSArray<id<ISCDToolbarItem>> *)provideExampleSpecificToolbarItems {
__weak typeof(self) wSelf = self;
SCDToolbarButtonsGroup *settingsToolbar = [[SCDToolbarButtonsGroup alloc] initWithToolbarItems:@[
[[SCDToolbarItem alloc] initWithTitle:@"UsingRolloverModifier settings" image:[SCIImage imageNamed:@"chart.settings"] andAction:^{ [wSelf p_SCD_openSettings]; }]
]];
settingsToolbar.identifier = TOOLBAR_MODIFIERS_SETTINGS;
return @[settingsToolbar];
}
- (void)p_SCD_openSettings {
_settingsPresenter = [[SCDSettingsPresenter alloc] initWithSettingsItems:[self p_SCD_createSettingsItems] andIdentifier:TOOLBAR_MODIFIERS_SETTINGS];
}
- (NSArray<id<ISCDToolbarItem>> *)p_SCD_createSettingsItems {
__weak typeof(self) wSelf = self;
SCDToolbarPopupItem *sourceModePopupItem = [[SCDToolbarPopupItem alloc] initWithTitles:_sourceModesNames selectedIndex:_sourceMode andAction:^(NSUInteger selectedIndex) {
[wSelf p_SCD_onSourceModeChange:selectedIndex];
}];
return @[
[[SCDLabeledSettingsItem alloc] initWithLabelText:@"Data Source:" item:sourceModePopupItem],
[[SCDSwitchItem alloc] initWithTitle:@"Show tooltips" isSelected:_showTooltip andAction:^(BOOL showTooltip) {
[wSelf p_SCD_onShowTooltipChange:showTooltip];
}],
[[SCDSwitchItem alloc] initWithTitle:@"Show axis labels" isSelected:_showAxisLabel andAction:^(BOOL showAxisLabel) {
[wSelf p_SCD_onShowAxisLabelChange:showAxisLabel];
}],
[[SCDSwitchItem alloc] initWithTitle:@"Draw vertical line" isSelected:_drawVerticalLine andAction:^(BOOL drawVerticalLine) {
[wSelf p_SCD_onDrawVerticalLineChange:drawVerticalLine];
}]
];
}
- (void)p_SCD_onSourceModeChange:(SCISourceMode)sourceMode {
_sourceMode = sourceMode;
_rolloverModifier.sourceMode = _sourceMode;
}
- (void)p_SCD_onShowTooltipChange:(BOOL)showTooltip {
_showTooltip = showTooltip;
_rolloverModifier.showTooltip = _showTooltip;
}
- (void)p_SCD_onShowAxisLabelChange:(BOOL)showAxisLabel {
_showAxisLabel = showAxisLabel;
_rolloverModifier.showAxisLabel = _showAxisLabel;
}
- (void)p_SCD_onDrawVerticalLineChange:(BOOL)drawVerticalLine {
_drawVerticalLine = drawVerticalLine;
_rolloverModifier.drawVerticalLine = _drawVerticalLine;
}
@end