SciChart® the market leader in Fast WPF Charts, WPF 3D Charts, iOS Chart, Android Chart and JavaScript Chart Components
Please note! These examples are new to SciChart iOS v4 release! SciChart’s OpenGL ES and Metal iOS and Metal macOS Chart library ships with hundred of Objective-C and Swift iOS&macOS Chart Examples which you can browse, play with and view the source-code. All of this is possible with the new and improved SciChart iOS Examples Suite and demo application for Mac, which ships as part of the SciChart SDK.
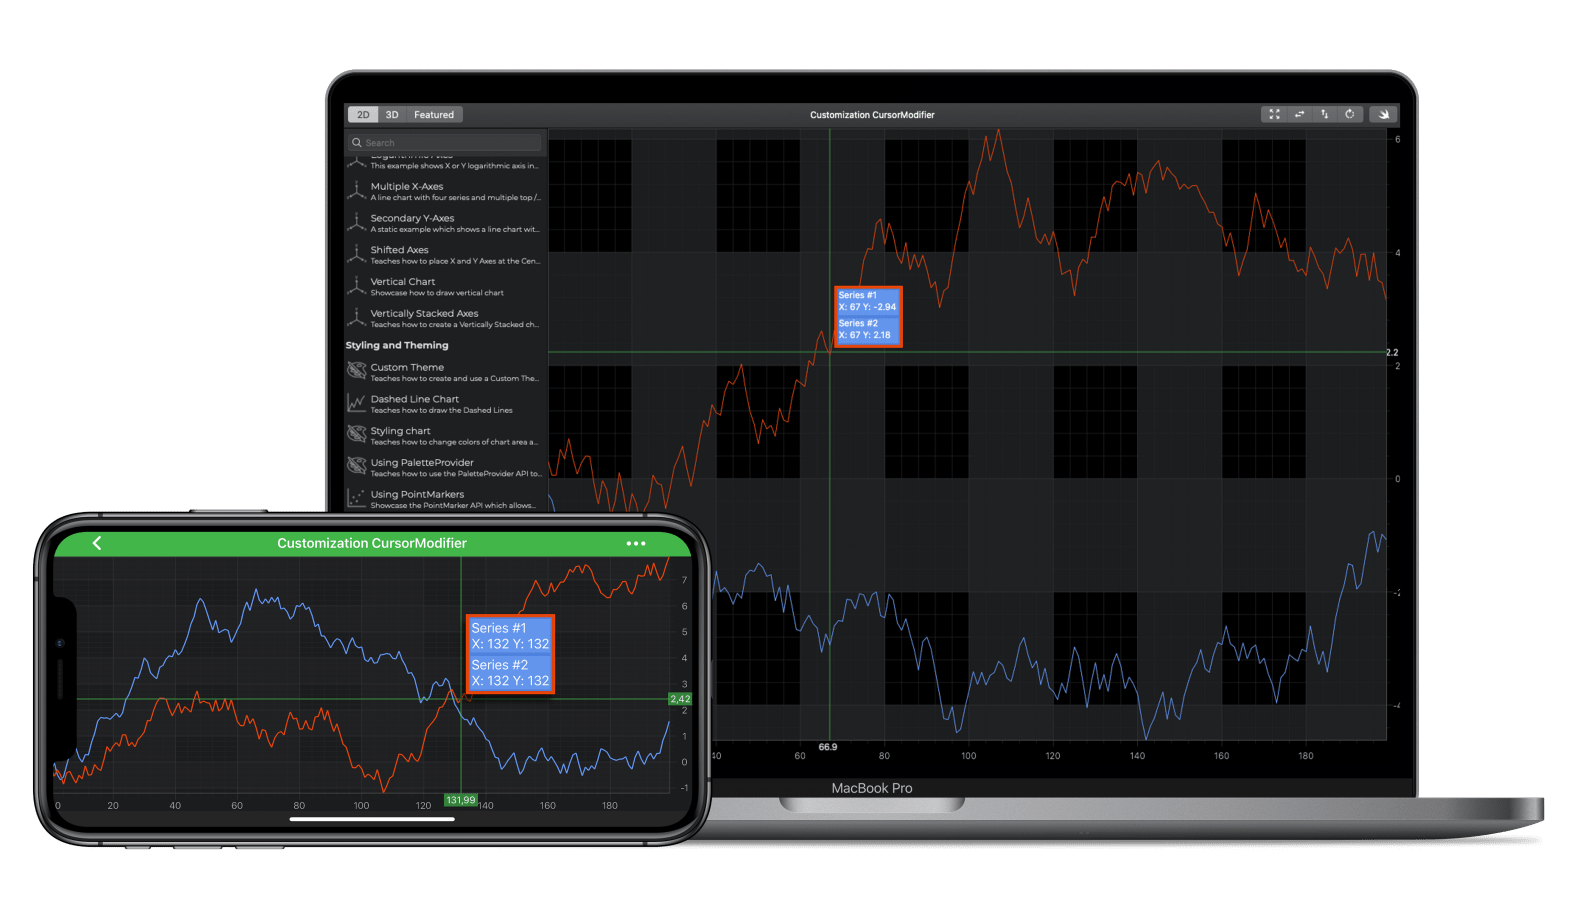
In SciChart iOS, it is possible to customize the look and feel of Tooltips on our iOS Chart control. This example demonstrates how to do this using the SCICursorModifier.
What can be customized? The actual tooltip style (Border, Background, Size, Opacity) as well as text style (Font, Fontsize, weight). The crosshairs lines and also the textformatting of the cursor tooltip itself.
The Swift and Objective-C source code for the iOS and macOS Chart with Custom Cursor and Crosshairs example is included below (Scroll down!).
Did you know that we have the source code for all our example available for free on Github?
Clone the SciChart.iOS.Examples from Github.
Also the SciChart iOS and Scichart macOS Trials contain the full source for the examples (link below).
//******************************************************************************
// SCICHART® Copyright SciChart Ltd. 2011-2019. All rights reserved.
//
// Web: http://www.scichart.com
// Support: support@scichart.com
// Sales: sales@scichart.com
//
// CursorCustomizationChartView.m is part of the SCICHART® Examples. Permission is hereby granted
// to modify, create derivative works, distribute and publish any part of this source
// code whether for commercial, private or personal use.
//
// The SCICHART® examples are distributed in the hope that they will be useful, but
// without any warranty. It is provided "AS IS" without warranty of any kind, either
// expressed or implied.
//******************************************************************************
#import "CursorCustomizationChartView.h"
#import "SCDDataManager.h"
#import "SCDRandomWalkGenerator.h"
#import <SciChart/SCISeriesTooltipBase+Protected.h>
#import <SciChart/SCISeriesInfoProviderBase+Protected.h>
#pragma mark - Cutsom Tooltip Container
@interface CustomCursorTooltipContainer : SCICursorModifierTooltip
@end
@implementation CustomCursorTooltipContainer
- (void)applyThemeProvider:(id<ISCIThemeProvider>)themeProvider {
[super applyThemeProvider:themeProvider];
self.platformBackgroundColor = [SCIColor fromARGBColorCode:0xFFE2460C];
self.layer.borderColor = [SCIColor fromARGBColorCode:0xFFFF4500].CGColor;
}
@end
#pragma mark - Cutsom Series Tooltip
@interface CustomCursorXySeriesTooltip : SCIXySeriesTooltip
@end
@implementation CustomCursorXySeriesTooltip
- (void)internalUpdateWithSeriesInfo:(SCIXySeriesInfo *)seriesInfo {
NSString *string = NSString.empty;
if (seriesInfo.seriesName != nil) {
string = [string stringByAppendingFormat:@"%@\n", seriesInfo.seriesName];
}
string = [string stringByAppendingFormat:@"X: %@ ", seriesInfo.formattedXValue.rawString];
string = [string stringByAppendingFormat:@"Y: %@", seriesInfo.formattedYValue.rawString];
self.text = string;
[self setTooltipBackground:0xFF6495ED];
[self setTooltipStroke:0xFF4D81DD];
[self setTooltipTextColor:0xFFFFFFFF];
}
@end
#pragma mark - Cutsom Info Providers
@interface CustomCursorSeriesInfoProvider : SCIDefaultXySeriesInfoProvider
@end
@implementation CustomCursorSeriesInfoProvider
- (id<ISCISeriesTooltip>)getSeriesTooltipInternalWithSeriesInfo:(SCIXySeriesInfo *)seriesInfo modifierType:(Class)modifierType {
if (modifierType == SCICursorModifier.class) {
return [[CustomCursorXySeriesTooltip alloc] initWithSeriesInfo:seriesInfo];
} else {
return [super getSeriesTooltipInternalWithSeriesInfo:seriesInfo modifierType:modifierType];
}
}
@end
static int const PointsCount = 200;
#pragma mark - Chart Initialization
@implementation CursorCustomizationChartView
- (Class)associatedType { return SCIChartSurface.class; }
- (void)initExample {
id<ISCIAxis> xAxis = [SCINumericAxis new];
id<ISCIAxis> yAxis = [SCINumericAxis new];
SCDRandomWalkGenerator *randomWalkGenerator = [SCDRandomWalkGenerator new];
SCDDoubleSeries *data1 = [randomWalkGenerator getRandomWalkSeries:PointsCount];
[randomWalkGenerator reset];
SCDDoubleSeries *data2 = [randomWalkGenerator getRandomWalkSeries:PointsCount];
SCIXyDataSeries *ds1 = [[SCIXyDataSeries alloc] initWithXType:SCIDataType_Double yType:SCIDataType_Double];
ds1.seriesName = @"Series #1";
SCIXyDataSeries *ds2 = [[SCIXyDataSeries alloc] initWithXType:SCIDataType_Double yType:SCIDataType_Double];
ds2.seriesName = @"Series #2";
[ds1 appendValuesX:data1.xValues y:data1.yValues];
[ds2 appendValuesX:data2.xValues y:data2.yValues];
SCIFastLineRenderableSeries *line1 = [SCIFastLineRenderableSeries new];
line1.dataSeries = ds1;
line1.strokeStyle = [[SCISolidPenStyle alloc] initWithColorCode:0xFF6495ED thickness:2];
line1.seriesInfoProvider = [CustomCursorSeriesInfoProvider new];
SCIFastLineRenderableSeries * line2 = [SCIFastLineRenderableSeries new];
line2.dataSeries = ds2;
line2.strokeStyle = [[SCISolidPenStyle alloc] initWithColorCode:0xFFE2460C thickness:2];
line2.seriesInfoProvider = [CustomCursorSeriesInfoProvider new];
[SCIUpdateSuspender usingWithSuspendable:self.surface withBlock:^{
[self.surface.xAxes add:xAxis];
[self.surface.yAxes add:yAxis];
[self.surface.renderableSeries add:line1];
[self.surface.renderableSeries add:line2];
[self.surface.chartModifiers add:[[SCICursorModifier alloc] initWithTooltipContainer:[CustomCursorTooltipContainer new]]];
[SCIAnimations sweepSeries:line1 duration:3.0 andEasingFunction:[SCICubicEase new]];
[SCIAnimations sweepSeries:line2 duration:3.0 andEasingFunction:[SCICubicEase new]];
}];
}
@end
//******************************************************************************
// SCICHART® Copyright SciChart Ltd. 2011-2019. All rights reserved.
//
// Web: http://www.scichart.com
// Support: support@scichart.com
// Sales: sales@scichart.com
//
// CursorCustomizationChartView.swift is part of the SCICHART® Examples. Permission is hereby granted
// to modify, create derivative works, distribute and publish any part of this source
// code whether for commercial, private or personal use.
//
// The SCICHART® examples are distributed in the hope that they will be useful, but
// without any warranty. It is provided "AS IS" without warranty of any kind, either
// expressed or implied.
//******************************************************************************
import SciChart.Protected.SCISeriesTooltipBase
import SciChart.Protected.SCISeriesInfoProviderBase
class CursorCustomizationChartView: SCDSingleChartViewController<SCIChartSurface> {
override var associatedType: AnyClass { return SCIChartSurface.self }
private class CustomCursorTooltipContainer: SCICursorModifierTooltip {
override func apply(_ themeProvider: ISCIThemeProvider) {
super.apply(themeProvider)
self.platformBackgroundColor = SCIColor.fromARGBColorCode(0xFFE2460C)
#if os(OSX)
self.layer?.borderColor = SCIColor.fromARGBColorCode(0xFFFF4500).cgColor
#elseif os(iOS)
self.layer.borderColor = SCIColor.fromARGBColorCode(0xFFFF4500).cgColor
#endif
}
}
private class CustomCursorSeriesInfoProvider: SCIDefaultXySeriesInfoProvider {
class CustomCursorXySeriesTooltip: SCIXySeriesTooltip {
override func internalUpdate(with seriesInfo: SCIXySeriesInfo) {
var string = NSString.empty
if let seriesName = seriesInfo.seriesName {
string += "\(seriesName)\n"
}
string += "X: \(seriesInfo.formattedXValue.rawString) Y: \(seriesInfo.formattedYValue.rawString)"
self.text = string;
setTooltipBackground(0xFF6495ED);
setTooltipStroke(0xFF4D81DD);
setTooltipTextColor(0xFFFFFFFF);
}
}
override func getSeriesTooltipInternal(seriesInfo: SCIXySeriesInfo, modifierType: AnyClass) -> ISCISeriesTooltip {
if (modifierType == SCICursorModifier.self) {
return CustomCursorXySeriesTooltip(seriesInfo: seriesInfo)
} else {
return super.getSeriesTooltipInternal(seriesInfo: seriesInfo, modifierType: modifierType)
}
}
}
private let PointsCount = 200
override func initExample() {
let xAxis = SCINumericAxis()
let yAxis = SCINumericAxis()
let randomWalkGenerator = SCDRandomWalkGenerator()
let data1 = randomWalkGenerator.getRandomWalkSeries(PointsCount)
randomWalkGenerator.reset()
let data2 = randomWalkGenerator.getRandomWalkSeries(PointsCount)
let ds1 = SCIXyDataSeries(xType: .double, yType: .double)
ds1.seriesName = "Series #1"
let ds2 = SCIXyDataSeries(xType: .double, yType: .double)
ds2.seriesName = "Series #2"
ds1.append(x: data1.xValues, y: data1.yValues)
ds2.append(x: data2.xValues, y: data2.yValues)
let line1 = SCIFastLineRenderableSeries()
line1.dataSeries = ds1
line1.strokeStyle = SCISolidPenStyle(color: 0xFF6495ED, thickness: 2)
line1.seriesInfoProvider = CustomCursorSeriesInfoProvider()
let line2 = SCIFastLineRenderableSeries()
line2.dataSeries = ds2
line2.strokeStyle = SCISolidPenStyle(color: 0xFFE2460C, thickness: 2)
line2.seriesInfoProvider = CustomCursorSeriesInfoProvider()
SCIUpdateSuspender.usingWith(surface) {
self.surface.xAxes.add(xAxis)
self.surface.yAxes.add(yAxis)
self.surface.renderableSeries.add(items: line1, line2)
self.surface.chartModifiers.add(SCICursorModifier(tooltipContainer: CustomCursorTooltipContainer()))
}
}
}