SciChart® the market leader in Fast WPF Charts, WPF 3D Charts, iOS Chart, Android Chart and JavaScript Chart Components
Please note! These examples are new to SciChart iOS v4 release! SciChart’s OpenGL ES and Metal iOS and Metal macOS Chart library ships with hundred of Objective-C and Swift iOS&macOS Chart Examples which you can browse, play with and view the source-code. All of this is possible with the new and improved SciChart iOS Examples Suite and demo application for Mac, which ships as part of the SciChart SDK.
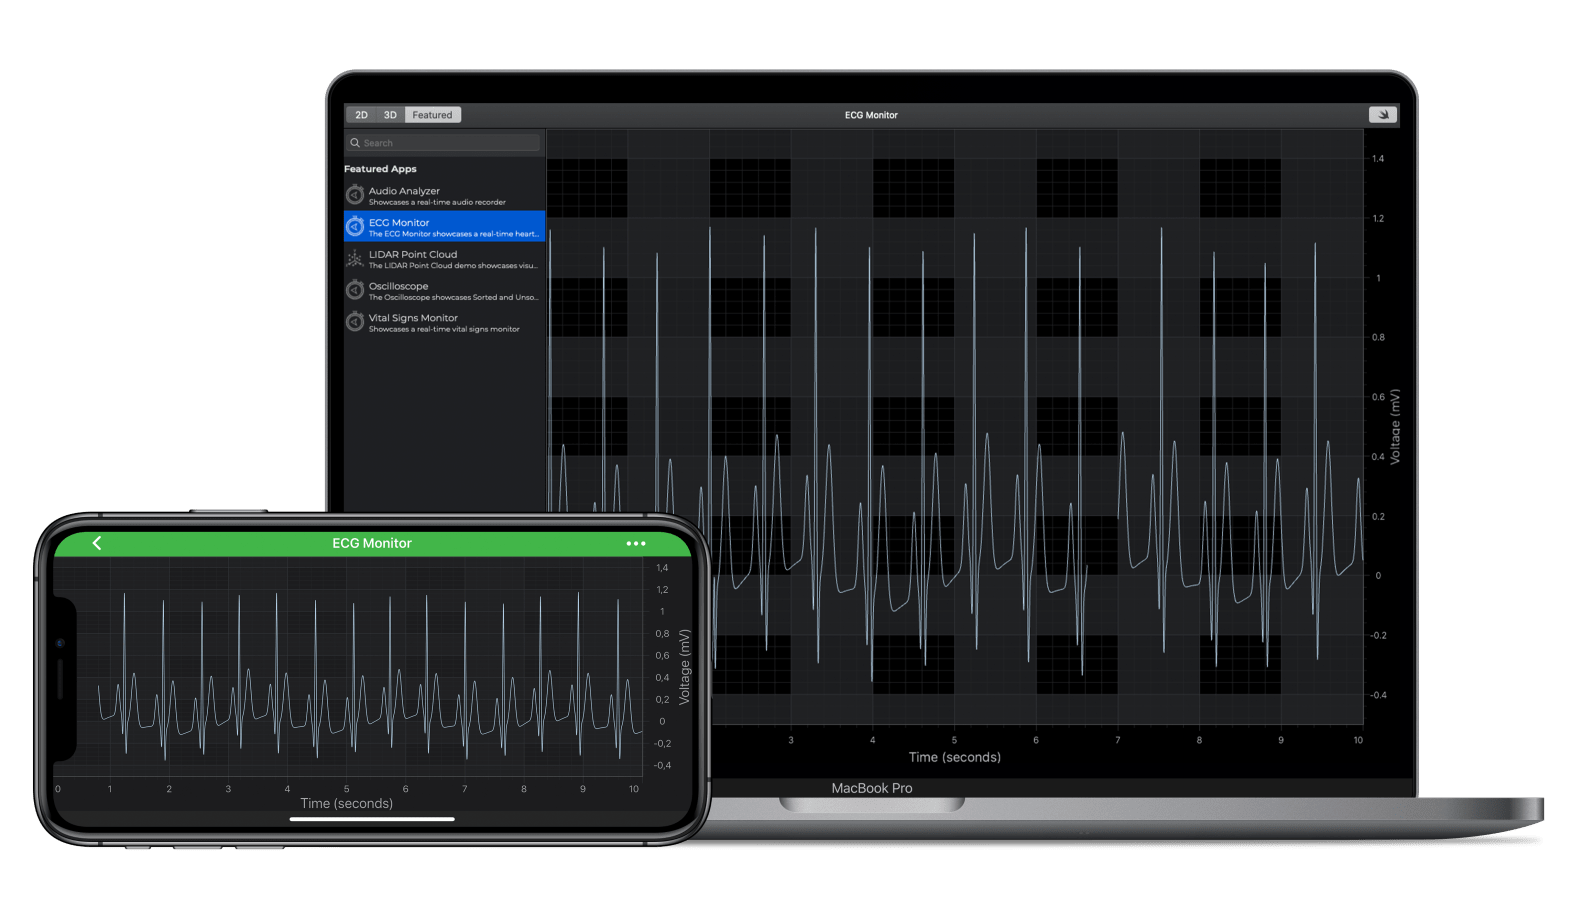
The iOS ECG Monitor Demo shows how to create a simple ECG / EKG Heart Rate Monitor App using SciChart iOS.
In this example, we use a SCIFastLineRenderableSeries with data provided by SCIXyDataSeries. The DataSeries is in FIFO ‘First in first out’ mode so that old points are discarded once a limit of points is reached. Sweeping is achieved by overlaying two series, so that when the trace reaches the right edge, it wraps around again to the beginning.
The app is realtime and smooth, showcasing that SciChart iOS is suitable for use in realtime medical or health tracking applications.
The Swift and Objective-C source code for the iOS and macOS ECG Monitor Demo example is included below (Scroll down!).
Did you know that we have the source code for all our example available for free on Github?
Clone the SciChart.iOS.Examples from Github.
Also the SciChart iOS and Scichart macOS Trials contain the full source for the examples (link below).
//******************************************************************************
// SCICHART® Copyright SciChart Ltd. 2011-2019. All rights reserved.
//
// Web: http://www.scichart.com
// Support: support@scichart.com
// Sales: sales@scichart.com
//
// ECGChartView.m is part of the SCICHART® Examples. Permission is hereby granted
// to modify, create derivative works, distribute and publish any part of this source
// code whether for commercial, private or personal use.
//
// The SCICHART® examples are distributed in the hope that they will be useful, but
// without any warranty. It is provided "AS IS" without warranty of any kind, either
// expressed or implied.
//******************************************************************************
#import "ECGChartView.h"
#include "SCDDataManager.h"
static double const TimeInterval = 0.02;
@implementation ECGChartView {
SCIXyDataSeries *_series0;
SCIXyDataSeries *_series1;
NSArray *_sourceData;
NSTimer *_timer;
NSUInteger _currentIndex;
int _totalIndex;
TraceAOrB _whichTrace;
}
- (Class)associatedType { return SCIChartSurface.class; }
- (BOOL)showDefaultModifiersInToolbar { return NO; }
- (void)initExample {
_sourceData = [SCDDataManager loadWaveformData];
id<ISCIAxis> xAxis = [SCINumericAxis new];
xAxis.autoRange = SCIAutoRange_Never;
xAxis.axisTitle = @"Time (seconds)";
xAxis.visibleRange = [[SCIDoubleRange alloc] initWithMin:0 max:10];
id<ISCIAxis> yAxis = [SCINumericAxis new];
yAxis.autoRange = SCIAutoRange_Never;
yAxis.axisTitle = @"Voltage (mV)";
yAxis.visibleRange = [[SCIDoubleRange alloc] initWithMin:-0.5 max:1.5];
_series0 = [[SCIXyDataSeries alloc] initWithXType:SCIDataType_Double yType:SCIDataType_Double];
_series0.fifoCapacity = 3850;
_series1 = [[SCIXyDataSeries alloc] initWithXType:SCIDataType_Double yType:SCIDataType_Double];
_series1.fifoCapacity = 3850;
SCIFastLineRenderableSeries * rSeries1 = [SCIFastLineRenderableSeries new];
rSeries1.dataSeries = _series0;
SCIFastLineRenderableSeries * rSeries2 = [SCIFastLineRenderableSeries new];
rSeries2.dataSeries = _series1;
[SCIUpdateSuspender usingWithSuspendable:self.surface withBlock:^{
[self.surface.xAxes add:xAxis];
[self.surface.yAxes add:yAxis];
[self.surface.renderableSeries add:rSeries1];
[self.surface.renderableSeries add:rSeries2];
}];
_timer = [NSTimer scheduledTimerWithTimeInterval:TimeInterval target:self selector:@selector(appendData:) userInfo:nil repeats:YES];
}
- (void)appendData:(NSTimer *)timer {
for (int i = 0; i < 10; i++) {
[self appendPoint:400];
}
}
- (void)appendPoint:(double)sampleRate {
if (_currentIndex >= _sourceData.count) {
_currentIndex = 0;
}
// Get the next voltage and time, and append to the chart
double voltage = [[_sourceData objectAtIndex:_currentIndex] doubleValue];
double time = fmod((_totalIndex / sampleRate), 10.0);
if (_whichTrace == TraceA) {
[_series0 appendX:@(time) y:@(voltage)];
[_series1 appendX:@(time) y:@(NAN)];
} else {
[_series0 appendX:@(time) y:@(NAN)];
[_series1 appendX:@(time) y:@(voltage)];
}
_currentIndex++;
_totalIndex++;
if (_totalIndex % 4000 == 0) {
_whichTrace = _whichTrace == TraceA ? TraceB : TraceA;
}
}
- (void)viewDidDisappear:(BOOL)animated {
[super viewDidDisappear:animated];
[_timer invalidate];
_timer = nil;
}
@end
//******************************************************************************
// SCICHART® Copyright SciChart Ltd. 2011-2019. All rights reserved.
//
// Web: http://www.scichart.com
// Support: support@scichart.com
// Sales: sales@scichart.com
//
// ECGChartView.swift is part of the SCICHART® Examples. Permission is hereby granted
// to modify, create derivative works, distribute and publish any part of this source
// code whether for commercial, private or personal use.
//
// The SCICHART® examples are distributed in the hope that they will be useful, but
// without any warranty. It is provided "AS IS" without warranty of any kind, either
// expressed or implied.
//******************************************************************************
enum TraceAOrB {
case TraceA
case TraceB
}
class ECGChartView: SCDSingleChartViewController<SCIChartSurface> {
override var associatedType: AnyClass { return SCIChartSurface.self }
override var showDefaultModifiersInToolbar: Bool { return false }
let TimeInterval = 0.02;
var _series0: SCIXyDataSeries = SCIXyDataSeries(xType: .double, yType: .double)
var _series1: SCIXyDataSeries = SCIXyDataSeries(xType: .double, yType: .double)
let _sourceData = SCDDataManager.loadWaveformData()
var _timer: Timer!
var _currentIndex: Int = 0
var _totalIndex = 0.0
var _whichTrace: TraceAOrB = .TraceA
override func initExample() {
let xAxis = SCINumericAxis()
xAxis.autoRange = .never
xAxis.axisTitle = "Time (seconds)"
xAxis.visibleRange = SCIDoubleRange(min: 0, max: 10)
let yAxis = SCINumericAxis()
yAxis.autoRange = .never
yAxis.axisTitle = "Voltage (mV)"
yAxis.visibleRange = SCIDoubleRange(min: -0.5, max: 1.5)
_series0.fifoCapacity = 3850
_series1.fifoCapacity = 3850
let rSeries0 = SCIFastLineRenderableSeries()
rSeries0.dataSeries = _series0;
let rSeries1 = SCIFastLineRenderableSeries()
rSeries1.dataSeries = _series1;
SCIUpdateSuspender.usingWith(surface) {
self.surface.xAxes.add(xAxis)
self.surface.yAxes.add(yAxis)
self.surface.renderableSeries.add(rSeries0)
self.surface.renderableSeries.add(rSeries1)
}
_timer = Timer.scheduledTimer(timeInterval: TimeInterval, target: self, selector: #selector(appendData), userInfo: nil, repeats: true)
}
@objc fileprivate func appendData() {
for _ in 0 ..< 10 {
appendPoint(400)
}
}
fileprivate func appendPoint(_ sampleRate: Double) {
if _currentIndex >= _sourceData.count {
_currentIndex = 0
}
// Get the next voltage and time, and append to the chart
let voltage = Double(_sourceData[_currentIndex] as! String)!
let time = fmod(_totalIndex / sampleRate, 10.0)
if (_whichTrace == .TraceA) {
_series0.append(x: time, y: voltage)
_series1.append(x: time, y: Double.nan)
} else {
_series0.append(x: time, y: Double.nan)
_series1.append(x: time, y: voltage)
}
_currentIndex += 1
_totalIndex += 1
if (Int(_totalIndex) % 4000 == 0) {
_whichTrace = _whichTrace == .TraceA ? .TraceB : .TraceA;
}
}
override func viewDidDisappear(_ animated: Bool) {
super.viewDidDisappear(animated)
_timer?.invalidate()
_timer = nil
}
}