SciChart® the market leader in Fast WPF Charts, WPF 3D Charts, iOS Chart, Android Chart and JavaScript Chart Components
Please note! These examples are new to SciChart iOS v4 release! SciChart’s OpenGL ES and Metal iOS and Metal macOS Chart library ships with hundred of Objective-C and Swift iOS&macOS Chart Examples which you can browse, play with and view the source-code. All of this is possible with the new and improved SciChart iOS Examples Suite and demo application for Mac, which ships as part of the SciChart SDK.
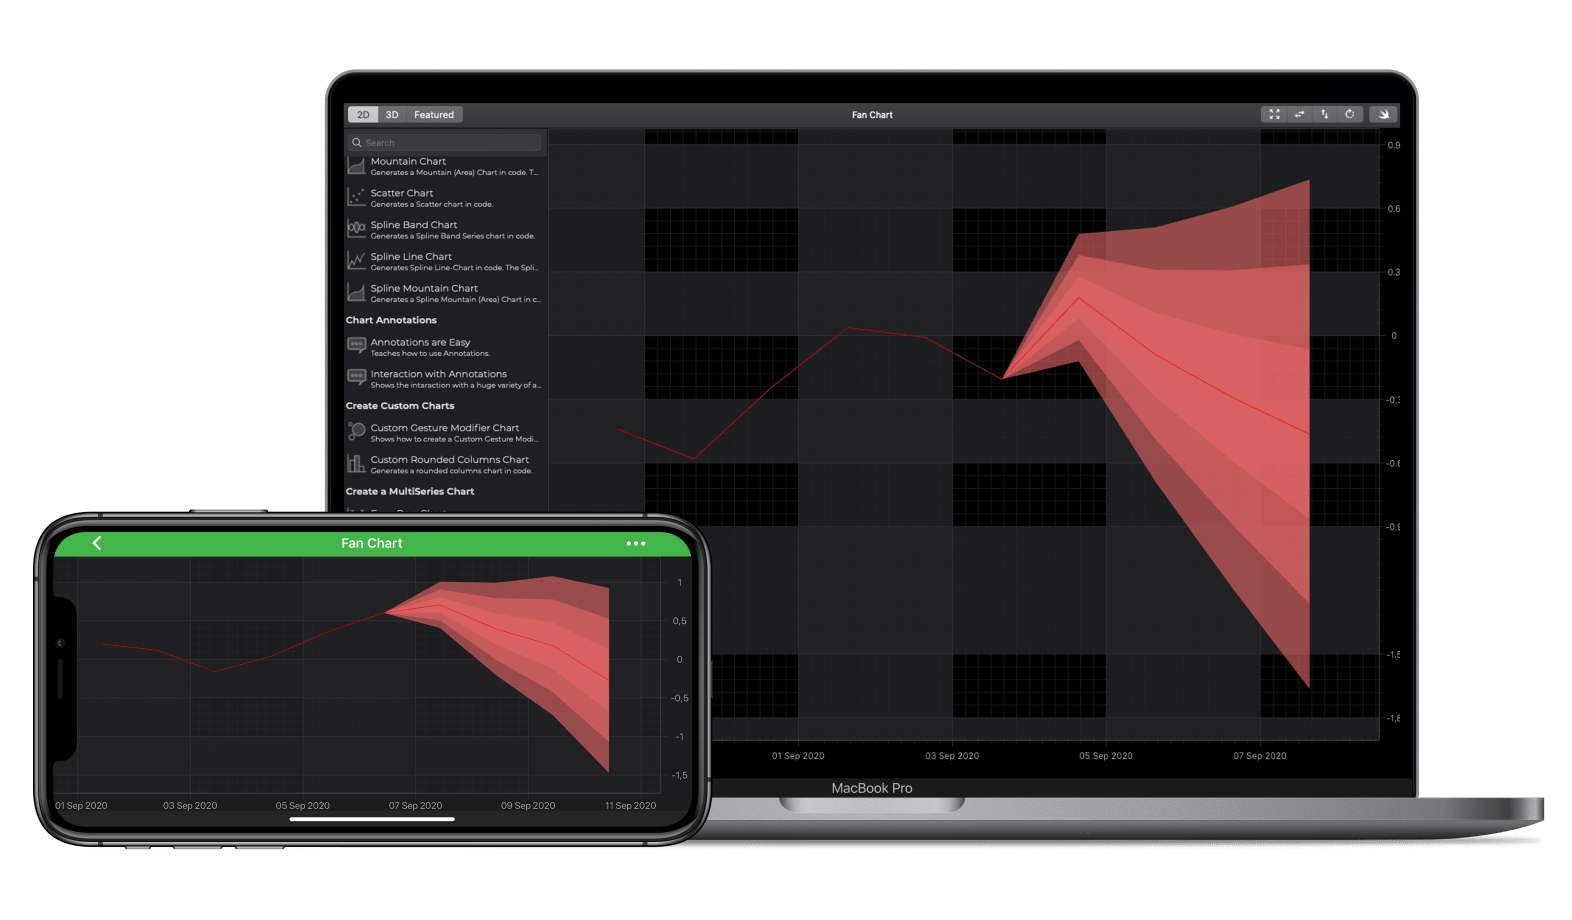
Demonstrates how to use multiple SCIFastBandRenderableSeries to create an iOS Fan Chart. In this example, we overlay several Band-Series with varying opacity to create a Fan-chart effect. See Documentation on how to use this type here: The iOS Band Chart Documentation.
A Fan Chart may be used to visualize statistical uncertainty, such as forecasts or margins of error in a known timeseries.
The SCIFastBandRenderableSeries requires an ISCIXyyDataSeries , which has X,Y0,Y1 points, to display a solid band between high and low Y-value.
The Swift and Objective-C source code for the iOS and macOS Fan Chart example is included below (Scroll down!).
Did you know that we have the source code for all our example available for free on Github?
Clone the SciChart.iOS.Examples from Github.
Also the SciChart iOS and Scichart macOS Trials contain the full source for the examples (link below).
//******************************************************************************
// SCICHART® Copyright SciChart Ltd. 2011-2019. All rights reserved.
//
// Web: http://www.scichart.com
// Support: support@scichart.com
// Sales: sales@scichart.com
//
// FanChartView.m is part of the SCICHART® Examples. Permission is hereby granted
// to modify, create derivative works, distribute and publish any part of this source
// code whether for commercial, private or personal use.
//
// The SCICHART® examples are distributed in the hope that they will be useful, but
// without any warranty. It is provided "AS IS" without warranty of any kind, either
// expressed or implied.
//******************************************************************************
#import "FanChartView.h"
#import "SCDRandomWalkGenerator.h"
@interface VarPoint : NSObject
@property(readonly, nonatomic) NSDate *date;
@property(readonly, nonatomic) NSNumber *actual;
@property(readonly, nonatomic) NSNumber *varMax;
@property(readonly, nonatomic) NSNumber *var4;
@property(readonly, nonatomic) NSNumber *var3;
@property(readonly, nonatomic) NSNumber *var2;
@property(readonly, nonatomic) NSNumber *var1;
@property(readonly, nonatomic) NSNumber *varMin;
- (instancetype)initWithDate:(NSDate *)date actual:(double)actual var4:(double)var4 var3:(double)var3 var2:(double)var2 var1:(double)var1 varMin:(double)varMin varMax:(double)varMax;
@end
@implementation VarPoint
- (instancetype)initWithDate:(NSDate *)date actual:(double)actual var4:(double)var4 var3:(double)var3 var2:(double)var2 var1:(double)var1 varMin:(double)varMin varMax:(double)varMax {
self = [super init];
if (self) {
_date = date;
_actual = @(actual);
_var4 = @(var4);
_var3 = @(var3);
_var2 = @(var2);
_var1 = @(var1);
_varMin = @(varMin);
_varMax = @(varMax);
}
return self;
}
@end
@implementation FanChartView
- (Class)associatedType { return SCIChartSurface.class; }
- (void)initExample {
id<ISCIAxis> xAxis = [SCIDateAxis new];
xAxis.growBy = [[SCIDoubleRange alloc] initWithMin:0.1 max:0.1];
id<ISCIAxis> yAxis = [SCINumericAxis new];
yAxis.growBy = [[SCIDoubleRange alloc] initWithMin:0.1 max:0.1];
SCIXyDataSeries *actualDataSeries = [[SCIXyDataSeries alloc] initWithXType:SCIDataType_Date yType:SCIDataType_Double];
SCIXyyDataSeries *var3DataSeries = [[SCIXyyDataSeries alloc] initWithXType:SCIDataType_Date yType:SCIDataType_Double];
SCIXyyDataSeries *var2DataSeries = [[SCIXyyDataSeries alloc] initWithXType:SCIDataType_Date yType:SCIDataType_Double];
SCIXyyDataSeries *var1DataSeries = [[SCIXyyDataSeries alloc] initWithXType:SCIDataType_Date yType:SCIDataType_Double];
NSArray *varianceData = [self getVarianceData];
for (NSUInteger i = 0; i < varianceData.count; i++) {
VarPoint *dataPoint = (VarPoint *)[varianceData objectAtIndex:i];
[actualDataSeries appendX:dataPoint.date y:dataPoint.actual];
[var3DataSeries appendX:dataPoint.date y:dataPoint.varMin y1:dataPoint.varMax];
[var2DataSeries appendX:dataPoint.date y:dataPoint.var1 y1:dataPoint.var4];
[var1DataSeries appendX:dataPoint.date y:dataPoint.var2 y1:dataPoint.var3];
}
SCIFastBandRenderableSeries *projectedVar3 = [SCIFastBandRenderableSeries new];
projectedVar3.dataSeries = var3DataSeries;
projectedVar3.strokeStyle = [[SCISolidPenStyle alloc] initWithColor:SCIColor.clearColor thickness:1];
projectedVar3.strokeY1Style = [[SCISolidPenStyle alloc] initWithColor:SCIColor.clearColor thickness:1];
SCIFastBandRenderableSeries *projectedVar2 = [SCIFastBandRenderableSeries new];
projectedVar2.dataSeries = var2DataSeries;
projectedVar2.strokeStyle = [[SCISolidPenStyle alloc] initWithColor:SCIColor.clearColor thickness:1];
projectedVar2.strokeY1Style = [[SCISolidPenStyle alloc] initWithColor:SCIColor.clearColor thickness:1];
SCIFastBandRenderableSeries *projectedVar1 = [SCIFastBandRenderableSeries new];
projectedVar1.dataSeries = var1DataSeries;
projectedVar1.strokeStyle = [[SCISolidPenStyle alloc] initWithColor:SCIColor.clearColor thickness:1];
projectedVar1.strokeY1Style = [[SCISolidPenStyle alloc] initWithColor:SCIColor.clearColor thickness:1];
SCIFastLineRenderableSeries *lineSeries = [SCIFastLineRenderableSeries new];
lineSeries.dataSeries = actualDataSeries;
lineSeries.strokeStyle = [[SCISolidPenStyle alloc] initWithColor:SCIColor.redColor thickness:1];
[SCIUpdateSuspender usingWithSuspendable:self.surface withBlock:^{
[self.surface.xAxes add:xAxis];
[self.surface.yAxes add:yAxis];
[self.surface.renderableSeries add:projectedVar3];
[self.surface.renderableSeries add:projectedVar2];
[self.surface.renderableSeries add:projectedVar1];
[self.surface.renderableSeries add:lineSeries];
[self.surface.chartModifiers add:[SCDExampleBaseViewController createDefaultModifiers]];
[SCIAnimations waveSeries:projectedVar3 duration:3.0 andEasingFunction:[SCICubicEase new]];
[SCIAnimations waveSeries:projectedVar2 duration:3.0 andEasingFunction:[SCICubicEase new]];
[SCIAnimations waveSeries:projectedVar1 duration:3.0 andEasingFunction:[SCICubicEase new]];
[SCIAnimations waveSeries:lineSeries duration:3.0 andEasingFunction:[SCICubicEase new]];
}];
}
// Create a table of Variance data. Each row in the table consists of
//
// DateTime, Actual (Y-Value), Projected Min, Variance 1, 2, 3, 4 and Projected Maximum
//
// DateTime Actual Min Var1 Var2 Var3 Var4 Max
// Jan-11 y0 - - - - - -
// Feb-11 y1 - - - - - -
// Mar-11 y2 - - - - - -
// Apr-11 y3 - - - - - -
// May-11 y4 - - - - - -
// Jun-11 y5 min0 var1_0 var2_0 var3_0 var4_0 max_0
// Jul-11 y6 min1 var1_1 var2_1 var3_1 var4_1 max_1
// Aug-11 y7 min2 var1_2 var2_2 var3_2 var4_2 max_2
// Dec-11 y8 min3 var1_3 var2_3 var3_3 var4_3 max_3
// Jan-12 y9 min4 var1_4 var2_4 var3_4 var4_4 max_4
- (NSArray *)getVarianceData {
NSMutableArray *result = [NSMutableArray new];
int count = 10;
NSDate *date = [NSDate date];
double yValue;
SCIDoubleValues *yValues = [[SCDRandomWalkGenerator new] getRandomWalkSeries:count].yValues;
for (int i = 0; i < count; i++) {
date = [date dateByAddingTimeInterval: 3600*24];
yValue = [yValues getValueAt:i];
double varMax = NAN;
double var4 = NAN;
double var3 = NAN;
double var2 = NAN;
double var1 = NAN;
double varMin = NAN;
if (i > 4) {
varMax = yValue + (i - 5) * 0.3;
var4 = yValue + (i - 5) * 0.2;
var3 = yValue + (i - 5) * 0.1;
var2 = yValue - (i - 5) * 0.1;
var1 = yValue - (i - 5) * 0.2;
varMin = yValue - (i - 5) * 0.3;
}
[result addObject:[[VarPoint alloc] initWithDate:date actual:yValue var4:var4 var3:var3 var2:var2 var1:var1 varMin:varMin varMax:varMax]];
}
return result;
}
@end
//******************************************************************************
// SCICHART® Copyright SciChart Ltd. 2011-2019. All rights reserved.
//
// Web: http://www.scichart.com
// Support: support@scichart.com
// Sales: sales@scichart.com
//
// FanChartView.swift is part of the SCICHART® Examples. Permission is hereby granted
// to modify, create derivative works, distribute and publish any part of this source
// code whether for commercial, private or personal use.
//
// The SCICHART® examples are distributed in the hope that they will be useful, but
// without any warranty. It is provided "AS IS" without warranty of any kind, either
// expressed or implied.
//******************************************************************************
struct VarPoint {
var date: Date
var actual: Double
var varMax: Double
var var1: Double
var var2: Double
var var3: Double
var var4: Double
var varMin: Double
}
class FanChartView: SCDSingleChartViewController<SCIChartSurface> {
override var associatedType: AnyClass { return SCIChartSurface.self }
override func initExample() {
let xAxis = SCIDateAxis()
xAxis.growBy = SCIDoubleRange(min: 0.1, max: 0.1)
let yAxis = SCINumericAxis()
yAxis.growBy = SCIDoubleRange(min: 0.1, max: 0.1)
let actualDataSeries = SCIXyDataSeries(xType:.date, yType:.double)
let var3DataSeries = SCIXyyDataSeries(xType:.date, yType:.double)
let var2DataSeries = SCIXyyDataSeries(xType:.date, yType:.double)
let var1DataSeries = SCIXyyDataSeries(xType:.date, yType:.double)
self.generatingDataPoints(10) { (result: VarPoint) in
actualDataSeries.append(x: result.date, y: result.actual)
var3DataSeries.append(x: result.date, y: result.varMin, y1: result.varMax)
var2DataSeries.append(x: result.date, y: result.var1, y1: result.var4)
var1DataSeries.append(x: result.date, y: result.var2, y1: result.var3)
}
let projectedVar3 = SCIFastBandRenderableSeries()
projectedVar3.dataSeries = var3DataSeries
projectedVar3.strokeStyle = SCISolidPenStyle(color: .clear, thickness: 1.0)
projectedVar3.strokeY1Style = SCISolidPenStyle(color: .clear, thickness: 1.0)
let projectedVar2 = SCIFastBandRenderableSeries()
projectedVar2.dataSeries = var2DataSeries
projectedVar2.strokeStyle = SCISolidPenStyle(color: .clear, thickness: 1.0)
projectedVar2.strokeY1Style = SCISolidPenStyle(color: .clear, thickness: 1.0)
let projectedVar1 = SCIFastBandRenderableSeries()
projectedVar1.dataSeries = var1DataSeries
projectedVar1.strokeStyle = SCISolidPenStyle(color: .clear, thickness: 1.0)
projectedVar1.strokeY1Style = SCISolidPenStyle(color: .clear, thickness: 1.0)
let lineSeries = SCIFastLineRenderableSeries()
lineSeries.dataSeries = actualDataSeries
lineSeries.strokeStyle = SCISolidPenStyle(color: .red, thickness: 1.0)
SCIUpdateSuspender.usingWith(surface) {
self.surface.xAxes.add(xAxis)
self.surface.yAxes.add(yAxis)
self.surface.renderableSeries.add(items: projectedVar3, projectedVar2, projectedVar1, lineSeries)
self.surface.chartModifiers.add(SCDExampleBaseViewController.createDefaultModifiers())
SCIAnimations.wave(projectedVar3, duration: 3.0, andEasingFunction: SCICubicEase())
SCIAnimations.wave(projectedVar2, duration: 3.0, andEasingFunction: SCICubicEase())
SCIAnimations.wave(projectedVar1, duration: 3.0, andEasingFunction: SCICubicEase())
SCIAnimations.wave(lineSeries, duration: 3.0, andEasingFunction: SCICubicEase())
}
}
// Create a table of Variance data. Each row in the table consists of
//
// DateTime, Actual (Y-Value), Projected Min, Variance 1, 2, 3, 4 and Projected Maximum
//
// DateTime Actual Min Var1 Var2 Var3 Var4 Max
// Jan-11 y0 - - - - - -
// Feb-11 y1 - - - - - -
// Mar-11 y2 - - - - - -
// Apr-11 y3 - - - - - -
// May-11 y4 - - - - - -
// Jun-11 y5 min0 var1_0 var2_0 var3_0 var4_0 max_0
// Jul-11 y6 min1 var1_1 var2_1 var3_1 var4_1 max_1
// Aug-11 y7 min2 var1_2 var2_2 var3_2 var4_2 max_2
// Dec-11 y8 min3 var1_3 var2_3 var3_3 var4_3 max_3
// Jan-12 y9 min4 var1_4 var2_4 var3_4 var4_4 max_4
fileprivate func generatingDataPoints(_ count: Int, handler: (VarPoint) -> Void) {
var dateTime = Date()
let yValues = SCDRandomWalkGenerator().getRandomWalkSeries(count).yValues
for i in 0 ..< count {
let yValue = yValues.getValueAt(i)
dateTime = dateTime.addingTimeInterval(3600 * 24)
var varMax = Double.nan
var var4 = Double.nan
var var3 = Double.nan
var var2 = Double.nan
var var1 = Double.nan
var varMin = Double.nan
if i > 4 {
varMax = yValue + (Double(i) - 5) * 0.3
var4 = yValue + (Double(i) - 5) * 0.2
var3 = yValue + (Double(i) - 5) * 0.1
var2 = yValue - (Double(i) - 5) * 0.1
var1 = yValue - (Double(i) - 5) * 0.2
varMin = yValue - (Double(i) - 5) * 0.3
}
handler(VarPoint(date: dateTime, actual: yValue, varMax: varMax, var1: var1, var2: var2, var3: var3, var4: var4, varMin: varMin))
}
}
}