SciChart® the market leader in Fast WPF Charts, WPF 3D Charts, iOS Chart, Android Chart and JavaScript Chart Components
Please note! These examples are new to SciChart iOS v4 release! SciChart’s OpenGL ES and Metal iOS and Metal macOS Chart library ships with hundred of Objective-C and Swift iOS&macOS Chart Examples which you can browse, play with and view the source-code. All of this is possible with the new and improved SciChart iOS Examples Suite and demo application for Mac, which ships as part of the SciChart SDK.
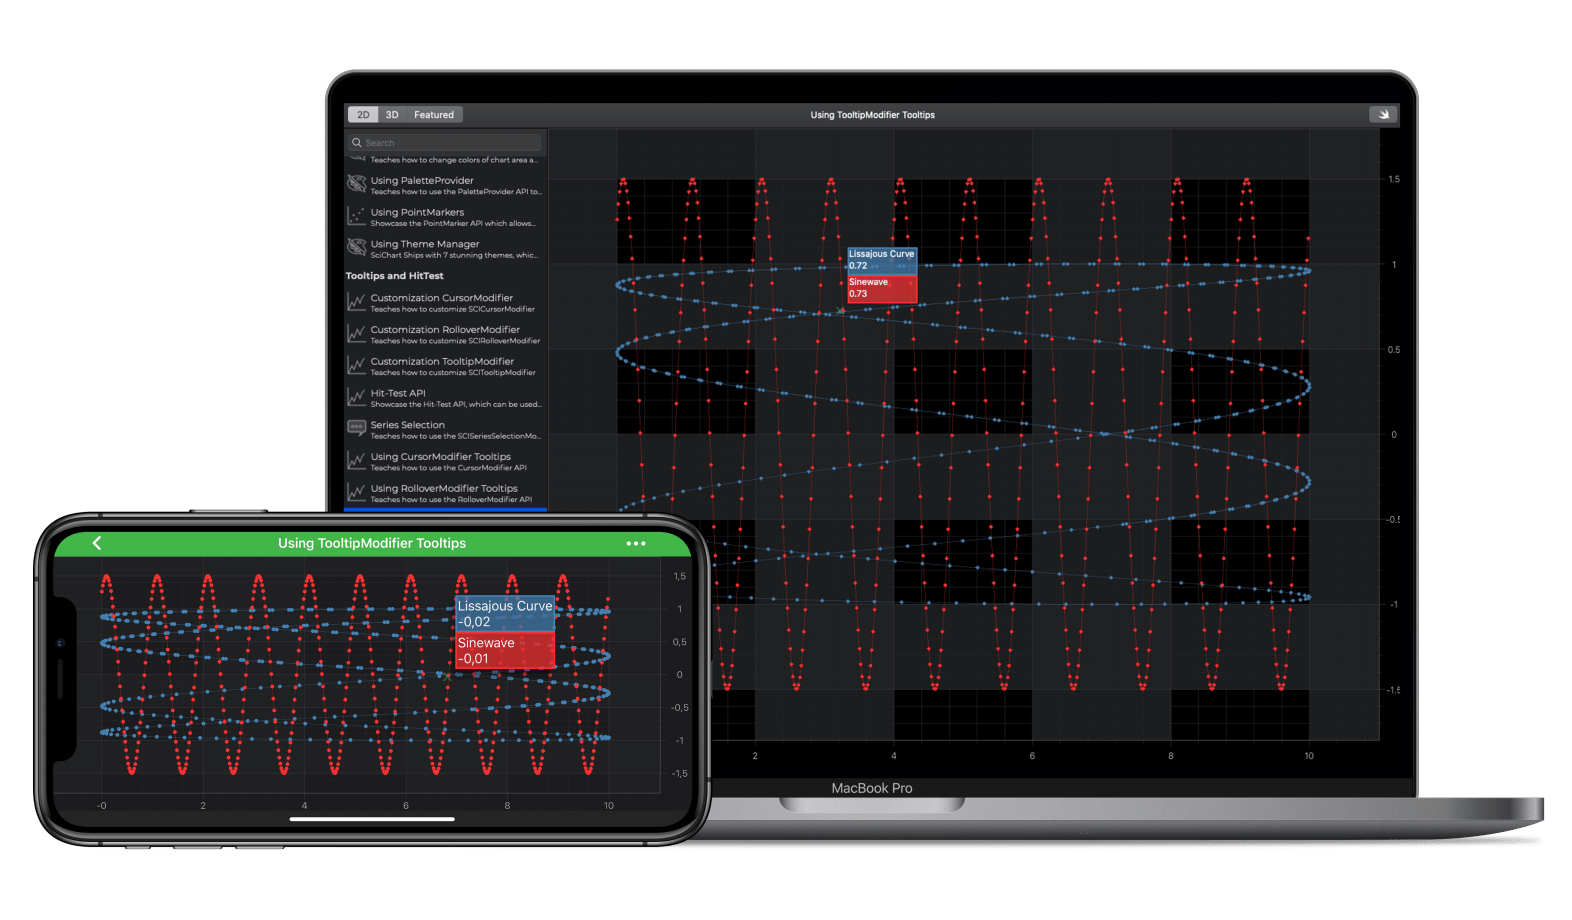
If you wish to add tooltips to your iOS Charts, then the SciChart TooltipModifier can add this behavior onto our iOS Chart Control. The SCITooltipModifier is specifically suited for scatter X-Y data, although it may be used for any type of data in SciChart where you want a tooltip to appear on tap-over of a data-point on the chart.
NOTE: See documentation about the SCITooltipModifier Type here.
The Swift and Objective-C source code for the iOS and macOS Chart with Tooltips example is included below (Scroll down!).
Did you know that we have the source code for all our example available for free on Github?
Clone the SciChart.iOS.Examples from Github.
Also the SciChart iOS and Scichart macOS Trials contain the full source for the examples (link below).
//******************************************************************************
// SCICHART® Copyright SciChart Ltd. 2011-2019. All rights reserved.
//
// Web: http://www.scichart.com
// Support: support@scichart.com
// Sales: sales@scichart.com
//
// TooltipCustomizationChartView.m is part of the SCICHART® Examples. Permission is hereby granted
// to modify, create derivative works, distribute and publish any part of this source
// code whether for commercial, private or personal use.
//
// The SCICHART® examples are distributed in the hope that they will be useful, but
// without any warranty. It is provided "AS IS" without warranty of any kind, either
// expressed or implied.
//******************************************************************************
#import "TooltipCustomizationChartView.h"
#import "SCDDataManager.h"
#import "SCDRandomWalkGenerator.h"
#import <SciChart/SCISeriesTooltipBase+Protected.h>
#import <SciChart/SCISeriesInfoProviderBase+Protected.h>
#pragma mark - Cutsom Tooltips
@interface FirstCustomTooltipXySeriesTooltip : SCIXySeriesTooltip
@end
@implementation FirstCustomTooltipXySeriesTooltip
- (void)internalUpdateWithSeriesInfo:(SCIXySeriesInfo *)seriesInfo {
NSString *string = NSString.Empty;
string = [string stringByAppendingFormat:@"X: %@\n", seriesInfo.formattedXValue.rawString];
string = [string stringByAppendingFormat:@"Y: %@\n", seriesInfo.formattedYValue.rawString];
if (seriesInfo.seriesName != nil) {
string = [string stringByAppendingFormat:@"%@\n", seriesInfo.seriesName];
}
string = [string stringByAppendingString:@"Tooltip Modifier"];
self.text = string;
[self setTooltipBackground:0xFFE2460C];
[self setTooltipStroke:0xFFFF4500];
[self setTooltipTextColor:0xFFFFFFFF];
}
@end
@interface SecondCustomTooltipXySeriesTooltip : SCIXySeriesTooltip
@end
@implementation SecondCustomTooltipXySeriesTooltip
- (void)internalUpdateWithSeriesInfo:(SCIXySeriesInfo *)seriesInfo {
NSString *string = @"Tooltip Modifier\n";
if (seriesInfo.seriesName != nil) {
string = [string stringByAppendingFormat:@"%@\n", seriesInfo.seriesName];
}
string = [string stringByAppendingFormat:@"X: %@ ", seriesInfo.formattedXValue.rawString];
string = [string stringByAppendingFormat:@"Y: %@", seriesInfo.formattedYValue.rawString];
self.text = string;
[self setTooltipBackground:0xFF6495ED];
[self setTooltipStroke:0xFF4D81DD];
[self setTooltipTextColor:0xFFFFFFFF];
}
@end
#pragma mark - Cutsom Info Providers
@interface FirstCustomTooltipSeriesInfoProvider : SCIDefaultXySeriesInfoProvider
@end
@implementation FirstCustomTooltipSeriesInfoProvider
- (id<ISCISeriesTooltip>)getSeriesTooltipInternalWithSeriesInfo:(SCIXySeriesInfo *)seriesInfo modifierType:(Class)modifierType {
if (modifierType == SCITooltipModifier.class) {
return [[FirstCustomTooltipXySeriesTooltip alloc] initWithSeriesInfo:seriesInfo];
} else {
return [super getSeriesTooltipInternalWithSeriesInfo:seriesInfo modifierType:modifierType];
}
}
@end
@interface SecondCustomTooltipSeriesInfoProvider : SCIDefaultXySeriesInfoProvider
@end
@implementation SecondCustomTooltipSeriesInfoProvider
- (id<ISCISeriesTooltip>)getSeriesTooltipInternalWithSeriesInfo:(SCIXySeriesInfo *)seriesInfo modifierType:(Class)modifierType {
if (modifierType == SCITooltipModifier.class) {
return [[SecondCustomTooltipXySeriesTooltip alloc] initWithSeriesInfo:seriesInfo];
} else {
return [super getSeriesTooltipInternalWithSeriesInfo:seriesInfo modifierType:modifierType];
}
}
@end
static int const PointsCount = 200;
#pragma mark - Chart Initialization
@implementation TooltipCustomizationChartView
- (Class)associatedType { return SCIChartSurface.class; }
- (void)initExample {
id<ISCIAxis> xAxis = [SCINumericAxis new];
id<ISCIAxis> yAxis = [SCINumericAxis new];
SCDRandomWalkGenerator *randomWalkGenerator = [SCDRandomWalkGenerator new];
SCDDoubleSeries *data1 = [randomWalkGenerator getRandomWalkSeries:PointsCount];
[randomWalkGenerator reset];
SCDDoubleSeries *data2 = [randomWalkGenerator getRandomWalkSeries:PointsCount];
SCIXyDataSeries *ds1 = [[SCIXyDataSeries alloc] initWithXType:SCIDataType_Double yType:SCIDataType_Double];
ds1.seriesName = @"Series #1";
SCIXyDataSeries *ds2 = [[SCIXyDataSeries alloc] initWithXType:SCIDataType_Double yType:SCIDataType_Double];
ds2.seriesName = @"Series #2";
[ds1 appendValuesX:data1.xValues y:data1.yValues];
[ds2 appendValuesX:data2.xValues y:data2.yValues];
SCIFastLineRenderableSeries *line1 = [SCIFastLineRenderableSeries new];
line1.dataSeries = ds1;
line1.strokeStyle = [[SCISolidPenStyle alloc] initWithColorCode:0xFF6495ED thickness:2];
line1.seriesInfoProvider = [FirstCustomTooltipSeriesInfoProvider new];
SCIFastLineRenderableSeries *line2 = [SCIFastLineRenderableSeries new];
line2.dataSeries = ds2;
line2.strokeStyle = [[SCISolidPenStyle alloc] initWithColorCode:0xFFE2460C thickness:2];
line2.seriesInfoProvider = [SecondCustomTooltipSeriesInfoProvider new];
[SCIUpdateSuspender usingWithSuspendable:self.surface withBlock:^{
[self.surface.xAxes add:xAxis];
[self.surface.yAxes add:yAxis];
[self.surface.renderableSeries add:line1];
[self.surface.renderableSeries add:line2];
[self.surface.chartModifiers add:[SCITooltipModifier new]];
[SCIAnimations sweepSeries:line1 duration:3.0 andEasingFunction:[SCICubicEase new]];
[SCIAnimations sweepSeries:line2 duration:3.0 andEasingFunction:[SCICubicEase new]];
}];
}
@end
//******************************************************************************
// SCICHART® Copyright SciChart Ltd. 2011-2019. All rights reserved.
//
// Web: http://www.scichart.com
// Support: support@scichart.com
// Sales: sales@scichart.com
//
// TooltipCustomizationChartView.swift is part of the SCICHART® Examples. Permission is hereby granted
// to modify, create derivative works, distribute and publish any part of this source
// code whether for commercial, private or personal use.
//
// The SCICHART® examples are distributed in the hope that they will be useful, but
// without any warranty. It is provided "AS IS" without warranty of any kind, either
// expressed or implied.
//******************************************************************************
import SciChart.Protected.SCISeriesTooltipBase
import SciChart.Protected.SCISeriesInfoProviderBase
class TooltipCustomizationChartView: SCDSingleChartViewController<SCIChartSurface> {
override var associatedType: AnyClass { return SCIChartSurface.self }
private class FirstCustomSeriesInfoProvider: SCIDefaultXySeriesInfoProvider {
class FirstCustomXySeriesTooltip: SCIXySeriesTooltip {
override func internalUpdate(with seriesInfo: SCIXySeriesInfo!) {
var string = NSString.empty;
string += "X: \(seriesInfo.formattedXValue.rawString!)\n"
string += "Y: \(seriesInfo.formattedYValue.rawString!)\n"
if let seriesName = seriesInfo.seriesName {
string += "\(seriesName)\n"
}
string += "Tooltip Modifier"
self.text = string;
setTooltipBackground(0xFFE2460C);
setTooltipStroke(0xFFFF4500);
setTooltipTextColor(0xFFFFFFFF);
}
}
override func getSeriesTooltipInternal(seriesInfo: SCIXySeriesInfo!, modifierType: AnyClass!) -> ISCISeriesTooltip! {
if (modifierType == SCITooltipModifier.self) {
return FirstCustomXySeriesTooltip(seriesInfo: seriesInfo)
} else {
return super.getSeriesTooltipInternal(seriesInfo: seriesInfo, modifierType: modifierType)
}
}
}
private class SecondCustomSeriesInfoProvider: SCIDefaultXySeriesInfoProvider {
class SecondCustomXySeriesTooltip: SCIXySeriesTooltip {
override func internalUpdate(with seriesInfo: SCIXySeriesInfo!) {
var string = "Tooltip Modifier\n";
if let seriesName = seriesInfo.seriesName {
string += "\(seriesName)\n"
}
string += "X: \(seriesInfo.formattedXValue.rawString!) Y: \(seriesInfo.formattedYValue.rawString!)"
self.text = string;
setTooltipBackground(0xFF6495ED);
setTooltipStroke(0xFF4D81DD);
setTooltipTextColor(0xFFFFFFFF);
}
}
override func getSeriesTooltipInternal(seriesInfo: SCIXySeriesInfo!, modifierType: AnyClass!) -> ISCISeriesTooltip! {
if (modifierType == SCITooltipModifier.self) {
return SecondCustomXySeriesTooltip(seriesInfo: seriesInfo)
} else {
return super.getSeriesTooltipInternal(seriesInfo: seriesInfo, modifierType: modifierType)
}
}
}
private let PointsCount = 200
override func initExample() {
let xAxis = SCINumericAxis()
let yAxis = SCINumericAxis()
let randomWalkGenerator = SCDRandomWalkGenerator()
let data1 = randomWalkGenerator.getRandomWalkSeries(PointsCount)
randomWalkGenerator.reset()
let data2 = randomWalkGenerator.getRandomWalkSeries(PointsCount)
let ds1 = SCIXyDataSeries(xType: .double, yType: .double)
ds1.seriesName = "Series #1"
let ds2 = SCIXyDataSeries(xType: .double, yType: .double)
ds2.seriesName = "Series #2"
ds1.append(x: data1.xValues, y: data1.yValues)
ds2.append(x: data2.xValues, y: data2.yValues)
let line1 = SCIFastLineRenderableSeries()
line1.dataSeries = ds1
line1.strokeStyle = SCISolidPenStyle(colorCode: 0xFF6495ED, thickness: 2)
line1.seriesInfoProvider = FirstCustomSeriesInfoProvider()
let line2 = SCIFastLineRenderableSeries()
line2.dataSeries = ds2
line2.strokeStyle = SCISolidPenStyle(colorCode: 0xFFE2460C, thickness: 2)
line2.seriesInfoProvider = SecondCustomSeriesInfoProvider()
SCIUpdateSuspender.usingWith(surface) {
self.surface.xAxes.add(xAxis)
self.surface.yAxes.add(yAxis)
self.surface.renderableSeries.add(items: line1, line2)
self.surface.chartModifiers.add(SCITooltipModifier())
SCIAnimations.sweep(line1, duration: 3.0, easingFunction: SCICubicEase())
SCIAnimations.sweep(line2, duration: 3.0, easingFunction: SCICubicEase())
}
}
}