Hello,
I am wanting to “force” an axis label on a specific value. For example, right now in my datetime graph it always shows a “5PM” time on the axis regardless of the data. Instead, I would like to “anchor” the axis ticks on a different time value, like local Noon. We were able to do this in our previous charting solution, but I have not yet figured out how to do it with SciChart.
Thank you.
- C Bolton asked 4 years ago
- last active 4 years ago
Hello,
I’ve been looking for the documentation of how to customize the look of the chart. I have a black/dark gray checker pattern that seems to be the default. I would like to:
1. Change the background to white, no checkerboard pattern
here is the documentation for chart background but it does not show me how to change it to white. https://www.scichart.com/documentation/ios/v2.x/webframe.html#The%20SciChartSurface%20Type.html
I have found through experimentation the I can call
surface.backgroundColor
But that just changes the axis background color
2. Make the text larger on the axis.
here is the documentation for the axis https://www.scichart.com/documentation/ios/v2.x/webframe.html#Adding%20an%20Axis%20to%20a%20SciChartSurface.html
I see these lines that were provided but they won’t compile because Xcode doesn’t know what defaultFontSize is and there are no other references to it and I still don’t see a way to set the size.
textFormat.fontName = SCSFontsName.defaultFontName
textFormat.fontSize = SCSFontSizes.defaultFontSize
I think it would be helpful to create a walkthrough for iOS that shows how to customize the background and axis. I’ve looked through the samples provided but the files are huge and I get lost trying to figure it out.
Thanks,
Warren
- Warren Hansen asked 7 years ago
- last active 2 years ago
Hi I have an application where I would like to get the color information of the the pixel clicked on the uniformheatmap.
I am of course able to get the value, x, y using the hitTestProvider.hitTest but it does not contain any additional information regarding the color of the clicked pixel
Any help of direction is appreciated.
Pramod
- pramod butte asked 1 year ago
- last active 12 months ago
I’m trying to set the visible range property of a CategoryDateTimeAxis through MVVM. I’m following the general instructions detailed here for converting between pixel & data coordinates on the axis:
https://www.scichart.com/questions/question/categorydatetimeaxis-in-mvvm#sabai-inline-nav
I have the following code in my viewmodel:
XAxis.OnBeginRenderPass();
var calc = XAxis.GetCurrentCoordinateCalculator();
var coordCalc = calc as ICategoryCoordinateCalculator;
XAxis is a CategoryDateTimeAxis injected from the view. I call OnBeginRenderpass as I saw in another forum post that this will ensure that the CoordinateCalculator is initialized.
calc shows in the debugger as:
- calc {A.} Abt.Controls.SciChart.Numerics.CoordinateCalculators.ICoordinateCalculator {A.}
The coordCalc variable ends up assigned to NULL, as the ICoordinateCalculator< double > cannot be cast to the interface.
How do I accomplish the above?
Thanks, Asher
- ashernew asked 8 years ago
- last active 8 years ago
Hello, I am using SciChartJS and have a new requirement from our users as follows that I need help with the implementation. Any pointers from anyone would be a great help.
**Requirements: **
- Assume that x-axis is Time and y-axis is prices.
- There are multiple series in the chart (e.g., Bid Price, Ask Price)
- Allow user to select a time on xAxis using
CTRL + CLICK - When the user selects the time, show the rollover line and the tooltip for all series at the selected time
- This rollover line and tooltip should remain visible until the user selects a new time on the x-axis at which point the rollover tooltip should display the tooltip for the new point.
I started inheriting the RolloverModifier but couldn’t find an appropriate method to show the tooltip.
So, I started implementing the above feature using CustomModifierBase2d and adding a VerticalLineAnnotation for the rollover line. But again, struggling with the tooltip.
If someone could help me out or give me pointers, that would be highly appreciated.
Best Regards,
Sachin Patel.
- sachin patel asked 9 months ago
- last active 8 months ago
Does scichart support smith charts? If not, it is possible to build a smith chart based on polar chart?
Thanks!
Manuel
- Jose Mora Almerich asked 8 years ago
- last active 3 years ago
I have a chart which includes a RolloverModifier with Tooltip shown on MouseHover. This works very well, and RolloverModifer includes a nice HoverDelay property to determine how quickly the tooltip displays. Is there a way to get an event when the tooltip is actually displayed (or about to be displayed)? The normal FrameworkElement.TooltipOpening event does not fire in this situation.
Bill
- William Lear asked 7 years ago
- last active 7 years ago
I am still experiencing the effects of this defect despite using v2.5.0.2598 of the Android libraries. Can someone please explain to me how to circumvent this behavior? It seems silly to require a base series that is ultimately going to be replaced by real-time updates.
Cheers
- TJ Cook asked 5 years ago
- last active 5 years ago
I’ve been trying to implement the scichart js blazor wrapper in a serverside application. The chart starts to load, but gives the following error:
Failed to load resource: the server responded with a status of 404 () :5001/scichart2d.data:1
it looks like scichart2d.data is in the wrong place, but as far as I can tell it’s where it should be (in wwwroot).
is there something special I need to do in sever side? I can get it working fine in webAssembly Blazor
- Michael Hollas asked 3 years ago
- last active 2 years ago
Hello,
I am trying to evaluate Scichart for purchase. I am using live data (17 Channels, many samples per second) to draw FastLineRenderableSeries (0-100% on the y axis, time on the x axis). I have everything working satisfactorily using the MVVM pattern. I have tried the HighQualityRenderSurface and Direct3D10RenderSurface.
Are these renderers actually working or am I still using the software renderer?
I need to draw a translucent rectangle on the chart to indicate a “Good” range of values of y values (say 40-50%).
If I use annotations to draw a rectangle, everything slows down and it is unusable. If I use immediate mode drawing and the HighQualityRendererSurface it is kind of OK. If i use immediate mode drawing and the Direct3D10RenderSurface the rectangle and the series lines alternately flash slowly and it is unusable.
How can I draw a rectangle on the screen using live data and get good performance? Do I need the license for this to work well?
Thanks.
- Benjamin Kress asked 9 years ago
- last active 9 years ago
Hello,
I want to draw labels for line series using point markers. How to get index of data series for point marker?
public class AnnotatedPointMarker : BasePointMarker
{
   public override void Draw(SciChart.Drawing.Common.IRenderContext2D context, IEnumerable<Point> centers)
   {
       base.Draw(context, centers);
       XyDataSeries<double, double> dataSeries = RenderableSeries.DataSeries as XyDataSeries<double, double>;
       foreach (var center in centers)
       {
           int index =  ???//how to get index of data series? smth like GetIndexByCenter(center)
           double yValue = _dataSeries.YValues[index];

           _textBlock.Text = yValue .ToString();
            _textBlock.MeasureArrange();
           ...
       }
   }
 }
- Ivan Voyager asked 8 years ago
- last active 8 years ago
Hi,
When using splinerenderable series, there visual issues (as if the data points are unsorted) with the spline line at certain zoom levels.
If you zoom in past a certain point, the spline line corrects itself, showing that the data points are sorted in order.
See the attached screenshot and project replicating the issue.
This issue may be related to other issues currently active:
- Eyram Dornor asked 2 years ago
- last active 2 years ago
Hi,
In the interface IRenderableSeriesViewModel an IncludeLegend property would be helpful (analogous to LegendModifier.IncludeSeriesProperty). Otherwise you have to override the LegendModifier.GetSeriesInfo method and implement the logic yourself.
regard
Tobias
- Tobias asked 11 months ago
- last active 11 months ago
As the topic asks: is this able to run in linux? or has anybody gotten this to run under Linux or android?
- rippie asked 12 years ago
- last active 9 months ago
Hi,
Currently when we scroll the mouse pointer the zoom level is increasing/decreasing and when we click and drag the pan the chart. I want is when we scroll the chart should change the visible range (Pan chart), and clicking and selecting the area need to zoom like RubberBandXyZoomModifier. But I need to zoom only the X axis. Y axis should be the same as before zoom. Is this possible with SCI chart??
- Arun Surendran asked 3 years ago
- last active 3 years ago
Hello again!
I’ve got a problem with LineAnnotation display on the axis: it is blurry (image 1). I have tried to use UseLayoutRounding/SnapsToDevicePixels properties from this post https://www.scichart.com/questions/question/2-1-1-lines-are-sometimes-blurry-when-added-to-modifier-surface, but it doesn’t work. Any ideas to make this LineAnnotation look like other annotation on surface?
Thanks in advance!
- Egor asked 9 years ago
- last active 5 years ago
Hi, I’m using the trial version for Xamarin. We wish to develop a mobile app which will have charting capabilities similar to our existing desktop application. I’ll provide an example of what we do (3 screenshots attached), can you please tell me if SciChart can do the same?
In #1 you see an FFT chart.
We select a data point by touching the screen.
In #2 you see a vertical blue line over the selected data point, plus 5 equidistant markers to the right.
We click a button to move right.
In #3 you see the 5 markers have moved to the right, the distance between them has increased slightly.
Is this something that SciChart can handle? Easily? With difficulty?
We want to write all the code in the common Xamarin project only (i.e. no iOS or Android specific code).
Thanks very much,
Wayne
- Wayne Murphy asked 4 years ago
- last active 4 years ago
Hi,
I have used WPF Chart Vertically Stacked YAxis example:
WPF Chart Vertically Stacked YAxis | Fast, Native, Charts for WPF (scichart.com)
and WPF Chart Multiple YAxis example:
WPF Chart Multiple YAxis | Fast, Native, Charts for WPF (scichart.com)
I have managed to achieve both individually but now essentially I would like to combine them.
I have been trying to alter the Right Axes Panel Template to allow this but it seems to only allow one or the other.
My main difference from the examples is that I have a collection of Yaxes of NumericAxisViewModel type in my viewmodel that is decided by the user at runtime before creating the chart and so is not defined in the xaml and bound with the YAxes property on the surface using AxesBinding.
I want to be able to vertically stack some of the Yaxes and have the rest stack horizontally side by side on the same axis alignment side, in my case the right side.
Is this something that is possible? If so how do I achieve this?
Let me know if you need any more info.
Cheers,
Grahame
- Grahame Hall asked 2 years ago
- last active 2 years ago
Hello,
we are building an application where Charts are created/placed by the user in a form of editor.
We observed that the creation of the first Chart takes between 1 to 3 seconds (depending on the system) but the creation of subsequent Charts takes virtually no time (as it should be).
We assume that the creation of the first Chart involves some kind of time consuming initialization that is later used in the creation of subsequent Charts.
So we have researched if there is a way to do this initialization at the start of our application, so the user is not inconvenienced by a three second waiting time while placing the first Chart.
We discovered the “LoadLibrariesAndLicenseAsync”-function. However, it looks like it has no measurable effect.
Maybe we are using it wrong?
Here is an example code to illustrate the problem in a condensed manner:
Two charts are created and each time the time it takes to create them is measured.
The first creation takes about 1600 milliseconds, the second one only 2.
How can we make both creations only take a few milliseconds?
Thank you.
        // SciChartSurface.SetRuntimeLicenseKey("our key");

         await SciChart.Charting.Visuals.SciChart2DInitializer.LoadLibrariesAndLicenseAsync(
           "our key",
            null); //...does not seem to work

        Stopwatch sw = new Stopwatch();
        sw.Restart();//start stopwatch

        //creating the first Scichart with test data:

        SciChartSurface sciChartSurface = new SciChartSurface();

        XyDataSeries<double, double> xyDataSeries = new XyDataSeries<double, double>();
        xyDataSeries.AcceptsUnsortedData = true;
        FastLineRenderableSeries fastLineRenderableSeries = new FastLineRenderableSeries();
        fastLineRenderableSeries.DataSeries = xyDataSeries;
        sciChartSurface.RenderableSeries.Add(fastLineRenderableSeries);

        NumericAxis m_xAxis = new NumericAxis();
        NumericAxis m_yAxis = new NumericAxis();
        m_yAxis.AutoRange = AutoRange.Always;
        sciChartSurface.XAxis = m_xAxis;
        sciChartSurface.YAxis = m_yAxis;

        using (xyDataSeries.SuspendUpdates())
        {
            for (int i = 0; i < 100; i++)
                xyDataSeries.Append(i, Math.Sin(i));
        }

        Screen.Children.Add(sciChartSurface);//add first Scichart to grid
        sciChartSurface.Margin = new Thickness(0, 0, 500, 0);

        MessageBox.Show("time: "+sw.ElapsedMilliseconds); //////////  1610 Mlliseconds
        sw.Restart();//restart stopwatch

        //creating the second Scichart with test data:

        SciChartSurface sciChartSurface2 = new SciChartSurface();

        XyDataSeries<double, double> xyDataSeries2 = new XyDataSeries<double, double>();
        xyDataSeries2.AcceptsUnsortedData = true;
        FastLineRenderableSeries fastLineRenderableSeries2 = new FastLineRenderableSeries();
        fastLineRenderableSeries2.DataSeries = xyDataSeries2;
        sciChartSurface2.RenderableSeries.Add(fastLineRenderableSeries2);

        NumericAxis m_xAxis2 = new NumericAxis();
        NumericAxis m_yAxis2 = new NumericAxis();
        m_yAxis2.AutoRange = AutoRange.Always;
        sciChartSurface2.XAxis = m_xAxis2;
        sciChartSurface2.YAxis = m_yAxis2;

        using (xyDataSeries2.SuspendUpdates())
        {
            for (int i = 0; i < 100; i++)
                xyDataSeries2.Append(i, Math.Sin(i));
        }

        Screen.Children.Add(sciChartSurface2);//add second Scichart to grid
        sciChartSurface2.Margin = new Thickness(500, 0, 0, 0);

        MessageBox.Show("time: "+sw.ElapsedMilliseconds); //////////////////////////// 2 Mlliseconds
- Marc Vahldieck asked 1 year ago
- last active 1 year ago
Hello,
When annotations and the rollover modifiers are displayed on the very left side of a chart they align with the center of the candlesticks on the chart. However, as they get displayed toward the right side of the chart they get more and more offset to the right side of the candlestick.
Can anyone point me in the right direction to figure out how to fix this issue seemingly with my xAxis?
See attached screenshots,
- Leland asked 11 months ago
- last active 11 months ago
Imagine I have a chart with a RolloverModifier, such that I see the point marker, and also a CursorModifier so I see the axis labels with the exact value I’m hovering.
This chart has the axis title hidden, and also the labels hidden, so I can really only see them trough the CursorModifier axis labels.
Since the axis title and labels are hidden, the axis labels spawn inside the chart, and the point marker from the RolloverModifier may be drawn on top of the labels.
I’d like to properly control drawing order here, so my axis labels get prioritised.
Is there a way to do so?
Codepen example: https://codepen.io/jrfv/full/VwqVBdo
- João Velasques asked 7 months ago
- last active 4 months ago
Is there any way to change the view of a 3d chart so the Y and Z axis are switched?
- Dan Gabbard asked 8 years ago
- last active 1 year ago
Hi SciCharters,
We have a requirement to show a grid of data as follows:
time (days) on the x-axis
people on the y-axis.
For each “cell” in the grid (i.e. for each day for each person) we want to represent 3 different pieces of data as follows:
some text
1/2 the cell in one colour
the other 1/2 of the cell in a different colour
All cells need to be the same size and it should look a bit like a spreadsheet rather than a chart. I will try and attach a mockup of what it needs to look like shortly.
We are having performance issues using pure Wpf with any amount of data and are wondering if this is a problem scichart can solve for us. It doesn’t look like any of the out of the box charts can give us what we need, so I guess we have to consider using something like a custom chart or annotations?
I’d be grateful for any advice you can give on the best way to approach this task with scichart??
Many thanks
Bill
- Bill Dines asked 7 years ago
- last active 7 years ago
Hi,
we have a graph which it’s x axis visible range changed when the graph draw until the max (as a travel graph)
we also have logic for each serie a minimum\maximum range, outside of this range the color should be red
so, we use the ExtremePointMarkerPaletteProvider and set for each value the suttible color in the colors list.
our problem is when the graph visible range changed – the serie points is draw correctly but it’s color is not match.
the colors are stay the same as they was before the range changed.
we looked at the colors list and YValues list – the value and the color on each index was match.
the problem is only in the view.
also, after some time it’s fixed, we don’t know what cause it to be fixed…
Thanks
- Natali Cohen asked 5 years ago
- last active 5 years ago
I’ve verified it steps thru the code as I would expect; however, it only ever zooms in further. The intent of this modifier is to only zoom out when the mouse is dragged up and left. I.e.
Mouse down
Drag up/left
Mouse up
    class ZoomOutModifier : ZoomExtentsModifier
{
    double _x;
    double _y;
    MouseButtons _button = MouseButtons.None;

    public override void OnModifierDoubleClick(ModifierMouseArgs e)
    {
        // do not zoom to extents on a double click
        e.Handled = true;
    }

    public override void OnModifierMouseDown(ModifierMouseArgs e)
    {
        base.OnModifierMouseDown(e);

        // where was the mouse button on the chart surface?
        _x = e.MousePoint.X;
        _y = e.MousePoint.Y;

        // which button was clicked?  we're only going to zoom
        // out on a left button click.
        _button = e.MouseButtons;
    }

    public override void OnModifierMouseUp(ModifierMouseArgs e)
    {
        // are we left and up from where the mouse was clicked?
        if (MouseButtons.Left == _button &&
            e.MousePoint.X < _x &&
            e.MousePoint.Y < _y)
        {
            using (var updater = ParentSurface.SuspendUpdates())
            {
                ParentSurface.ZoomExtents();
                ParentSurface.ResumeUpdates(updater);
            }

            e.Handled = true;
        }
        else
            base.OnModifierMouseUp(e);
    }
}
- Chris Kirkman asked 4 years ago
- last active 4 years ago
I’m using a number of modifiers to allow the user to pan and zoom, including a ZoomExtentsModifier so the user can double-click to “reset” the chart back to its initial layout. However it seems to ignore the VisibleRanges I’ve got on the axes. How can I get it to honour these?
Here is an example of one of my axes, just in case one of its attributes is preventing the modifier from working properly:-
<SciChart:NumericAxis AxisAlignment="Left" AutoRange="False" DrawMajorTicks="False" DrawMinorTicks="False" VisibleRange="{Binding YAxisRange, Mode=TwoWay}" DrawMinorGridLines="False" DrawLabels="True" AxisTitle="Foo"/>
(I seem to remember being told a while ago that the VisibleRange binding must be TwoWay otherwise it won’t work. Is that correct?)
Thanks in advance
Andy
- andyste1 asked 11 years ago
- last active 4 years ago
I am evaluating SciChart for an upcoming project. I like what I see for WPF and a standard console.
My problem is that SciChart for the web only shows projects for Silver Light.
Silver Light is dead. Win RT is gasping its last breath. Everthing seems to be moving towards HTML5 / JS.
I need to be able to use the charts in a web browser as well as a console.
Is there new versions of SciChart coming out that addresses this issue.
Regards
Bill Johnson
- Bill.Johnson asked 8 years ago
- last active 1 year ago
I want to display a line series chart with 3500 series. But the application hangs 20-30 seconds because SciChart is doing something in the UI thread. I’ve read your article “https://www.scichart.com/performance-improvements-scichart-wpf-v5-1/” and set the extension property s:PerformanceHelper.EnableExtremeDrawingManager=”True” and s:PerformanceHelper.EnableExtremeResamplers=”True”. But there is no improvement!
You can reproduce this issue using your example “WaterfallChartDemo” and increase the series count from 50 to 3500.
Why s:PerformanceHelper.EnableExtremeDrawingManager=”True” and s:PerformanceHelper.EnableExtremeResamplers=”True” has no effect?
- Tobias asked 5 years ago
- last active 5 years ago
Hello,
I have a line series with 500k to 8 million data points and I use the StrokePaletteProvider to highlight certain peaks in different colors. But the colors only appear right at a certain zoom level, without zooming in it is a mixture of my default line color and the chosen StrokePaletteProvider color. Is there anything I can do about this?
- Roland D asked 5 years ago
- last active 5 years ago
Hello,
I need to display realtime chart with 20 series of data. My data is arriving at 500Hz. When I’m displaying this data, I find that after a while SciChart hangs with what appears to be a deadlock.
I’ve read as much as I can find about realtime graphing with SciChart and I started with tutorial 4 – Adding Realtime Updates. This article (https://www.scichart.com/questions/wpf/is-xydataseries-safe-to-being-changed-in-a-separate-thread) suggests that SciChart is thread safe so I tried using a second thread to feed data into a graph. My only change was to move from the main thread timer in the example to a GCD timer running at 500Hz. With this, I’m easily able to reproduce the deadlock in around 1.5 seconds.
Here is the main thread which is attempting to render:
Thread 1 Queue : com.apple.main-thread (serial)
#0  0x0000000192bc8c20 in __psynch_rw_rdlock ()
#1  0x0000000192ae4864 in _pthread_rwlock_lock_wait ()
#2  0x0000000192ae47fc in _pthread_rwlock_lock_slow$VARIANT$mp ()
#3  0x0000000104a93828 in -[SCIRenderableSeriesLock initWithRenderableSeries:] ()
#4  0x0000000104ab742c in -[SCIRenderSurfaceRenderer p_SCI_updateCoreData:renderPassState:viewportSize:] ()
#5  0x0000000104ab6f4c in -[SCIRenderSurfaceRenderer p_SCI_renderLoop:assetManager:renderPassState:] ()
#6  0x0000000104ab6dc4 in -[SCIRenderSurfaceRenderer onDrawWithContext:andAssetManager:] ()
#7  0x00000001049c50c0 in -[SCIRenderSurfaceDrawable2D drawFrameIn:withDrawableSize:] ()
#8  0x0000000104ad4db8 in -[SCITwisterRendererBase drawFrameIn:withDrawableSize:] ()
#9  0x00000001049e56c8 in -[SCIMetalRenderer drawFrameIn:withDrawableSize:] ()
#10 0x0000000104a25b70 in -[SCIMetalRenderSurfaceBase draw] ()
#11 0x00000001999861ec in -[CALayer display] ()
#12 0x00000001999984d4 in CA::Layer::layout_and_display_if_needed(CA::Transaction*) ()
#13 0x00000001998e11d8 in CA::Context::commit_transaction(CA::Transaction*, double) ()
#14 0x000000019990ab78 in CA::Transaction::commit() ()
#15 0x000000019990b58c in CA::Transaction::observer_callback(__CFRunLoopObserver*, unsigned long, void*) ()
#16 0x0000000192d50fbc in __CFRUNLOOP_IS_CALLING_OUT_TO_AN_OBSERVER_CALLBACK_FUNCTION__ ()
#17 0x0000000192d4beb0 in __CFRunLoopDoObservers ()
#18 0x0000000192d4c32c in __CFRunLoopRun ()
#19 0x0000000192d4bc38 in CFRunLoopRunSpecific ()
#20 0x000000019d39a38c in GSEventRunModal ()
#21 0x0000000196e7c444 in UIApplicationMain ()
#22 0x00000001042cc478 in main at /Users/mall/Downloads/SciChart.iOS.Examples-SciChart_v3_Release/tutorials/tutorials-2d/Tutorial 04 - Adding Realtime Updates/Tutorial 04 - Adding Realtime Updates/AppDelegate.swift:5
#23 0x0000000192bd38f0 in start ()
and here is my worker thread adding data to a series:
Thread 11 Queue : com.apple.root.default-qos.overcommit (concurrent)
#0  0x0000000192bc8c20 in __psynch_rw_rdlock ()
#1  0x0000000192ae4864 in _pthread_rwlock_lock_wait ()
#2  0x0000000192ae47fc in _pthread_rwlock_lock_slow$VARIANT$mp ()
#3  0x0000000104ac1518 in -[SCIXDataSeries p_SCI_searchDataIndexOn:xMinAsDouble:xMaxAsDouble:downSearchMode:upSearchMode:] ()
#4  0x0000000104ac1368 in -[SCIXDataSeries getIndicesXRange:xMinAsDouble:xMaxAsDouble:isCategoryAxis:] ()
#5  0x0000000104ac1b34 in -[SCIXDataSeries getWindowYRangeWithXCoordCalc:getPositiveRange:] ()
#6  0x0000000104aceddc in -[SCIRenderableSeriesBase getYRange:positive:] ()
#7  0x00000001049b25ac in -[SCIRangeCalculationHelper2DBase getWindowedYRangeWithXCalculators:] ()
#8  0x0000000104a05f84 in -[SCIAxisBase getWindowedYRangeWithXRanges:] ()
#9  0x00000001049f4184 in -[SCIChartSurface p_SCI_zoomExtentsYWithCalculators:andDuration:] ()
#10 0x00000001049f3d14 in -[SCIChartSurface p_SCI_zoomExtentsWithDuration:] ()
#11 0x00000001042c79e8 in closure #1 in ViewController.handleTimer() at /Users/mall/Downloads/SciChart.iOS.Examples-SciChart_v3_Release/tutorials/tutorials-2d/Tutorial 04 - Adding Realtime Updates/Tutorial 04 - Adding Realtime Updates/ViewController.swift:84
#12 0x00000001042c7500 in thunk for @escaping @callee_guaranteed () -> () ()
#13 0x0000000104abdae0 in +[SCIUpdateSuspender usingWithSuspendable:withBlock:] ()
#14 0x00000001042c7824 in ViewController.handleTimer() at /Users/mall/Downloads/SciChart.iOS.Examples-SciChart_v3_Release/tutorials/tutorials-2d/Tutorial 04 - Adding Realtime Updates/Tutorial 04 - Adding Realtime Updates/ViewController.swift:79
#15 0x00000001042c9250 in partial apply ()
#16 0x00000001042cb1e4 in closure #1 in closure #1 in RepeatingTimer.timer.getter at /Users/mall/Downloads/SciChart.iOS.Examples-SciChart_v3_Release/tutorials/tutorials-2d/Tutorial 04 - Adding Realtime Updates/Tutorial 04 - Adding Realtime Updates/RepeatingTimer.swift:26
#17 0x00000001042c7500 in thunk for @escaping @callee_guaranteed () -> () ()
#18 0x0000000107093730 in _dispatch_client_callout ()
#19 0x0000000107096390 in _dispatch_continuation_pop ()
#20 0x00000001070a9614 in _dispatch_source_invoke ()
#21 0x00000001070a4d74 in _dispatch_root_queue_drain ()
#22 0x00000001070a5698 in _dispatch_worker_thread2 ()
#23 0x0000000192aeab38 in _pthread_wqthread ()
Here is my version of the ViewController class from Tutorial 4 with the GCD timer (note that it uses RepeatingTimer class found here: https://gist.github.com/danielgalasko/1da90276f23ea24cb3467c33d2c05768) – my changes are marked with the //MALL comment:
import UIKit
import SciChart

class ViewController: UIViewController {

    //MALL
    private var timer = RepeatingTimer(timeInterval: 1.0/500.0)

    private let pointsCount = 200
    private var count: Int = 0

    private let lineData = SCIDoubleValues()
    private lazy var lineDataSeries: SCIXyDataSeries = {
        let lineDataSeries = SCIXyDataSeries(xType: .int, yType: .double)
        lineDataSeries.seriesName = "Line Series"
        lineDataSeries.fifoCapacity = 300
        return lineDataSeries
    }()
    private let scatterData = SCIDoubleValues()
    private lazy var scatterDataSeries: SCIXyDataSeries = {
        let scatterDataSeries = SCIXyDataSeries(xType: .int, yType: .double)
        scatterDataSeries.seriesName = "Scatter Series"
        scatterDataSeries.fifoCapacity = 300
        return scatterDataSeries
    }()

    private var surface: SCIChartSurface {
        return view as! SCIChartSurface
    }

    override func loadView() {
        viewRespectsSystemMinimumLayoutMargins = false
        view = SCIChartSurface()
    }

    override func viewDidLoad() {
        super.viewDidLoad()

        let xValues = SCIIntegerValues()
        for i in 0 ..< pointsCount {
            xValues.add(Int32(i))
            lineData.add(sin(Double(i) * 0.1))
            scatterData.add(cos(Double(i) * 0.1))
            count += 1
        }
        lineDataSeries.append(x: xValues, y: lineData)
        scatterDataSeries.append(x: xValues, y: scatterData)

        let lineSeries = SCIFastLineRenderableSeries()
        lineSeries.dataSeries = lineDataSeries

        let pointMarker = SCIEllipsePointMarker()
        pointMarker.fillStyle = SCISolidBrushStyle(colorCode: 0xFF32CD32)
        pointMarker.size = CGSize(width: 10, height: 10)

        let scatterSeries = SCIXyScatterRenderableSeries()
        scatterSeries.dataSeries = scatterDataSeries
        scatterSeries.pointMarker = pointMarker

        let legendModifier = SCILegendModifier()
        legendModifier.orientation = .horizontal
        legendModifier.position = [.bottom, .centerHorizontal]
        legendModifier.margins = UIEdgeInsets(top: 0, left: 0, bottom: 10, right: 0)

        SCIUpdateSuspender.usingWith(self.surface) {
            self.surface.xAxes.add(items: SCINumericAxis())
            self.surface.yAxes.add(items: SCINumericAxis())
            self.surface.renderableSeries.add(items: lineSeries, scatterSeries)
            self.surface.chartModifiers.add(items: SCIPinchZoomModifier(), SCIZoomExtentsModifier())
            self.surface.chartModifiers.add(items: SCIRolloverModifier(), legendModifier)
        }

        //  MALL
        timer.eventHandler = handleTimer
        timer.resume()
    }

    //  MALL
    private func handleTimer() {
        let x = count
        SCIUpdateSuspender.usingWith(surface) {
            self.lineDataSeries.append(x: x, y: sin(Double(x) * 0.1))
            self.scatterDataSeries.append(x: x, y: cos(Double(x) * 0.1))

            // zoom series to fit viewport size into X-Axis direction
            self.surface.zoomExtents()
            self.count += 1
        }
    }
}
Thanks in advance for any help you can offer.
- Mark Alldritt asked 4 years ago
- last active 4 years ago
Memory leak in Fifo mode with Visual Xccelerator Engine enabled.
Two screenshots with Visual Xccelerator Engine enabled and disabled.
In a real application, the behavior is repeated. GS.Collect does not solve the problem.
It looks like the problem occurs on the integrated video card. AMD. When switching to a discrete video card. Memory is stable.
- p0934181372 p0934181372 asked 1 year ago
- last active 1 year ago
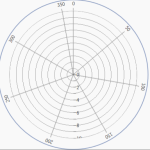
Request for enhancement to polar charts to allow for rotation of the X axis. I want to use this chart type with compass directions. Therefore a range of 0-360 with 0 at the top of the chart.
I was able to use the workaround for rotation here:
https://www.scichart.com/questions/question/polar-chart-x-axis-starting-point-and-direction
However as the OP on that question noted there are several drawbacks to simply rotating the entire chart surface.
Also I found that at run-time rotating the chart surface is inaccurate as in this example:
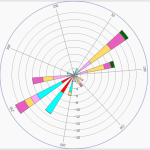
As you can see the 100 degree mark is not in the correct location. Directly right should be 90.
In the designer the chart axis looks as it should:
- wawr asked 9 years ago
- last active 5 years ago
Hi,
I’ve encountered an issue with the candlestick graph I’ve drawn that consists of a set of random X date time values – this causes the candlesticks have varying distances from one another.
Rendering the data from an initial set seems to be fine but as I run a NSTimer to add on more points, the body of the new candlesticks seem to be 0. (Note, the date time values are still random but have been made to be set after the last placed point)
In fact, the initial data points that I added see to be rendered ‘body-less’ if it’s within the same visible range as the newly added points. And if I pan along the newly added points, the bodies of some data points will appear at random visible ranges.
Is this a normal behaviour or should I take anything else into consideration?
Here are a couple of my configurations which I think may have affected anything:
1. My XAxis has set its visible range limit mode to ClipMode_Min
2. Candlestick series style data body width is set to be default.
3. I have a the following modifiers set up.
self.xDragModifier = [SCIXAxisDragModifier new];
self.xDragModifier.axisId = @"xAxis";
self.xDragModifier.dragMode = SCIAxisDragMode_Pan;
self.xDragModifier.clipModeX = SCIZoomPanClipMode_ClipAtMin;
[self.xDragModifier setModifierName:@"XAxis DragModifier"];

self.pinchZoomModifier = [[SCIPinchZoomModifier alloc] init];
[self.pinchZoomModifier setModifierName:@"PinchZoom Modifier"];
self.pinchZoomModifier.xyDirection = SCIXYDirection_XDirection;

self.zoomPanModifier = [SCIZoomPanModifier new];
self.zoomPanModifier.clipModeX = SCIZoomPanClipMode_ClipAtMin;
self.zoomPanModifier.xyDirection = SCIXYDirection_XDirection;
[self.zoomPanModifier setModifierName:@"ZoomPan Modifier"];

SCIModifierGroup * gm = [[SCIModifierGroup alloc] initWithChildModifiers:@[self.xDragModifier, self.pinchZoomModifier, self.zoomPanModifier]];
self.chartSurface.chartModifier = gm;
The points are drawing just fine, but the body of the candlestick is not appearing as expected.
Thanks in advance.
- Elle Yeoh asked 8 years ago
- last active 7 years ago
In my implementation I have the xAxis using a DateAxis in the dataset I am using there is only one data point.
The RolloverModifier is very sensitive it is very hard to highlight that one point.
RolloverModifier rolloverModifier = new VitalChartRolloverModifier();
rolloverModifier.setSourceMode(SourceMode.AllVisibleSeries);
rolloverModifier.setDrawVerticalLine(true);
rolloverModifier.setShowTooltip(true);
rolloverModifier.setShowAxisLabels(false);
rolloverModifier.setIsEnabled(true);
rolloverModifier.setUseInterpolation(false);
Is there a way of making it less sensitive?
- Simon Barnes asked 6 years ago
- last active 6 years ago
I would like to be able to use a triangle annotation that has a size parameter, so that I can add triangles of different sizes to chart.
I have seen the “Trade Markers” example that uses custom annotations defined by a path. But those annotations are a fixed size. How can I give them a size parameter?
I have tried this, but the point of the triangle doesn’t align with the X value, instead the triangle starts to the right of the X value.
public static CustomAnnotation UpTriangle(int x, double y, double size, Brush color, string axis)
//——————————————————————————————————————-
{
PointCollection myPointCollection = new PointCollection
{
new Point(0, 0),
new Point(1, 1),
new Point(-1, 1)
};
  return new CustomAnnotation()
  {
    X1 = x,
    Y1 = y,

    Content = new Polygon()
    {
      Points = myPointCollection,
      Height = size,
      Width = size,
      Stretch = Stretch.Fill,
      Fill = color,
      Stroke = color,
      StrokeThickness = 1,
    },
    YAxisId = axis
  };
}
Thank you for your help.
- Steven M asked 5 years ago
- last active 5 years ago
Hi,
We want to use scichart for ios-android and wpf platforms to use in our applications developed by our company for Financial (Trading) purposes. In our review, we found that we can use Linear Trendline for wpf platform in your documents. However, there was no documentation for the android and ios platforms. Since Linear Trendline is of great importance for trading, it is important to know whether this feature is available or if it will be developed as a new feature by you. I would ask you to provide information on the subject.
- Emre Gökberk asked 4 years ago
- last active 4 years ago
.Net 6 MAUI preview has been released, so may i know scichart support MAUI ?
Can we use Xmarin charts directly to MAUI app ?
Can you provide some examples for MAUI ?
- Abhilash R asked 3 years ago
- last active 8 months ago
Hi there,
Wow this library has come along way in ten years. My question is related to interaction between RS and the legend that is rendered by the chartmodifier.
I declare the legend something like this during the initial bootstrapping of the plot view:
        const legend = new LegendModifier({placementDivId: "legend-goes-here", id:"legend"});
        sciChartSurface.chartModifiers.add(legend);
After that, I have a custom interface available for users to change things, which eventually results in visibility or color changes, updating an RS something like this:
        const thisRs = surface.renderableSeries.getById(`${s.fileId}-${s.name}`);
        if (thisRs) {
            thisRs.isVisible = s.isVisible;
            thisRs.stroke = s.visualInfo?.colorCode ?? "#FFFFFF";
        }
These changes do not appear to be propagated to the legend despite the series on the plot changing. I guess my questions are:
1) What’s the expected behavior/is there something obvious I’m missing about the model?
2) Any suggestions?
It may very well be somewhere lost in my fairly complex React app, but I first wanted to confirm that I’m not missing something in the api.
Thanks!
Dan
- Daniel Santimore asked 11 months ago
- last active 6 months ago
Hi!
I am trying to use SciChartGroupPane and ChildPanes for my application, and
want to collapse a pane , so that the remaining space is filled with the remaining graphs.
I tried to set the visibility to collapsed but, when i do that the panes only disappear,
but the remaining pane does not resize.
As I see the panes have two small buttons on the upper right corner for collapse and close,
This collapse button is similar to what i would want but I have no idea how to reach the collapse
functionality throgh code. Is it possible to collapse a pane withouth removing it from the container
for the ItemTemplate?
Thanks
Chris
- Kristóf Czimer asked 8 years ago
- last active 8 years ago
Hello,
I’m wanting to switch to SciChart from a previous charting library. One neat thing that our previous library did that I cannot figure out how to do in SciChart is change the interaction between tooltips/rollover and panning.
What I would like to do is Pan/Drag the chart on short tap events, and do a rollover or tooltip cursor on long tap events. By default it looks like I get rollover and panning together on any tap event, which is not ideal behavior for my apps. Depending on the tap event type, I would like to do just one or the other, not both. How can I do something similar with SciChart?
Thank you,
- C Bolton asked 4 years ago
- last active 4 years ago
When using the CursorModifier and rolling over a series the numbers appear without thousand seperators ie: 10000 instead of 10,000. Is there a way I can add these?
- kelias asked 11 years ago
- last active 8 years ago
I have an unfinished project using the trial version on Visblox. I did not buy the licence since the performance was not good enough. Now Visiblox stopped support and so I am migrating to SciCharts. I have some questions though hope you can help.
-
The chart is DateTime,Double type, and there are multiply datapoints on some dates. When editing I need to delete particular points but the Remove method seems to remove all Y values for specific X value. So is it possible to remove a particular X,Y datapoint only from the chart?
-
I need to give each datapoint a name and I was using TextAnnotations on Visiblox (which had a datapoint property). However on SCIcharts the TextAnnotations does not have Datapoint property. How can I do this please?
-
I have 2 charts showing audio waveforms. One showing the full time and one showing a zoomed section. When I hit Play I need the zoomed chart to follow the music waveform. With Visiblox I was using a dispatcher timer and on every tick(20ms) I update the Xaxis range, however the performance was not very good.
What best method to use for SCI charts please?
- Julian Muscat asked 9 years ago
- last active 9 years ago
Dear all, I am trying to export a heat map that I have generated that you can see at the right side of the attached image. However, the resulting XPS generated is the figure at the left. As one can see they are not very similar as one would expect. I have checked my code, but can’t seem to find the problem. Parts of my code are shown here to give more info. If anyone has tips why this strange result may occur , let me know please.
 <s:SciChartSurface x:Name="sciChart"  ChartTitle="Carbon and DBE">


       <s:SciChartSurface.RenderableSeries>
           <s:FastHeatMapRenderableSeries x:Name="heatmapSeries" Opacity="0.5" Maximum="100">
               <s:FastHeatMapRenderableSeries.ColorMap>
                   <LinearGradientBrush>
                       <GradientStop Offset="0" Color="DarkBlue"/>
                       <GradientStop Offset="0.2" Color="CornflowerBlue"/>
                       <GradientStop Offset="0.4" Color="DarkGreen"/>
                       <GradientStop Offset="0.6" Color="Chartreuse"/>
                       <GradientStop Offset="0.8" Color="Yellow"/>
                       <GradientStop Offset="1" Color="Red"/>
                   </LinearGradientBrush>
               </s:FastHeatMapRenderableSeries.ColorMap>
           </s:FastHeatMapRenderableSeries>

       </s:SciChartSurface.RenderableSeries> .
    </s:SciChartSurface>
and code
    double[,] a = x.Normalized2DArray(100);
                    Heatmap2DArrayDataSeries<double, double, double> heatmap = new Heatmap2DArrayDataSeries<double, double, double>(a, ix => (double)ix * x.binSizeX, iy => (double)iy * x.binSizeY);
                      heatmapSeries.DataSeries = heatmap;
          sciChart.ExportToFile(@"C:\Temp\chart.xps", ExportType.Xps, true, new Size(2000, 2000));
- Michel Bieleveld asked 8 years ago
- last active 8 years ago
Hello,
how can i implement a vertically stacked y axis chart like in your example (WPF Chart Vertically Stacked YAxis) with MVVM and a varying number of y axes. Your example has a fixed number of y axes and the needed YAxesPanel is directly implemented in your xaml code. What is the best way to achieve the same result with a varying number of y axis?
Best regards
Alexander
- Alexander Lipp asked 5 years ago
- last active 5 years ago
Hi,
I found this through the forum:
https://www.scichart.com/scichart-2014-the-vision/
Seems you looked at Xamarin at one time or another, is there a plan to support this platform at some point in the future?
Thank you.
- Sebastian Dologa asked 8 years ago
- last active 7 years ago
Hi
I have added 24 Line graphs for EEG. Now I want to display the name of each channels against each graph. I am using Y steeped graph which you are using for Vital signs display in example code. Can you please let me know how to t to display the name of each channels against each graph
Best Regards,
Aditya
- Aditya Kadambi asked 3 years ago
- last active 3 years ago
It seems to me that DateTimeNumericAxis has edge cases where it can’t calculate deltas for some ranges.
This results in a console error, and the chart not loading:
Error from chart in div date-axis-bug RangeError: Maximum call stack size exceeded
at get minTicks [as minTicks] (index.min.js:1:577149)
at a (index.min.js:1:577393)
at a (index.min.js:1:577567)
at a (index.min.js:1:577483)
at a (index.min.js:1:577567)
at a (index.min.js:1:577483)
at a (index.min.js:1:577567)
at a (index.min.js:1:577483)
at a (index.min.js:1:577567)
at a (index.min.js:1:577483)
Provided codepen: https://codepen.io/jrfv/pen/xxQawom
Any suggestions?
Thanks!
- João Velasques asked 10 months ago
- last active 9 months ago
I getting a weird behavior on my xAxis and yAxis with a real time SciChart.
The labels on axes and the chart itself start shaking like it is trying to update positions but it never gets steady.
I have a background routine adding data to the data series every second and every chart have two series with 2 YAxis, there are only two charts visible in the window at a given time.
Also I have noticed that after a few minutes of doing this the window itself get sluggish and not responsive anymore, I switch to another tab which doesn’t have a chart it start responding again.
Have anyone seeing something like this?
I have tried the Performance Tips and Tricks but nothing changes this behavior.
I’m using a Surface 3 pro with SciChart version 3.3.0.5909
Here is my XAML and the dispatcher timer adding data to the dataseries.
<UserControl
x:Class="PulseControl.CustomControls.RealTimeEnergy"
xmlns="http://schemas.microsoft.com/winfx/2006/xaml/presentation"
xmlns:x="http://schemas.microsoft.com/winfx/2006/xaml"
xmlns:mc="http://schemas.openxmlformats.org/markup-compatibility/2006"
xmlns:d="http://schemas.microsoft.com/expression/blend/2008"
xmlns:m="clr-namespace:PulseControl.Models"
xmlns:ei="http://schemas.microsoft.com/expression/2010/interactions"
xmlns:ee="http://schemas.microsoft.com/expression/2010/effects"
xmlns:i="http://schemas.microsoft.com/expression/2010/interactivity"
xmlns:Custom="http://metro.mahapps.com/winfx/xaml/shared"
xmlns:PulseControl="clr-namespace:PulseControl"
xmlns:converters="clr-namespace:PulseControl.Converters"
xmlns:Controls="clr-namespace:MahApps.Metro.Controls;assembly=MahApps.Metro"
xmlns:s="http://schemas.abtsoftware.co.uk/scichart"
xmlns:cc="clr-namespace:PulseControl.CustomControls"
Width="Auto"
Background="{StaticResource WindowBackgroundBrush}"
mc:Ignorable="d" d:DesignHeight="140" d:DesignWidth="600" d:DataContext="{d:DesignInstance {x:Type m:MainWindowsModel}}"
>
<UserControl.Resources>
    <ResourceDictionary>
        <converters:IntToKiloConverter x:Key="Int2Kilo" />
    </ResourceDictionary>
</UserControl.Resources>

<DockPanel
    Background="{StaticResource WindowBackgroundBrush}" >

    <Grid
        DockPanel.Dock="Top"
        Height="140">
        <Grid.RowDefinitions>
            <RowDefinition Height="100"></RowDefinition>
            <RowDefinition Height="40"></RowDefinition>
        </Grid.RowDefinitions>
        <Grid.ColumnDefinitions>
            <ColumnDefinition Width="170"></ColumnDefinition>
            <ColumnDefinition Width="*"></ColumnDefinition>
            <ColumnDefinition Width="170"></ColumnDefinition>
        </Grid.ColumnDefinitions>


        <Border
            Grid.Column="0"
            Grid.Row="0"
            CornerRadius="50"
            Width="170"
            Margin="0"
            Padding="0"
            Background="{StaticResource ColorLeftChartBrush}"
            BorderThickness="1">
            <TextBlock
                Style="{StaticResource FieldTextBoxStyle}"
                Foreground="{StaticResource BlackBrush}"
                HorizontalAlignment="Center"
                Padding="0"
                Margin="0"
                FontSize="60"
                VerticalAlignment="Center"
                Text="{Binding Laser.OpData.AvgKiloVoltagePerSecond, Mode=OneWay, StringFormat={}{0:N1}}">
            </TextBlock>
        </Border>

        <Label
            Grid.Column="0"
            Grid.Row="1"
            Style="{StaticResource FieldLabelStyle}"
            FontSize="20"
            HorizontalAlignment="Center"
            VerticalAlignment="Top">
            Voltage (kV)
        </Label>


        <s:SciChartSurface
            Name="sciChart"
            Grid.Column="1"
            Grid.RowSpan="2"
            Height="140"
            Background="{StaticResource WindowBackgroundBrush}"
            s:SciChartGroup.VerticalChartGroup="OPERATION"
            Width="Auto"
            Margin="0"
            Padding="8 8 8 10"
            RenderPriority="Low"
            MaxFrameRate="30">

            <s:SciChartSurface.RenderableSeries>

                <s:FastMountainRenderableSeries
                    x:Name="serieVoltage"
                    SeriesColor="{StaticResource ColorLeftChart}"
                    StrokeThickness="2"
                    YAxisId="LAXIS"
                    DataSeries="{Binding ChartData.ChartDataVoltage}">
                    <s:FastMountainRenderableSeries.AreaBrush>
                        <LinearGradientBrush StartPoint="0,0" EndPoint="0,1">
                            <GradientStop Color="#A860a917" Offset="0"/>
                            <GradientStop Color="#3360a917" Offset="1"/>
                        </LinearGradientBrush>
                    </s:FastMountainRenderableSeries.AreaBrush>
                </s:FastMountainRenderableSeries>

                <s:FastMountainRenderableSeries
                    x:Name="serieEnergy"
                    SeriesColor="{StaticResource ColorRightChart}"
                    StrokeThickness="2"
                    YAxisId="RAXIS"
                    DataSeries="{Binding ChartData.ChartDataEnergy}">
                    <s:FastMountainRenderableSeries.AreaBrush>
                        <LinearGradientBrush StartPoint="0,0" EndPoint="0,1">
                            <GradientStop Color="#A83376E5" Offset="0"/>
                            <GradientStop Color="#333376E5" Offset="1"/>
                        </LinearGradientBrush>
                    </s:FastMountainRenderableSeries.AreaBrush>
                </s:FastMountainRenderableSeries>

            </s:SciChartSurface.RenderableSeries>

            <s:SciChartSurface.XAxis >
                <s:DateTimeAxis Name="xAxis" AutoRange="Always"  IsStaticAxis="True" TextFormatting="dd HH:mm" SubDayTextFormatting="HH:mm:ss" CursorTextFormatting = "mm:ss" Foreground="White"  />
            </s:SciChartSurface.XAxis>

            <s:SciChartSurface.YAxes>
                <s:NumericAxis
                    AutoRange="Always"
                    GrowBy="0,0.5"
                    IsPrimaryAxis="True"
                    AxisAlignment="Right"
                    Id="RAXIS"
                    Style="{StaticResource NoMinorLines}">
                </s:NumericAxis>
                <s:NumericAxis
                    AutoRange="Always"
                    GrowBy="0,0.25"
                    IsPrimaryAxis="False"
                    Id="LAXIS"
                    AxisAlignment="Left"
                    Style="{StaticResource NoMinorLines}">
                </s:NumericAxis>
            </s:SciChartSurface.YAxes>

            <s:SciChartSurface.ChartModifier>
                <s:ModifierGroup>
                    <s:RubberBandXyZoomModifier IsEnabled="{Binding ChartData.ZoomEnabled, Mode=TwoWay}" IsXAxisOnly="True"></s:RubberBandXyZoomModifier>
                    <s:ZoomPanModifier IsEnabled="{Binding ChartData.PanEnabled, Mode=TwoWay}"></s:ZoomPanModifier>
                    <s:MouseWheelZoomModifier IsEnabled="{Binding ChartData.MouseWheelEnabled, Mode=TwoWay}"></s:MouseWheelZoomModifier>
                    <s:RolloverModifier IsEnabled="{Binding ChartData.RolloverEnabled, Mode=TwoWay}"></s:RolloverModifier>
                    <s:CursorModifier IsEnabled="{Binding ChartData.CursorEnabled, Mode=TwoWay}"></s:CursorModifier>
                    <s:YAxisDragModifier></s:YAxisDragModifier>
                    <s:XAxisDragModifier></s:XAxisDragModifier>
                    <s:ZoomExtentsModifier></s:ZoomExtentsModifier>
                </s:ModifierGroup>
            </s:SciChartSurface.ChartModifier>

        </s:SciChartSurface>

        <Border
            Grid.Column="2"
            Grid.Row="0"
            CornerRadius="50"
            Width="170"
            Margin="0"
            Padding="0"
            Background="{StaticResource ColorRightChartBrush}"
            BorderThickness="1">
            <TextBlock
                Style="{StaticResource FieldTextBoxStyle}"
                Foreground="{StaticResource BlackBrush}"
                HorizontalAlignment="Center"
                Padding="0"
                Margin="0"
                FontSize="60"
                VerticalAlignment="Center"
                Text="{Binding Laser.OpData.AvgEnergyPerSecond, Mode=OneWay, StringFormat={}{0:N1}}">
            </TextBlock>
        </Border>

        <Label
            Grid.Column="2"
            Grid.Row="1"
            Style="{StaticResource FieldLabelStyle}"
            FontSize="20"
            HorizontalAlignment="Center"
            VerticalAlignment="Top">
            Energy (mJ)
        </Label>

    </Grid>

</DockPanel>
Model
void _timer_Tick(object sender, EventArgs e)
    {
        DateTime now = DateTime.Now;

            // Things to do when running
        SafeAddPoint(_chartDataEnergy, now, Laser.OpData.AvgEnergyPerSecond);
        SafeAddPoint(_chartDataEfficiency, now, Laser.OpData.ChamberEfficiency * 100.0);
        SafeAddPoint(_chartDataVoltage, now, Laser.OpData.AvgKiloVoltagePerSecond);
        SafeAddPoint(_chartDataPressure, now, Laser.OpData.Pressure);
        SafeAddPoint(_chartDataSigmaEnergy, now, Laser.OpData.SampleSigma);
        SafeAddPoint(_chartDataSigmaPercentage, now, Laser.OpData.SampleSigmaPercentage);
        SafeAddPoint(_chartDataTemperature, now, Laser.OpData.Temperature);
    }

    private void SafeAddPoint(IDataSeries serie, DateTime dt, double val)
    {
        if (serie.ParentSurface != null)
            using (serie.ParentSurface.SuspendUpdates())
                ((XyDataSeries<DateTime, double>)serie).Append(dt, val);
        else
            ((XyDataSeries<DateTime, double>)serie).Append(dt, val);
    }
- Jesus Mogollon asked 8 years ago
- last active 8 years ago
The X axis was set to two axes as follows.
        <s:SciChartSurface.XAxes>
            <s:NumericAxis DrawMajorBands="True"
                           FlipCoordinates="True"
                           GrowBy="0.1, 0.1"
                           Id="Time1" />
            <s:NumericAxis DrawMajorBands="True"
                           FlipCoordinates="True"
                           GrowBy="0.1, 0.1"
                           Id="Time2" />
        </s:SciChartSurface.XAxes>
We wanted to make it selectable with DataPointSelectionModifier for two axes, so we set as follows.
        <s:SciChartSurface.ChartModifier>
            <s:ModifierGroup>
                <s:DataPointSelectionModifier Name="PointMarkersSelectionModifier"
                                              IncludeSeries="False"
                                              IsEnabled="True"
                                              SelectionFill="#B1B5B2B2"
                                              SelectionStroke="#009E9C9C"
                                              XAxisId="Time1" />
                <s:DataPointSelectionModifier Name="PointMarkersSelectionModifier2"
                                              IncludeSeries="False"
                                              IsEnabled="True"
                                              SelectionFill="#B1B5B2B2"
                                              SelectionStroke="#009E9C9C"
                                              XAxisId="Time2" />
                <s:MouseWheelZoomModifier IsEnabled="True" />
                <s:RubberBandXyZoomModifier IsEnabled="False" />
            </s:ModifierGroup>
        </s:SciChartSurface.ChartModifier>
However, only XAxisId = “Time 1” works correctly.
How can we make two axes selectable?
- Kenichi Kobayashi asked 6 years ago
- last active 6 years ago
Hello everybody,
I hope you are fine,
I am working with DatapointeselectionModifier on a tablet windows.
I want to be able to select multiple points without pressing Left Ctrl keyboard.
Can you help me please?
Thank you very much.
- Princy Ramanda Andriampaniry asked 4 years ago
- last active 4 years ago
