SciChart® the market leader in Fast WPF Charts, WPF 3D Charts, iOS Chart, Android Chart and JavaScript Chart Components
Please note! These examples are new to SciChart iOS v4 release! SciChart’s OpenGL ES and Metal iOS and Metal macOS Chart library ships with hundred of Objective-C and Swift iOS&macOS Chart Examples which you can browse, play with and view the source-code. All of this is possible with the new and improved SciChart iOS Examples Suite and demo application for Mac, which ships as part of the SciChart SDK.
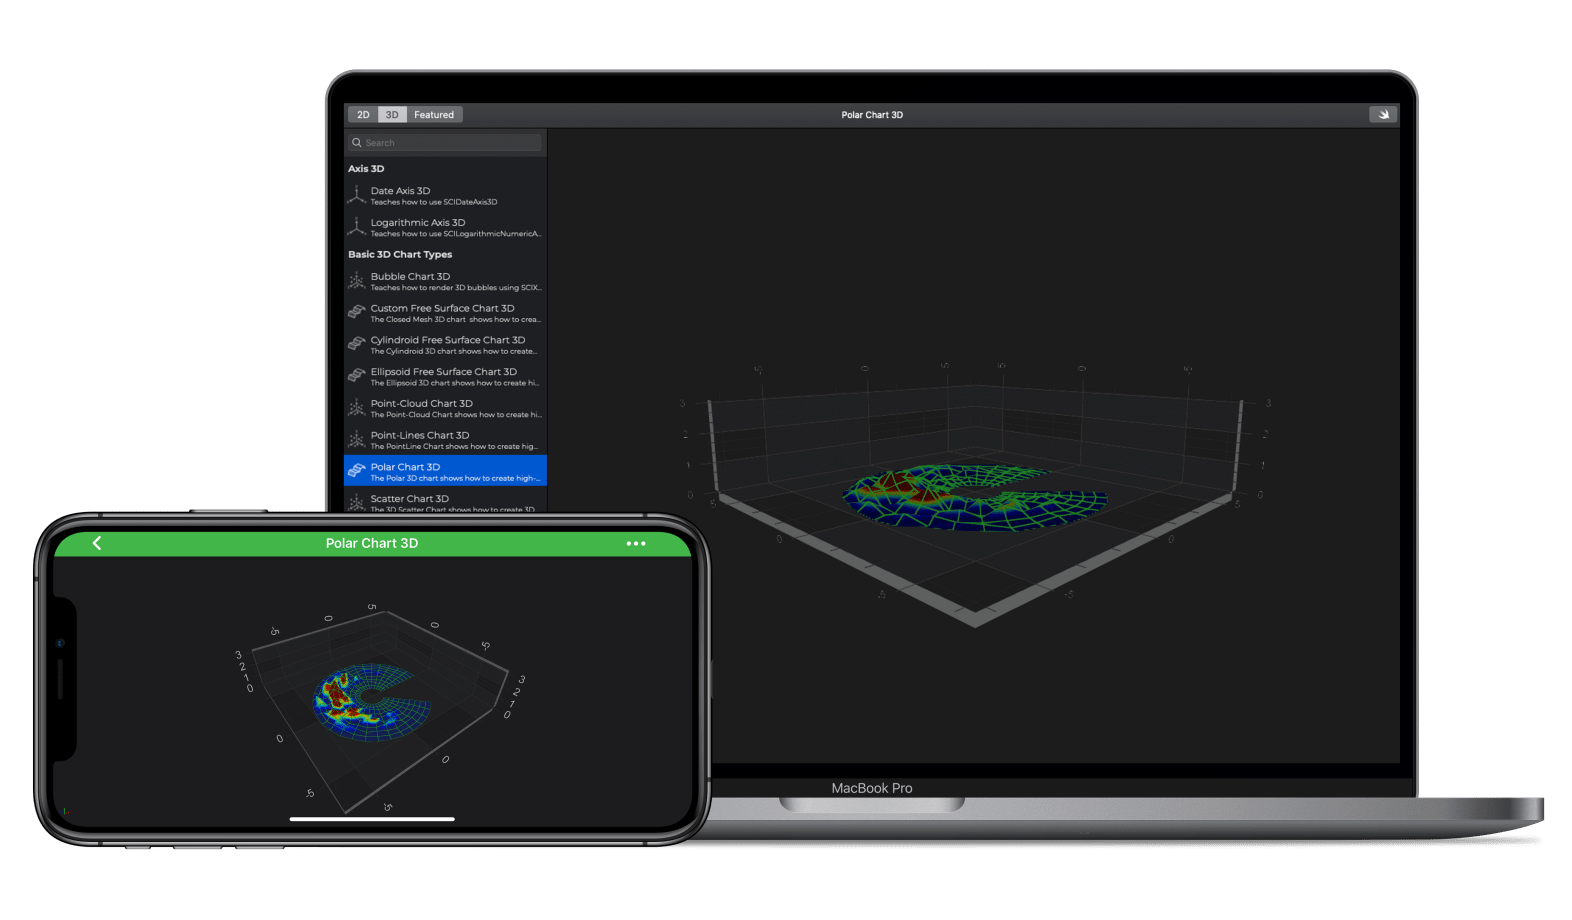
This example showcases how to create a Simple 3D Polar Chart in iOS Swift and Objective-C with SciChart. Polar 3D Charts are rendered by the SCIPolarDataSeries3D and SCIFreeSurfaceRenderableSeries3D Series.
The SciChart iOS chart library API allows you to define the Polar’s location and size, as well as set different palette modes (Radial, Axial, Polar and Azimuthal).SCIFreeSurfaceRenderableSeries3D Series allows you to create numerous types of shapes, including Sphere, Cylinder, Disc and free-form mesh shapes as well as overlay heightmap, colormap (palette) and contours, empowering your slick iOS applications. Take a look at other examples of shapes in this section: simple cylindroid chart, simple ellipsoid chart and a closed mesh chart.
You can find out more with SciChart Documentation for the iOS Polar 3D Chart Type.
The Swift and Objective-C source code for the iOS and macOS Simple Polar Chart 3D example is included below (Scroll down!).
Did you know that we have the source code for all our example available for free on Github?
Clone the SciChart.iOS.Examples from Github.
Also the SciChart iOS and Scichart macOS Trials contain the full source for the examples (link below).
//******************************************************************************
// SCICHART® Copyright SciChart Ltd. 2011-2019. All rights reserved.
//
// Web: http://www.scichart.com
// Support: support@scichart.com
// Sales: sales@scichart.com
//
// SimplePolar3DChartView.m is part of the SCICHART® Examples. Permission is hereby granted
// to modify, create derivative works, distribute and publish any part of this source
// code whether for commercial, private or personal use.
//
// The SCICHART® examples are distributed in the hope that they will be useful, but
// without any warranty. It is provided "AS IS" without warranty of any kind, either
// expressed or implied.
//******************************************************************************
#import "SimplePolar3DChartView.h"
#import "SCDRandomUtil.h"
@implementation SimplePolar3DChartView
- (Class)associatedType { return SCIChartSurface3D.class; }
- (void)initExample {
SCINumericAxis3D *xAxis = [SCINumericAxis3D new];
xAxis.visibleRange = [[SCIDoubleRange alloc] initWithMin:-7 max:7];
SCINumericAxis3D *yAxis = [SCINumericAxis3D new];
yAxis.visibleRange = [[SCIDoubleRange alloc] initWithMin:0 max:3];
SCINumericAxis3D *zAxis = [SCINumericAxis3D new];
zAxis.visibleRange = [[SCIDoubleRange alloc] initWithMin:-7 max:7];
const int sizeU = 30;
const int sizeV = 10;
SCIPolarDataSeries3D *ds = [[SCIPolarDataSeries3D alloc] initWithXType:SCIDataType_Double heightType:SCIDataType_Double uSize:sizeU vSize:sizeV uMin:0.0 uMax:M_PI * 1.75];
ds.a = @(1.0);
ds.b = @(5.0);
for (int u = 0; u < sizeU; ++u) {
double weightU = 1.0 - ABS(2.0 * u / sizeU - 1.0);
for (int v = 0; v < sizeV; ++v) {
double weightV = 1.0 - ABS(2. * v / sizeV - 1.0);
double offset = [SCDRandomUtil nextDouble];
[ds setDisplacement:@(offset * weightU * weightV) uIndex:u vIndex:v];
}
}
unsigned int colors[7] = { 0xFF00008B, 0xFF0000FF, 0xFF00FFFF, 0xFFADFF2F, 0xFFFFFF00, 0xFFFF0000, 0xFF8B0000 };
float stops[7] = { 0.0, 0.1, 0.3, 0.5, 0.7, 0.9, 1.0};
SCIGradientColorPalette *palette = [[SCIGradientColorPalette alloc] initWithColors:colors stops:stops count:7];
SCIFreeSurfaceRenderableSeries3D *rSeries = [SCIFreeSurfaceRenderableSeries3D new];
rSeries.dataSeries = ds;
rSeries.drawMeshAs = SCIDrawMeshAs_SolidWireframe;
rSeries.stroke = 0x77228B22;
rSeries.contourInterval = 0.1;
rSeries.contourStroke = 0x77228B22;
rSeries.strokeThickness = 2.0;
rSeries.lightingFactor = 0.8;
rSeries.meshColorPalette = palette;
rSeries.paletteMinMaxMode = SCIFreeSurfacePaletteMinMaxMode_Relative;
rSeries.paletteMinimum = [[SCIVector3 alloc] initWithX:0.0 y:0.0 z:0.0];
rSeries.paletteMaximum = [[SCIVector3 alloc] initWithX:0.0 y:0.5 z:0.0];
[SCIUpdateSuspender usingWithSuspendable:self.surface withBlock:^{
self.surface.xAxis = xAxis;
self.surface.yAxis = yAxis;
self.surface.zAxis = zAxis;
[self.surface.renderableSeries add:rSeries];
[self.surface.chartModifiers add:[SCDExampleBaseViewController createDefaultModifiers3D]];
[self.surface.worldDimensions assignX:200 y:50 z:200];
}];
}
@end
//******************************************************************************
// SCICHART® Copyright SciChart Ltd. 2011-2019. All rights reserved.
//
// Web: http://www.scichart.com
// Support: support@scichart.com
// Sales: sales@scichart.com
//
// SimplePolar3DChartView.swift is part of the SCICHART® Examples. Permission is hereby granted
// to modify, create derivative works, distribute and publish any part of this source
// code whether for commercial, private or personal use.
//
// The SCICHART® examples are distributed in the hope that they will be useful, but
// without any warranty. It is provided "AS IS" without warranty of any kind, either
// expressed or implied.
//******************************************************************************
class SimplePolar3DChartView: SCDSingleChartViewController<SCIChartSurface3D> {
override var associatedType: AnyClass { return SCIChartSurface3D.self }
let SizeU: Int = 30
let SizeV: Int = 10
override func initExample() {
let xAxis = SCINumericAxis3D()
xAxis.visibleRange = SCIDoubleRange(min: -7.0, max: 7.0)
let yAxis = SCINumericAxis3D()
yAxis.visibleRange = SCIDoubleRange(min: 0.0, max: 3.0)
let zAxis = SCINumericAxis3D()
zAxis.visibleRange = SCIDoubleRange(min: -7.0, max: 7.0)
let meshDataSeries = SCIPolarDataSeries3D(xType: .double, heightType: .double, uSize: SizeU, vSize: SizeV, uMin: 0.0, uMax: Double.pi * 1.75)
meshDataSeries.set(a: 1.0)
meshDataSeries.set(b: 5.0)
for u in 0 ..< SizeU {
let weightU = 1.0 - abs(2.0 * Double(u) / Double(SizeU) - 1.0)
for v in 0 ..< SizeV {
let weightV = 1.0 - abs(2.0 * Double(v) / Double(SizeV) - 1.0)
let offset = SCDRandomUtil.nextDouble()
meshDataSeries.setDisplacement(offset * weightU * weightV, atU: u, v: v)
}
}
let colors: [UInt32] = [0xFF1D2C6B, 0xFF0000FF, 0xFF00FFFF, 0xFFADFF2F, 0xFFFFFF00, 0xFFFF0000, 0xFF8B0000]
let stops: [Float] = [0.0, 0.1, 0.3, 0.5, 0.7, 0.9, 1.0]
let palette = SCIGradientColorPalette(colors: colors, stops: stops, count: 7)
let rSeries = SCIFreeSurfaceRenderableSeries3D()
rSeries.dataSeries = meshDataSeries
rSeries.drawMeshAs = .solidWireframe
rSeries.stroke = 0x77228B22
rSeries.contourInterval = 0.1
rSeries.contourStroke = 0x77228B22
rSeries.strokeThickness = 2.0
rSeries.lightingFactor = 0.8
rSeries.meshColorPalette = palette
rSeries.paletteMinMaxMode = .relative
rSeries.paletteMinimum = SCIVector3(x: 0.0, y: 0.0, z: 0.0)
rSeries.paletteMaximum = SCIVector3(x: 0.0, y: 0.5, z: 0.0)
SCIUpdateSuspender.usingWith(surface) {
self.surface.xAxis = xAxis
self.surface.yAxis = yAxis
self.surface.zAxis = zAxis
self.surface.renderableSeries.add(rSeries)
self.surface.chartModifiers.add(SCDExampleBaseViewController.createDefaultModifiers3D())
self.surface.worldDimensions.assignX(200, y: 50, z: 200)
}
}
}