Hi,
I’ve been trying to use CustomPointMarker to build a custom candle, but I need something like
CurrentRenderPassData.YCoordinateCalculator.GetCoordinate(yValue) to know the coordinates of a certain y value in the screen.
I look up CustomPointMarker documentation, but I haven’t found anything.
could you please help me?
Thank you
- lorenzo522 asked 8 years ago
- last active 8 years ago
Hello!
I am trying to programmatically set a range for HeatmapColorPalette and attached HeatmapColorMap to min and max of my data.
Binding HeatmapColorPalette.Maximum to a property in my View Model works well. However, when I add HeatmapColorMap everything breaks, the heat map no longer responds to changes in View Model.
What am I doing wrong?
Here is my View:
<Window x:Class="SciChartHeatMap.MainWindow"
    xmlns="http://schemas.microsoft.com/winfx/2006/xaml/presentation"
    xmlns:x="http://schemas.microsoft.com/winfx/2006/xaml"
    xmlns:d="http://schemas.microsoft.com/expression/blend/2008"
    xmlns:mc="http://schemas.openxmlformats.org/markup-compatibility/2006"
    xmlns:local="clr-namespace:SciChartHeatMap"
    xmlns:s="http://schemas.abtsoftware.co.uk/scichart"
    d:DataContext="{d:DesignInstance Type=local:HeatMapViewModel, IsDesignTimeCreatable=True}"
    mc:Ignorable="d"
    Title="MainWindow" Height="450" Width="800">
<Grid>
    <Grid.Resources>
        <s:GradientStopsToLinearGradientBrushConverter x:Key="ColorsToLinearGradientBrushConverter"/>
    </Grid.Resources>
    <Grid.ColumnDefinitions>
        <ColumnDefinition/>
        <ColumnDefinition Width="Auto"/>
        <ColumnDefinition Width="Auto"/>
    </Grid.ColumnDefinitions>
    <Grid.RowDefinitions>
        <RowDefinition Height="Auto"/>
        <RowDefinition/>
    </Grid.RowDefinitions>
    <s:SciChartSurface Grid.Row="0" Grid.RowSpan="2">
        <s:SciChartSurface.RenderableSeries>
        <s:FastUniformHeatmapRenderableSeries x:Name="HeatMapSeries" DataSeries="{Binding Data}" Opacity="0.9">
            <s:FastUniformHeatmapRenderableSeries.ColorMap>
                <s:HeatmapColorPalette Maximum="{Binding ColorMaximum}">
                    <s:HeatmapColorPalette.GradientStops>
                        <GradientStop Offset="0" Color="DarkBlue"/>
                        <GradientStop Offset="0.2" Color="CornflowerBlue"/>
                        <GradientStop Offset="0.4" Color="DarkGreen"/>
                        <GradientStop Offset="0.6" Color="Chartreuse"/>
                        <GradientStop Offset="0.8" Color="Yellow"/>
                        <GradientStop Offset="1" Color="Red"/>
                    </s:HeatmapColorPalette.GradientStops>
                </s:HeatmapColorPalette>
            </s:FastUniformHeatmapRenderableSeries.ColorMap>
        </s:FastUniformHeatmapRenderableSeries>
        </s:SciChartSurface.RenderableSeries>
        <s:SciChartSurface.XAxis>
            <s:NumericAxis
                FlipCoordinates="False"
                ScientificNotation="None"
                AutoTicks="False"
                MajorDelta="1"
                MinorDelta="0.5"
                AxisAlignment="Top"/>
        </s:SciChartSurface.XAxis>
        <s:SciChartSurface.YAxis>
            <s:NumericAxis
                FlipCoordinates="True"
                ScientificNotation="None"
                AxisAlignment="Left"/>
        </s:SciChartSurface.YAxis>
    </s:SciChartSurface>

    <!-- Enabling this will break the program
    <s:HeatmapColorMap
        Grid.Column="1"
        Grid.Row="0"
        Grid.RowSpan="2"
        Margin="5,0,5,0"
        HorizontalAlignment="Right"
        VerticalAlignment="Stretch"
        DataContext="{Binding Source={x:Reference Name=HeatMapSeries}, Mode=OneWay}"
        ColorMap="{Binding ColorMap.GradientStops, Converter={StaticResource ColorsToLinearGradientBrushConverter}}"
        Maximum="{Binding ColorMap.Maximum}"
        Orientation="Vertical">
    </s:HeatmapColorMap>
    -->

    <Label
        Grid.Row="0"
        Grid.Column="2"
        Content="{Binding ColorMaximum}"
        Width="50"
        HorizontalContentAlignment="Center"/>
    <Slider
        Grid.Column="2"
        Grid.Row="1"
        Orientation="Vertical"
        Minimum="0"
        Maximum="10"
        HorizontalAlignment="Center"
        Value="{Binding ColorMaximum}"/>
</Grid>
The idea in this small example is for slider to control both HeatmapColorPalette.Maximum and s:HeatmapColorMap.Maximum
The code in my View Model is pretty simple:
private double mColorMax;

public double ColorMaximum
    {
        get => mColorMax;

        set
        {
            mColorMax = value;
            OnPropertyChanged();
        }
    }
My View Model implements INotifyPropertyChanged
I will appreciate any suggestions.
Thank you in advance!
- Alexander Gdalevich asked 5 years ago
- last active 5 years ago
Is there a way to apply functionalities on signals as in average, slope, etc. ?
Thank you
Anders
- Anders Persson asked 2 years ago
- last active 2 years ago
I am considering applying server-side licensing for my javerScript application.
In the document below, there is a phrase “Our server-side licensing component is written in C++.”
(https://support.scichart.com/index.php?/Knowledgebase/Article/View/17256/42/)
However, there is only asp.net sample code on the provided github.
(https://github.com/ABTSoftware/SciChart.JS.Examples/tree/master/Sandbox/demo-dotnet-server-licensing)
I wonder if there is a sample code implemented in C++ for server-side licensing.
Can you provide c++ sample code?
Also, are there any examples to run on Ubuntu?
- John Flemmer asked 2 years ago
- last active 2 weeks ago
I have just finished my first pass evaluation of the SciChart performance. When drawing a lesser number of points (<100000), SciChart outperforms two other packages I have evaluated. However, when drawing more points (200,000 – 2,000,000), SciChart does not meet the performance of the other packages.
The evaluation involved selecting a different number of lines and number of points per line. The transition to worse performance occurred in the following setups:
Line Count Points/Line Loop Count Total Time (ms)
2 100,000 25 1890
5 100,000 25 4670
2 1,000,000 10 7400
2 10,000,000 10 74000
These setups average out to about 0.37 usec per point. This is where the other packages outperformed SciChart, as their per point times kept improving.
I have tried to follow all of the performance tips I found on your website. I have included the code used to evaluate SciChart and would appreciate any help in improving the results.
Thanks,
Dave
- Dave Leach asked 8 years ago
- last active 8 years ago
Hi!
I’ve tried to access the values to print them in a different view, but I cant reach them. So my question is there a specific way to reach them?
- Robin Bergqvist asked 5 years ago
- last active 5 years ago
Hello is there way to update points in XyDataSeries without Garbage Collector call? Here is my code:
public void RefreshSignal(float[] xData, float[] yData)
{
        if (_series == null)
        {
             _series = new XyDataSeries<float, float>();
            _series.Append(xData, yData);
        }

         for (int i = 0; i < xData.Length; i++)
         {
               _series.Update(xData[i], yData[i]);
         }
}
I may use _series.YValues[i], but then UI will not update.
Main task for me fast update all 25k points in series each 30ms without GC calls.
- Konstantin Shapovalov asked 4 years ago
- last active 2 years ago
Hi,
All MyGet systems which host the SciChart nuget feeds are down: https://status.myget.org/
Does someone know where to report this issue and how to get any more information on this downtime? E.g. is it planned and is there an estimate how long this is going to take?
Thanks!
- Christian Liebhardt asked 9 months ago
- last active 9 months ago
Hi,
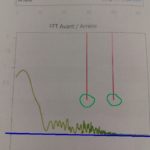
I have been struggling to print a page( xaml UserControl) containing charts and some other informations using PrintDialog. I can print but I have got issues (see the attached images)
-
The quality of the FastLineRenderableSeries is really low (looks like blurred) even though the StrokeThickness is set to its lowest value which is 1.
-
The verticalLines do not cover the entire graph (see the image) even though they are drawn correctly before printing. See on the image attached, their labels are well presented on the X axis but they dont extend to the axis.
-
The graph (FastLineRenderableSeriesis ) looks like is floating, before printing it looks all good (zoomed to extents / covering the whole frame) when printed it’s like there is a space added (all that which is below the blue line) which makes the graph look like it is floating.
I have seen in this forum some other questions and answers on how to print a graph (and only a graph) but not graphs and some other informations on a xaml page which is what I would want.
Here is the Image of the printed paper:
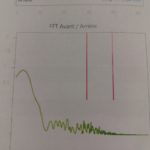
and the image with labels of what’s not Ok:
This is what I do to print:
PrintDialog prnt = new PrintDialog();
    if (prnt.ShowDialog() == true)
    {
        Size pageSize = new Size(prnt.PrintableAreaWidth , prnt.PrintableAreaHeight );
        MyUserControl.Measure(pageSize);
        PrntFrm.Arrange(new Rect(0, 0, pageSize.Width, pageSize.Height));
        prnt.PrintVisual(MyUserControl, "Rapport");
    }
Thanks for helping.
Kilosa M.
- Kilosa Magali asked 8 years ago
My company is pondering buying the SciCharts suite and using the wpf chart for one of our flagship applications. I have a couple questions about what the control supports. Do the charts support users adding a note (tooltip) to a certain point on the line chart? How it works currently is the user right clicks on the chart, types in the note that they want to display and it creates a tooltip at the current position that they clicked on. Can this happen with SCIChart’s LineChart? We also have a need for them to be able to click on a certain point on the chart and drag the marker to another point and have it show the time between the two points. The last thing we need is to be able to click on a line and show statistics for that line (min, max, average, create data, active or not, formatting formula, etc…). I looked for examples of these and could not find them. Can you tell me if these features exist or are possible to implement dynamically? Thank you.
- Clifford Bateman asked 7 years ago
(Edited to add code blocks)
I am trying to draw 4 series simultaneously on a chart. I have 2 Scatter plot series, a FastLineRenderableSeries (Which I’ll call the trendline) and I have a FastErrorBarsRenderableSeries which I’ll call the uncertainty. The scatter plots always draw.
When I draw the scatter plots and the trendline, everything looks right. As soon as I add any points to the HlcDataSeries in the uncertainty, though, the trendline disappears, and the error bars won’t draw. It’s very strange.
Below is my xaml and code (edited for clarity).
   void SetData(int channels, MyDataSet incomingData){
        var n = incomingData.Count;
        var unc = new List<Point>(n); //Point has x y coords and uncertainty
        double[] xValues = new double[n], yValues = new double[n];
        for (int i = 0; i < n; i++)
        {
            var x = incomingData[i].X.Value; //Incoming data has x y coords
                                                                  //with uncertainties in each direction
            var y = incomingData[i].Y.Value;
            xValues[i] = x;
            yValues[i] = y;
            var yVal = incomingData[i].Y;
            if (yVal is not { Uncertainty: not null and not 0 }) continue;
            unc.Add(incomingData[i]);
        }
        if (xValues.Any())
            PointData = new XyDataSeries<double>(xValues, yValues);
        var xList = new double[channels];
        var yList = new double[channels];
    if (incomingData.CalibrationCoefficients == null)
    {
            incomingData.Fit(); //Generate coefficients
    }
    for (var i = 0; i < channels; i++)
    {
          xList[i] = i;
          yList[i] = incomingData.GetY(i); //Apply Coefficients
     }
    LineData = new XyDataSeries<double>(xList, yList);
    unc.Add(new Point(1, 0, 100, 50)); //x, x uncertainty, y, y uncertainty
    unc.Add(new Point(10, 0, 100, 50));//Adding bogus data to ensure uncertainty
    unc.Add(new Point(100, 0, 1000, 50));
    unc.Add(new Point(1000, 0, 500, 50));
    unc.Add(new Point(5000, 0, 250, 50));
    if (unc.Any())
    {
        UncertaintyData = new HlcDataSeries<double, double>();
        var hlc = (HlcDataSeries<double, double>)UncertaintyData;
        foreach (var t in unc)
        {
            var uncertainty = Math.Abs(t.Y.Uncertainty);
            var y = t.Y.Value;
            hlc.Append(t.X.Value, y,
                y- uncertainty,
                y+ uncertainty);
        }
    }
}
And my Xaml:
 <s:SciChartSurface MinWidth="200" MinHeight="200"
                                   Name="ChartSurface" Padding="0"
                                   Style="{Binding CurrentChartStyle}" >
            <s:SciChartSurface.RenderableSeries>
 <!-- Scatter plots omitted for brevity -->
                <s:FastErrorBarsRenderableSeries DataSeries="{Binding UncertaintyData}"
                                                 ErrorDirection="YAxis"
                                                 Stroke="Blue"
                                                 StrokeThickness="2"
                                                 LastErrorBarWidth="7"
                                                 DataPointWidthMode="Absolute"
                                                 />

                <s:FastLineRenderableSeries x:Name="LineSeries" AntiAliasing="True" Stroke="Gray"
 DataSeries="{Binding LineData}" StrokeThickness="2"/>
            </s:SciChartSurface.RenderableSeries>
 <!-- Axes omitted for brevity -->
        </s:SciChartSurface>
- Isaac Sherman asked 7 months ago
- last active 7 months ago
Hello,
I bought a license and when I try to deploy my application it seems to be crashing. The application will build and run fine in Visual Studio. I have tried removing the scichart portions from my app and deploying and it runs fine then. I have tried following the tutorial for deployment located here:
https://www.scichart.com/activating-scichart/
but have not had any luck. Would anyone be able to offer any assistance with deploying with scichart?
Thank you for your time and assistance with this,
Max
- Max Kelly asked 4 years ago
- last active 4 years ago
Several legends are displayed using LegendModifier.
-
Using ScrollViewer.VerticalScrollBarVisibility=”Auto”, it was possible to move using mouse scrolling, bar grabbing, etc., but it did not work when the border was dragged in a screen touch environment. Is there a way to drag on a touch monitor?
-
It is being displayed using Orientation=”Horizontal”, but there is a limit to displaying it on one line due to the large number of legends. What document can I refer to if I want to change it to display as multi-line? I think the MVVM method would be best.
- Lee Ji Un asked 6 months ago
- last active 6 months ago
I can’t establish a runtime license in my application because the method doesn’t show up in the intellisense.
SciChartSurface.SetRuntimeLicenseKey.
In fact, no methods exist for this class (I’m assuming this is a static class and method). I’m getting this class via…
SciChart.Charting.Visuals.SciChartSurface.
I’m guessing that this is not where this class is located, but I can’t figure out where it is.
- Chris Kirkman asked 6 years ago
- last active 6 years ago
I want to customise BrightSpark theme from scratch.
In the page below, there is SciChartv4Dark theme’ s xaml.
https://www.scichart.com/documentation/win/current/webframe.html#Creating%20a%20Custom%20Theme.html
Can I get same thing for BrightSpark theme?
- Hiroyuki Seki asked 2 years ago
Hi SciChart!
I am evaluating the trial for possible use in a major project within our organisation.
We have decided to use the System.Reactive reactive extensions as our event handler and I have reached the point where I have an IObservableCollection (instantiated as ObservableCollectionExtended) of where T can be any type containing X and Y values.
My question is, is it possible to Bind a scichart Line Series on to such a collection in order to update via the reactivestream updates?
I’d rather not have to copy points into yet another collection type if possible.
Note: I looked at the nuget for scichart wpf reactive library and that seems to bind on to rx 2.2.5 whereas I’m using system.reactive 4.1.6
Any direction for a new-to-reactive developer would be greatly received.
Greg
- Greg Benedict asked 5 years ago
- last active 5 years ago
When the GrowBy property on NumericAxis3D is specified, a tooltip modifier on the same 3D chart shows over data points that are not those under the mouse pointer.
To replicate the issue:
-
Clone the examples project from GitHub and open the SciChart2D3D.Examples solution.
-
In UniformColumn3D.xaml change the XAxis, YAxis, ZAxis and ChartModifier elements to the following, from line 101 onwards:
<s3D:SciChart3DSurface.XAxis> <s3D:NumericAxis3D AutoRange="Always" /> </s3D:SciChart3DSurface.XAxis> <s3D:SciChart3DSurface.YAxis> <s3D:NumericAxis3D AutoRange="Always" /> </s3D:SciChart3DSurface.YAxis> <s3D:SciChart3DSurface.ZAxis> <s3D:NumericAxis3D AutoRange="Always" /> </s3D:SciChart3DSurface.ZAxis> <s3D:SciChart3DSurface.ChartModifier> <s3D:TooltipModifier3D HoverDelay="150" CrosshairMode="Lines" ShowTooltipOn="MouseOver" /> </s3D:SciChart3DSurface.ChartModifier> -
Run the application and observe that the 3D Charts -> Basic Chart Types -> Uniform Column 3D chart shows a chart with correct tooltips appearing when the mouse is hovered over columns on the chart.
-
Add GrowBy=”0.1, 0.1″ to each axis property as follows:
<s3D:SciChart3DSurface.XAxis> <s3D:NumericAxis3D AutoRange="Always" GrowBy="0.1,0.1" /> </s3D:SciChart3DSurface.XAxis> <s3D:SciChart3DSurface.YAxis> <s3D:NumericAxis3D AutoRange="Always" GrowBy="0.1,0.1" /> </s3D:SciChart3DSurface.YAxis> <s3D:SciChart3DSurface.ZAxis> <s3D:NumericAxis3D AutoRange="Always" GrowBy="0.1,0.1"/> </s3D:SciChart3DSurface.ZAxis> -
Run the application again and hover the mouse over the same chart. Note that the tooltop is now shown for a data point different to whichever one the mouse is over at the time, which is incorrect.
- Stephen Hewlett asked 4 years ago
- last active 4 years ago
I’m having issues with displaying my vertical annotations on my chart. Below is the code for creating the annotation and adding it to the chart.
var annotationLine = new VerticalLineAnnotation();
annotationLine.XAxisId = XAxisID;
annotationLine.YAxisId = YAxisID;
annotationLine.Stroke = new SolidColorBrush(Colors.Blue);
annotationLine.StrokeThickness = 2;
annotationLine.IsHidden = false;
annotationLine.AnnotationCanvas = AnnotationCanvas.BelowChart;
annotationLine.Y1 = 0;
annotationLine.Y2 = ControlHeight;
annotationLine.X1 = xValues[i];
Surface.Annotations.Add(annotationLine);
I have verified that the XAxisId and the YAxisId are correct and match the id of the only axes that I have on the chart
I have verified that the xValues[i] is a valid value on the chart and within the bounds of the viewport
The tricky part here is that I am reading live streaming EEG data from a device and inserting manual triggers into the data. This works fine and the annotations appear in the chart as they are within the bounds of the chart.
I then record that data to a file (currently csv but will be doing EDF as soon as I get this figured out) where the annotation data is present (verified)
It’s when I try to read the file into my application that I can’t get the annotations to appear on the SciChart. I’m using the code above for both the live streaming data (working) and the file reading (not working) so I’m really baffled by this and could use any insight anyone has.
Thank you
- Tom Jorgensen asked 1 year ago
- last active 1 year ago
I’m trying to render Histograms at runtime where the bins’ information like upper and lower bounds and width are known. However when I set the DataPointWidth to 0.2 for example, the bin spacing is different. Here is my code and XAML:
        // We can create a histogram with evenly spaced bins
        // by specifying the lower bound, the upper bound,
        // and the number of bins:
        var histogram = Histogram.CreateEmpty(values.Min(), values.Max(), numberOfBins);
        double width = (values.Max() - values.Min()) / numberOfBins;
        histogram.Tabulate(values);

        foreach (var bin in histogram.BinsAndValues)
        {
            XyDataSeries<double, double> dataSeries = new XyDataSeries<double, double>();
            dataSeries.Append(bin.Key.LowerBound, bin.Value);
            pointList.Add(new ColumnRenderableSeriesViewModel() { DataSeries = dataSeries, StrokeThickness = 2, Stroke = Colors.Gray, Fill = Brushes.CornflowerBlue, DataPointWidth = 0.2 });
        }

        ChartData = new ObservableCollection<IRenderableSeriesViewModel>(pointList);

        <Style x:Key="BaseColumnStyle" TargetType="s:FastColumnRenderableSeries">
        <Setter Property="Opacity" Value="0.3"/>
        <Setter Property="StrokeThickness" Value="2"/>
    </Style>

    <Style x:Key="BlueColumnStyle" BasedOn="{StaticResource BaseColumnStyle}" TargetType="s:FastColumnRenderableSeries">
        <Setter Property="Fill" Value="CornflowerBlue"/>
    </Style>
    <!--  Define styles for the SciChartSurface  -->
    <Style x:Key="SciChartSurfaceStyle" TargetType="s:SciChartSurface">
        <Setter Property="Background" Value="White"/>
        <Setter Property="Padding" Value="20"/>
        <Setter Property="Foreground" Value="Black"/>
        <Setter Property="FontSize" Value="20"/>
        <Setter Property="FontFamily" Value="Arial Black"/>
        <Setter Property="FontWeight" Value="Bold"/>
    </Style>

    <!--  Define styles for the GridLinesPanel  -->
    <Style x:Key="GridLinesPanelStyle" TargetType="s:GridLinesPanel">
        <Setter Property="Background" Value="White"/>
        <Setter Property="BorderThickness" Value="1"/>
        <Setter Property="BorderBrush" Value="Black"/>
    </Style>

    <!--  Using the LayoutTransform is much more apropriate in this point  -->
    <!--  the RenderTransform is used for demonstration purposes only,  -->
    <!--  for the compatibility with Silverlight reasons  -->
    <Style x:Key="AxisLabelStyle" TargetType="s:DefaultTickLabel">
        <!--<Setter Property="RenderTransform">
            <Setter.Value>
                <RotateTransform Angle="-15"/>
            </Setter.Value>
        </Setter>-->
        <Setter Property="Margin" Value="0"/>
    </Style>

    <!--  Define styles for the X and Y Axes  -->
    <Style x:Key="AxisStyle" TargetType="s:AxisBase">
        <Setter Property="FontSize" Value="18"/>
        <Setter Property="FontWeight" Value="Normal"/>
        <Setter Property="FontFamily" Value="Arial"/>
        <Setter Property="TitleFontSize" Value="12"/>
        <Setter Property="TitleFontWeight" Value="Bold"/>
        <Setter Property="TickTextBrush" Value="Black"/>
        <Setter Property="DrawMajorBands" Value="False"/>
        <Setter Property="DrawMinorGridLines" Value="False"/>
        <Setter Property="DrawMinorTicks" Value="False" />
        <Setter Property="DrawMajorTicks" Value="False"/>
        <Setter Property="TickLabelStyle" Value="{StaticResource AxisLabelStyle}"/>
        <Setter Property="MajorGridLineStyle">
            <Setter.Value>
                <Style TargetType="Line">
                    <Setter Property="Stroke" Value="LightGray"/>
                    <Setter Property="StrokeThickness" Value="1"/>
                </Style>
            </Setter.Value>
        </Setter>
    </Style>
</UserControl.Resources>
<Grid>
    <s:SciChartSurface x:Name="histogram" ChartTitle="{Binding ChartTitle}" RenderableSeries="{s:SeriesBinding ChartData}"
                       Style="{StaticResource SciChartSurfaceStyle}" GridLinesPanelStyle="{StaticResource GridLinesPanelStyle}">
        <s:SciChartSurface.XAxis>
            <s:NumericAxis AxisTitle="{Binding XAxisTitle}" Style="{StaticResource AxisStyle}" AutoRange="Always"/>
        </s:SciChartSurface.XAxis>
        <s:SciChartSurface.YAxis>
            <s:NumericAxis AxisTitle="{Binding YAxisTitle}" AxisAlignment="Left" Style="{StaticResource AxisStyle}"/>
        </s:SciChartSurface.YAxis>
    </s:SciChartSurface>
</Grid>
How can I make the bin spacing the same independent of bin width? See my attachment of two different histograms with the DataPointWidth for each.
- Dave Frey asked 7 years ago
- last active 7 years ago
Hi,
There are some methods exposed in the API, ZoomBy and ZoomExtent which can programmatically be called from the code behind.
I am binding the series using IRenderableSeriesViewModel in MVVM pattern. Can we zoom the sciChart surface on a button click in ModelView?
Appreciating your help on this.
Thanks
- Anil Prasad asked 7 years ago
- last active 7 years ago
Hi,
I’m attempting to attach a generic/abstract DataSeries to an INotifyPropertyChanged object. However, the TX, TY generics seem to block me from using it as expected. Can anyone help me out?
internal class DataSeriesAbstract : INotifyPropertyChanged
{
    public string dataName;
    public double lastAppendedTimestamp = 0.0f;

    public List<AbstractChartViewModel> subscribers;

    // gives an error that TX and TY cannot be found
    public DataSeries<TX, TY> realData;
    public DataSeries<TX, TY> Data
    {
        get { return realData; }
        set
        {
            realData = value;
            OnPropertyChanged(dataName);
        }
    }
...
}
Thank you
- Matt Carroll asked 5 years ago
- last active 5 years ago
Hello Scichart Team,
Can you guys provide me with some guidance to implement a custom IRenderableSeriesViewModel implementation that is supported in MVVM binding in Scichartsurface? Specifically, I’m looking to create a chart series that can be bound to my ViewModel and support custom styling and data handling.
I have tried following the tutorial found here…
Worked Example – CustomRenderableSeries in MVVM
https://www.scichart.com/documentation/win/current/webframe.html#Worked%20Example%20-%20CustomRenderableSeries%20in%20MVVM.html
I was getting a cast error from scicharts. I have attached the picture showing the detailed error.
Concerning the XAML code I have tried both the normal Binding keyword and s:SeriesBinding keyword to the RenderableSeries in the SciChartSurface.
Let me know how to go about this!
- Arjun Sivaprasadam asked 1 year ago
- last active 1 year ago
Dear all
When the binding data is changed in real time to the ColumnRenderableSeries, the pointer size of the corresponding series is changed to an arbitrary size.
ColumnRenderableSeries wants to know if it can fix the size when the x and z axes are changed in real time.
Or, I want to know if there is a function that can calculate the position of xyz in 3D chart and adjust the height of the corresponding pointer.
Thank you for your reply.
- Lee JunHee asked 6 years ago
- last active 6 years ago
Hi,
I’m experimenting with the LegendModifier and want to control which RenderableSeries are shown via the “LegendItemTemplate” approach. The idea is to add a specific tagging class to the RenderableSeries.DataSeries.Tag and use the content inside the LegendItemTemplate which I define in the Window.Resouces.
The tagging Class:
public class DataSeriesTag
{
    public string LegendText { get; set; }
    public bool ShowLegend { get; set; }
}
The LegendItemTemplate:
<Window.Resources>
<Grid.ColumnDefinitions>
</Grid.ColumnDefinitions>
            <!--<CheckBox Width="16" Margin="5,0,0,0"
                HorizontalAlignment="Left"
                VerticalAlignment="Center"
                IsChecked="{Binding RenderableSeries.IsVisible, Mode=TwoWay}"
                Visibility="{Binding RenderableSeries.DataSeries.Tag.ShowLegend, Converter={dxmvvm:BooleanToVisibilityConverter}}" />-->

            <s:PointMarker Grid.Column="1" Margin="5,0,0,0" Width="40" Height="10" VerticalAlignment="Center" HorizontalAlignment="Center"
              DataContext="{Binding RenderableSeries}"
              DeferredContent="{Binding LegendMarkerTemplate}"
              Visibility="{Binding ShowSeriesMarkers, RelativeSource={RelativeSource AncestorType=s:SciChartLegend}, Converter={dxmvvm:BooleanToVisibilityConverter}}" />

            <TextBlock Margin="5,0,5,0"
     Grid.Column="2"
     HorizontalAlignment="Left"
     Text="{Binding RenderableSeries.DataSeries.Tag.LegendText}" />

        </Grid>
    </DataTemplate>
</Window.Resources>
As long as I declare the SciChartSurface.ChartModifier in XAML, it works perfect.
The proplem raises when I bind the ModifierGroup to a ViewModel Property and try to build the LegendModifier there. How can I assign the LegendItemTemplate in the ViewModel?:
legendModifier = new LegendModifier(){
            ShowLegend = true,
            ShowVisibilityCheckboxes = false,
            LegendItemTemplate = ??????
        };
        TheModifiers.ChildModifiers.Add(legendModifier);
Kind regards
Martin
- Martin Mohr asked 4 years ago
- last active 4 years ago
Current, I am working an WPF application which using SciChart to draw many charts including a Stacked column chart.
In my case, there are many StackedColumnRenderableSeries in a chart, one of them has less data points then others do and this chart will be rendered incorrectly in a strange way, espcially when I zoomed in and panned it.
You can get source code for my example project from attached files.
Have anybody ever got this issue before?
What is the best way to resolve it?
Thank you for your support!


- hapham.sioux asked 8 years ago
- last active 8 years ago
Hello!
I have a problem with disappearing points on refresh.
I have a measuring process in progress, so my new data coming continously. When the next data is added to my collection, it refreshes the whole graph (Clear, then re-add every point). Sometimes (sporadically) it happens, that some of my points are invisible, but after something changes (new point is added/zooming in the chart etc…) everything is back to normal again.
I have attached a gif, where I have all my 100 points arrived, but only 29 is visible. I need visible points every time.
(I am using ObservableCollection, when CollectionChanged is triggered, I clear my XyDataSeries and add every element from my collection.)
Could you please give me some hint?
Thank you!
- László Jancsó asked 1 year ago
Hi i am new to SCiChart and i was wondering if there is an option to double click on screen and make it full screen or maybe some sort of un-dock it or open it in new window full screen?
Thx
- [email protected] asked 8 years ago
- last active 8 years ago
Hi,
I have made the chart vertical by changing X axis alignment to left and Y axis alignment to bottom. After changing like this, im not able to resize the box annotation using all four resize adorners. Only two working, other two resetting Y1 value. below is the code snippet.
<s:SciChartSurface.Annotations>
     <s:BoxAnnotation
         x:Name="rangeBox"
         AnnotationCanvas="AboveChart"
         Background="Red"
         ClipToBounds="False"
         CoordinateMode="RelativeX"
         DragDirections="YDirection"
         IsEditable="True"
         Opacity="0.3"
         ResizeDirections="YDirection"
         X1="{Binding TopDepth, Mode=OneWay, UpdateSourceTrigger=PropertyChanged}"
         X2="{Binding BottomDepth, Mode=OneWay, UpdateSourceTrigger=PropertyChanged}"
         Y1="0"
         Y2="1"
         YAxisId="Top" />
 </s:SciChartSurface.Annotations>
 <s:SciChartSurface.XAxis>
     <s:NumericAxis
         AutoRange="Once"
         AxisAlignment="Left"
         AxisTitle="Depth [ft]"
         DrawMajorBands="False"
         FlipCoordinates="{Binding FlipYAxis}"
         TitleStyle="{StaticResource AxisTitleStyle}" />
 </s:SciChartSurface.XAxis>
 <s:SciChartSurface.YAxis>
     <s:NumericAxis
         AxisAlignment="Bottom"
         BorderBrush="DarkGray"
         BorderThickness="0,0,0,1"
         DrawMajorBands="False"
         DrawMajorGridLines="True"
         Id="Top"
         TickTextBrush="DarkGray"
         TitleStyle="{StaticResource AxisTitleStyle}" />
 </s:SciChartSurface.YAxis>
Can you please let me know what i’ve missed?
Thanks
-MK
- Sync Kumar asked 4 years ago
- last active 4 years ago
SciChart is creating too much garbage objects/events* instead of reusing through pools (Analysis through dotMemory shows this). In complex applications this additional gc-pressure causes frequent lockups. (GC Pauses in 50-250ms+ range).
Top backtraces for GC-Problem:
– WeakEventTable.Purge
– Tick Rendering (TimeSpan, Strings)
– ProperyChangedEventManager.Purge
Top Types:
– WeakEventTable+EventKey
– HybridDictionary
– Double, String, TimeSpan
– Action
All of these top types/backtraces result directly from SciChart as we cross-verified with your 2D-Chart-Realtime-Series demo and by omitting the SciChart controls from our application. ( 2/3 of the total memory pressure comes from SciChart with even just 2 charts being present in our application, we see 5MB garbage memory traffic per 2 second, resulting in very frequent GC collections sporadically spiking into a high duration)
We currently use SciChart WPF V5, it seems SciChart WPF V6 Demo didnt fix this instead just using the LowLatency GC mode causing more frequent GC-collections causing worse overall performance in complex applications. (as we verfied in our application)
Is there plans to increase memory/object reuse/pooling and reduce events/actions? (70k allocations of events/actions for short time spans arent really understandable). What are those 70k events for simply rendering a chart with not much changing, see the attached image.
What settings/methods do you recommend to lower the Memory Pressure/WeakEvents resulting from SciChart usage?
What is the best rendering method to minimize GC pressure, we only require updates if new data becomes available through our application. Would it be manual?
Please comment
Thank you
- Hendrik Polczynski asked 3 years ago
- last active 3 years ago
Hi,
I am using in my chart a VerticalSliceModifer with a VerticalLineAnnotation.
It works as expected, but I would like to modify the aspect of my VerticalLineAnnotation by adding a marker on the axis on top of the line, exactly as in the attached picture (not a scichart).
Is there a way to do that ?
Best regards,
Jean-Charles Durand
- Jean-Charles DURAND asked 4 years ago
- last active 4 years ago
I have created a composite annotation that consists of four elements: two VerticalLineAnnotations, a BoxAnnotation, and a TextAnnotation. When I first add the annotation, everything appears correctly. However, when I change between tabs in my TabControl… the BoxAnnotation disappears. The box will reappear when I move the composite annotation a few pixels.
Note: Calling ZoomExtents() or InvalidateElement() does not fix the issue.
I’ve created a simple app to reproduce the issue.
PeakAnnotation.xaml
<s:CompositeAnnotation x:Class="WpfPresentation.Views.PeakAnnotation"
                xmlns="http://schemas.microsoft.com/winfx/2006/xaml/presentation"
                xmlns:x="http://schemas.microsoft.com/winfx/2006/xaml"
                xmlns:s="http://schemas.abtsoftware.co.uk/scichart"
                Canvas.ZIndex="1"
                DragDirections="XDirection"
                ResizeDirections="XDirection"
                IsEditable="True">

<s:CompositeAnnotation.Annotations>
    <s:VerticalLineAnnotation CoordinateMode="Relative" Stroke="#FFBADAFF" StrokeThickness="2" X1="0" X2="0" Y1="0" Y2="1"/>
    <s:VerticalLineAnnotation CoordinateMode="Relative" Stroke="#FFBADAFF" StrokeThickness="2" X1="1" X2="1" Y1="0" Y2="1"/>
    <s:BoxAnnotation x:Name="box" Opacity="0.2" CornerRadius="2" Background="#FFBADAFF" BorderBrush="#1964FF" CoordinateMode="Relative" X1="0" X2="1" Y1="0" Y2="1"/>
    <s:TextAnnotation x:Name="AnnotationTextLabel" CoordinateMode="Relative" X1="0" Y1="0.95" FontSize="12" Foreground="White"/>
</s:CompositeAnnotation.Annotations>
PeakAnnotation.xaml.cs
public partial class PeakAnnotation : CompositeAnnotation
{
    public PeakAnnotation()
    {

    }

    public PeakAnnotation(string annotationText)
    {
        InitializeComponent();
        AnnotationTextLabel.Text = annotationText;
    }

    public string StyleKey { get; set; }

    public Type ViewType => throw new NotImplementedException();
}
MainViewModel.cs
public MainViewModel()
    {
        ChartTitle = "Testing";

        Annotations = new AnnotationCollection();

        var myAnnotation = new PeakAnnotation("My Annotation Title")
        {
            X1 = 40,
            X2 = 50,
            Y1 = 0,
            Y2 = 100
        };

        Annotations.Add(myAnnotation);
    }
    public string ChartTitle { get; set; }
    public AnnotationCollection Annotations { get; set; }
}
MainWindow.xaml
<Window x:Class="SciChartTesting.MainWindow"
    xmlns="http://schemas.microsoft.com/winfx/2006/xaml/presentation"
    xmlns:x="http://schemas.microsoft.com/winfx/2006/xaml"
    xmlns:d="http://schemas.microsoft.com/expression/blend/2008"
    xmlns:mc="http://schemas.openxmlformats.org/markup-compatibility/2006"
    xmlns:local="clr-namespace:SciChartTesting" xmlns:s="http://schemas.abtsoftware.co.uk/scichart"
    mc:Ignorable="d"
    Title="MainWindow" Height="450" Width="800">

<Window.Resources>
    <local:MainViewModel x:Key="MainViewModel"/>
</Window.Resources>

<Grid DataContext="{StaticResource MainViewModel}">
    <TabControl>
        <TabItem Header="TabOne">
            <Label Content="This is TabOne"/>
        </TabItem>
        <TabItem Header="TabTwo">
            <s:SciChartSurface ChartTitle="{Binding ChartTitle}" Annotations="{Binding Annotations}">
                <s:SciChartSurface.XAxis>
                    <s:NumericAxis VisibleRange="0,100"/>
                </s:SciChartSurface.XAxis>
                <s:SciChartSurface.YAxis>
                    <s:NumericAxis VisibleRange="0,100"/>
                </s:SciChartSurface.YAxis>
            </s:SciChartSurface>
        </TabItem>
    </TabControl>
</Grid>
- Kyle Williamson asked 4 years ago
- last active 4 years ago
As the title asks, is Unity 3D on the radar?
- Jules LaPrairie asked 6 years ago
- last active 6 years ago
How can i set an interval for milliseconds for a real time graph with Auto scale set as always
- HARISHTEI asked 8 years ago
I’m currently in process of selecting a charting framework. I’ve been evaluating SciChart for some time now and have a few questions.
One of them is how can I automate chart operations: both commands and querying. Do you expose some kind of API for End-To-End tests? I’m specifically interested in this kind of tests.
Thanks?
P.S. Alternatively is there any screenshot-comparing API over the charts? That could be a decisive alternative as well.
- Gennady Verdel asked 7 years ago
- last active 7 years ago
Hi,
Please see the 2 images attached. I would like to reproduce something similar to what’s on the images using scichart ie. being able to select/unselect certain parts of the series by placing a control on certain datapoints (being able to add a checkbox to the surface would be great). What options do I have?
One more question, Is it possible to add a label to LineAnnotations?
Thanks.
- Kilosa Magali asked 7 years ago
- last active 7 years ago
Hello,
I want to implement a custom deltaX cursor in my software. It consists in two vertical lines that can be moved be the user and the idea to get the delta x (DateTime) between the two lines.
I’ve started to implement it by using two custom VerticalLineAnnotation added to a VerticalSliceManager. As my chart is a real time chart, I don’t want my cursors postions changed exepct on user interaction, that’s why I set to Relative the CoordinateMode property of my two Annotations.
The display and the interaction works fine, but when I try to retrieve the actual position of one cursor to compute the delta I have some trouble to convert the relative position to a DateTime value.
I have override the OnDragDelta() method, the relative value of X1 is correct but when I try to convert it into a DateTime by using FromRelativeCoordinate, I still have Date in 1899. I also try to interpret this as OA Date but I still have wrong date.
Do you have an idea ?
Thanks
 public override void OnDragDelta()
    {
        if (_sciChartSurface.XAxis != null)
        {
            double dataValue = (double)this.FromRelativeCoordinate((double)this.X1, _sciChartSurface.XAxis);
            DateTime classic = new DateTime((long)dataValue);
            DateTime fromOa = DateTime.FromOADate(dataValue);
            Debug.WriteLine("CLASSIC "+ classic);
            Debug.WriteLine("OA "+ fromOa);
        }
    }
- Jean-Charles DURAND asked 4 years ago
- last active 4 years ago
Hi!
I have the following code for a vertical slice modifier
    <s:VerticalSliceModifier Name="sliceModifier"
                                             ReceiveHandledEvents="True"
                                             >
                        <s:VerticalSliceModifier.VerticalLines>
                            <s:VerticalLineAnnotation Style="{StaticResource sliceStyle}"
                                                      X1="{Binding ParentViewModel.SliceModifierPosition, Mode=TwoWay}" />
                        </s:VerticalSliceModifier.VerticalLines>

 </s:VerticalSliceModifier>
This results in a nullreference exception. When I remove the VerticalLines, there is no nullreference exception, also no vertical lines.
As far as I can see ParentViewModel.SliceModifierPosition, does not have a value at the time.
I tried setting the visibility of the slicemodifier to collapsed, but it did not help the exception. Is there any to remove the slicemodifier for the time when X1 is not valid (using MVVM and not binding the slicemodifier itself)?
- nullreference exception location
- Abt.Controls.SciChart.ChartModifiers.VerticalSliceModifier.TB()
: Abt.Controls.SciChart.ChartModifiers.VerticalSliceModifier.OnAttached()
: Abt.Controls.SciChart.ChartModifiers.ModifierGroup.TB(IChartModifier C)
: Abt.Controls.SciChart.Common.Extensions.EnumerableExtensions. <a href="IEnumerable1 , Action1″>
: Abt.Controls.SciChart.ChartModifiers.ModifierGroup.TB(IEnumerable`1 C)
- Kristóf Czimer asked 8 years ago
- last active 8 years ago
With fifocapacity(XyDataSeries), memory behaves like an image. (Repeat ups and downs)
Is this due to fifocapacity(XyDataSeries)?
Capture : x = minutes , y = MB
- Daichi Takahashi asked 3 years ago
- last active 3 years ago
Dear all, I am trying to export a heat map that I have generated that you can see at the right side of the attached image. However, the resulting XPS generated is the figure at the left. As one can see they are not very similar as one would expect. I have checked my code, but can’t seem to find the problem. Parts of my code are shown here to give more info. If anyone has tips why this strange result may occur , let me know please.
 <s:SciChartSurface x:Name="sciChart"  ChartTitle="Carbon and DBE">


       <s:SciChartSurface.RenderableSeries>
           <s:FastHeatMapRenderableSeries x:Name="heatmapSeries" Opacity="0.5" Maximum="100">
               <s:FastHeatMapRenderableSeries.ColorMap>
                   <LinearGradientBrush>
                       <GradientStop Offset="0" Color="DarkBlue"/>
                       <GradientStop Offset="0.2" Color="CornflowerBlue"/>
                       <GradientStop Offset="0.4" Color="DarkGreen"/>
                       <GradientStop Offset="0.6" Color="Chartreuse"/>
                       <GradientStop Offset="0.8" Color="Yellow"/>
                       <GradientStop Offset="1" Color="Red"/>
                   </LinearGradientBrush>
               </s:FastHeatMapRenderableSeries.ColorMap>
           </s:FastHeatMapRenderableSeries>

       </s:SciChartSurface.RenderableSeries> .
    </s:SciChartSurface>
and code
    double[,] a = x.Normalized2DArray(100);
                    Heatmap2DArrayDataSeries<double, double, double> heatmap = new Heatmap2DArrayDataSeries<double, double, double>(a, ix => (double)ix * x.binSizeX, iy => (double)iy * x.binSizeY);
                      heatmapSeries.DataSeries = heatmap;
          sciChart.ExportToFile(@"C:\Temp\chart.xps", ExportType.Xps, true, new Size(2000, 2000));
- Michel Bieleveld asked 8 years ago
- last active 8 years ago
HI,
I’m new in scichart. I would like to ask you if it’s possible to build a graph with custom candles.
I want to build a footprint graph, something like this:
http://footprintchart.com/wp-content/uploads/2011/06/Shade_Dominant_Side.png
could you tell me if It’s possible to build this kind of graph and suggest me some links with documentation?
Thank you
- lorenzo522 asked 8 years ago
- last active 8 years ago
Is it possible to show a continuous vertical line as part of Data PointMarker in graph? We have managed to show text labels for our peaks using Data Points and point markers. We have used Sprite to display the TextBlock with peak labels. Now we need to show a vertical line starting from the label text up to the tip of peak. For readability we have kept a vertical space between the data point and the peak label. Hence sometimes it becomes difficult to find which peak points to which peak label. However there is no character to represent a long and continuous line. The OR character shows dotted line. Is there any other control we can use inside the sprite to show as a line?
- Anil Soman asked 3 years ago
Hi,
I am having an issue with the SciChart graphs. I have attached an image – SciChartIssue.png, here which shows the issue. Our SciChart graph contains 8 channels of dataseries for EEG / EMG signals. By default the first channel is selected. When we select/deselect additional channels, they start showing up on the graph accordingly. The issue happens when a channel is de-selected. i.e. when any channel is de-selected, we are clearing that particular channel dataseries, while the other series is being appended and rendered using SuspendUpdates(). But on the graph, the waveform tends to move towards the extreme end of the chart (as seen from the image attached). we were initially using version 5.4 of Scichart. but i later updated it to v6.3, but still have the same issue.
If you are aware or have come across such an issue, then I would appreciate any help or advice from you. Since this is a vast and secure project, I am not able to share the entire code with you at this moment. However, I have attached a xaml & .cs file used to render the graph, If it helps.
Thanks!
- Terrence Joy asked 3 years ago
We are considering using SciChart (WPF), but only if its performance is ‘reasonable’ across Remote Desktop / or via Citrix Server. Have you addressed the known problems of using WPF applications across RDP / Citrix? If so, could you provide some stats as to the performance across RDP?
The reason we are asking is that our current software in which we are using our own high speed rendering is doing fine with a lot of data on the local machine, but is not doing so well across RDP. This is not a huge surprise given the known issues of WPF and RDP (for example see https://stackoverflow.com/a/1005739/246758). We may need to deal with this slowness as more of our customers are using Citrix-servers to run our software.
Any feedback on performance of SciChart across RDP / or using Citrix would be much appreciated!
- gordon slysz asked 5 years ago
- last active 5 years ago
If I set AutoRange = “Always” myHorizontalLineAnnotation draws fine. When I set it to “Never” – which I want – my HorizontalLineAnnotation won’t draw. How do I do this? ty
  <s:SciChartSurface.YAxis>
        <s:NumericAxis AutoRange="Never"
                       VisibleRange="{Binding ElementName=this, Path=YMinMax}"

        <s:HorizontalLineAnnotation HorizontalAlignment="Stretch"
                                    Y1="{Binding ElementName=this, Path=CurrentHigh}"
                                    Stroke="{Binding ElementName=this, Path=ToleranceColor}"
                                    StrokeThickness="1" />
- Paul Richardson asked 7 years ago
- last active 7 years ago
Hi,
I am developing an MVVM WPF application and need to access the SelectedPointMarkers property of DataPointSelectionModifier from the ViewModel.
From looking at the DataPointSelectionModifier documentation (https://www.scichart.com/documentation/win/current/webframe.html#DataPoint%20Selection.html) I can see how you can get the X and Y coordinate values of a selected point in a view, by binding the PointMarkersSelectionModifier to a listbox.
However this doesn’t really help me, I need to get the coordinates of the SelectedPointMarker into a property inside the ViewModel that can be accessed, rather than just binding to a listbox in the view itself.
I’ve also looked at this similar post: (https://www.scichart.com/questions/wpf/i-want-to-bind-selectedpointmarkers-of-datapointselectionmodifier), but I had no luck getting Kenishis solution to work in my case.
How can i do this?
Thanks.
- Sean Connell asked 3 years ago
- last active 3 years ago
Hi, I am currently working with the DataPointSelectionModifier with StackedColumnRenderableSeriesViewModel series. I currently am able to get the data point with the correct values whenever I click on a column but it seems that I am not able to change the selection fill of the column.
All I can seem able to do is changing the color of the whole series, but that is not what I am looking for.
Best Regards.
- Felipe Gonzalez asked 6 years ago
- last active 6 years ago
I have a problem with the alignment of the Minor Grid Line.
As you can see on the ScreenShot, the minor lines are not synchronized with the major line. They are not in the same x-axis position.
How can I do this?
Furthermore, I would like to have a dotted line instead of the dotted line. How can I do this?
How can I define the number of points between the major grids? currently there are 15, but I do not define this, it must be determined internally by the SciChart.
Thank you for your support.
Andreas
- Andreas Köhler asked 6 years ago
- last active 6 years ago
I have a custom chartmodifier I use for highlighting points on mouseover for my 2D plots and I want to create the same functionality for my 3D scatter plot. However, I can’t get it to work;
for the 2D plot I do
var series = ParentSurface.RenderableSeries[0];
var pt = GetPointRelativeTo(e.MousePoint, ModifierSurface);
double dataPointRadius = 8;
var result = series.HitTestProvider.HitTest(pt, dataPointRadius);
However, it seems that 3D plots don’t have a hittestprovider and that it’s not possible to define a radius for the hit test, so the code becomes
var series = ParentSurface.RenderableSeries[0];
var pt = GetPointRelativeTo(e.MousePoint, ModifierSurface);
var result = series.HitTest(pt);
However, result.IsHit is always false. What am I missing?
- Troels Jensen asked 3 years ago
Hi,
I am developing a desktop application using your SciChart WPF v6.5.1.26067 library. Right now, it is used on Windows 10 machines. It is working in all computers except for one. In this computer, we can’t make zoom or click on it to show more data. Could you tell me a reason? The machine system information is:
      Time of this report: 2/17/2022, 17:05:06
      Machine name: PA05009
      Machine Id: {54B0843D-6CE1-4289-A978-A41820074452}
      Operating System: Windows 10 Pro 64-bit (10.0, Build 19042) (19041.vb_release.191206-1406)
      Language: Spanish (Regional Setting: Spanish)
      System Manufacturer: Dell Inc.
      System Model: Vostro 3500
      BIOS: 1.9.0 (type: UEFI)
      Processor: 11th Gen Intel(R) Core(TM) i3-1115G4 @ 3.00GHz (4 CPUs), ~3.0GHz
      Memory: 8192MB RAM
      Available OS Memory: 7914MB RAM
      Page File: 7853MB used, 6461MB available
      Windows Dir: C:\WINDOWS
      DirectX Version: DirectX 12
      DX Setup Parameters: Not found
      User DPI Setting: 120 DPI (125 percent)
      System DPI Setting: 120 DPI (125 percent)
      DWM DPI Scaling: UnKnown
      Miracast: Available, with HDCP
      Microsoft Graphics Hybrid: Not Supported
      DirectX Database Version: 1.0.8
      DxDiag Version: 10.00.19041.0928 64bit Unicode
Thanks,
Harold.
- Harold Ramirez asked 2 years ago
- last active 2 years ago
