I recently needed to change the Rotation Angle of a polar plot from the default to 90 degrees. We have line annotations for different points on the polar plot. After the change, the annotation was still plotted on the default Rotation Angle.
I manually updated the points like this for the annotations to work:
var line = new LineAnnotation();

                var x1 = (double)NewSeries.DataSeries.XValues[0];
                var x2 = (double)NewSeries.DataSeries.XValues[1];

                if (x1.Between(0, 90) && x2.Between(0, 90))
                {
                    x1 += 270;
                    x2 += 270;
                }
                else
                {
                    x1 -= 90;
                    x2 -= 90;
                }

                line.X1 = x1;
                line.X2 = x2;
Is there another way to update the annotation or is something like this the preferred way?
- Bart Terrell asked 5 years ago
- last active 4 years ago
Hello,
we are building an application where Charts are created/placed by the user in a form of editor.
We observed that the creation of the first Chart takes between 1 to 3 seconds (depending on the system) but the creation of subsequent Charts takes virtually no time (as it should be).
We assume that the creation of the first Chart involves some kind of time consuming initialization that is later used in the creation of subsequent Charts.
So we have researched if there is a way to do this initialization at the start of our application, so the user is not inconvenienced by a three second waiting time while placing the first Chart.
We discovered the “LoadLibrariesAndLicenseAsync”-function. However, it looks like it has no measurable effect.
Maybe we are using it wrong?
Here is an example code to illustrate the problem in a condensed manner:
Two charts are created and each time the time it takes to create them is measured.
The first creation takes about 1600 milliseconds, the second one only 2.
How can we make both creations only take a few milliseconds?
Thank you.
        // SciChartSurface.SetRuntimeLicenseKey("our key");

         await SciChart.Charting.Visuals.SciChart2DInitializer.LoadLibrariesAndLicenseAsync(
           "our key",
            null); //...does not seem to work

        Stopwatch sw = new Stopwatch();
        sw.Restart();//start stopwatch

        //creating the first Scichart with test data:

        SciChartSurface sciChartSurface = new SciChartSurface();

        XyDataSeries<double, double> xyDataSeries = new XyDataSeries<double, double>();
        xyDataSeries.AcceptsUnsortedData = true;
        FastLineRenderableSeries fastLineRenderableSeries = new FastLineRenderableSeries();
        fastLineRenderableSeries.DataSeries = xyDataSeries;
        sciChartSurface.RenderableSeries.Add(fastLineRenderableSeries);

        NumericAxis m_xAxis = new NumericAxis();
        NumericAxis m_yAxis = new NumericAxis();
        m_yAxis.AutoRange = AutoRange.Always;
        sciChartSurface.XAxis = m_xAxis;
        sciChartSurface.YAxis = m_yAxis;

        using (xyDataSeries.SuspendUpdates())
        {
            for (int i = 0; i < 100; i++)
                xyDataSeries.Append(i, Math.Sin(i));
        }

        Screen.Children.Add(sciChartSurface);//add first Scichart to grid
        sciChartSurface.Margin = new Thickness(0, 0, 500, 0);

        MessageBox.Show("time: "+sw.ElapsedMilliseconds); //////////  1610 Mlliseconds
        sw.Restart();//restart stopwatch

        //creating the second Scichart with test data:

        SciChartSurface sciChartSurface2 = new SciChartSurface();

        XyDataSeries<double, double> xyDataSeries2 = new XyDataSeries<double, double>();
        xyDataSeries2.AcceptsUnsortedData = true;
        FastLineRenderableSeries fastLineRenderableSeries2 = new FastLineRenderableSeries();
        fastLineRenderableSeries2.DataSeries = xyDataSeries2;
        sciChartSurface2.RenderableSeries.Add(fastLineRenderableSeries2);

        NumericAxis m_xAxis2 = new NumericAxis();
        NumericAxis m_yAxis2 = new NumericAxis();
        m_yAxis2.AutoRange = AutoRange.Always;
        sciChartSurface2.XAxis = m_xAxis2;
        sciChartSurface2.YAxis = m_yAxis2;

        using (xyDataSeries2.SuspendUpdates())
        {
            for (int i = 0; i < 100; i++)
                xyDataSeries2.Append(i, Math.Sin(i));
        }

        Screen.Children.Add(sciChartSurface2);//add second Scichart to grid
        sciChartSurface2.Margin = new Thickness(500, 0, 0, 0);

        MessageBox.Show("time: "+sw.ElapsedMilliseconds); //////////////////////////// 2 Mlliseconds
- Marc Vahldieck asked 1 year ago
- last active 1 year ago
When using an ObservableCollection of IAnnotationViewModel for Annotations I can add Custom annotations (using CustomAnnotationForMvvm) but not been able to use CompositeAnnotationForMvvm in my view.
I have seen the MeasureXAnnotation example in SciChart_CompositeAnnotations but that is not using mvvm pattern.
MyCompositeAnnotation View
    <s:CompositeAnnotationForMvvm x:Class="MyCompositeAnnotation"
s:CompositeAnnotationForMvvm.Annotations>
    <s:LineAnnotationForMvvm X1="0.5"
                           X2="0"
                           Y1="0.5"
                           Y2="0.5"
                           CoordinateMode = "Relative"
                           DragDirections = "XYDirection"
                           ResizeDirections = "XDirection"
                           StrokeThickness = "1"
                           Stroke ="White"
                           IsEditable = "False"/>
MyCompositeAnnotation view Behind code
  public partial class MyCompositeAnnotation : CompositeAnnotationForMvvm
    {
        public MyCompositeAnnotation()
        {
            this.InitializeComponent();
        }
}
MyCompositeAnnotation ViewModel
public class MyCompositeAnnotationViewModel : CompositeAnnotationViewModel
{
    public override Type ViewType => typeof(MyCompositeAnnotation);
}
Main View Model
public ObservableCollection<IAnnotationViewModel> Annotations { get; set; } = new ObservableCollection<IAnnotationViewModel>();

private void OnAddAnnotation()
        {
            var min = ((TimeSpan)this.sourceRange.Min).Ticks;

            this.Annotations.Add(new MyCompositeAnnotationViewModel ()
            {
            X1 = min + ((TimeSpan)this.sourceRange.Diff).Ticks * 0.1,
            X2 = min + ((TimeSpan)this.sourceRange.Diff).Ticks * 0.3,
            Y1 = 0.1,
            Y2 = 0.3,
            CoordinateMode = AnnotationCoordinateMode.Absolute,
            DragDirections = XyDirection.XYDirection,
            ResizeDirections = XyDirection.XYDirection,
            //                StyleKey = "LineArrowAnnotationStyle",
            IsEditable = true
        });
Do I need to set the style so the annotation are hooked up correctly? I tried this but it did not work:
 <Style BasedOn="{StaticResource MvvmCompositeAnnotationStyle}"   TargetType="{x:Type annotations:MyCompositeAnnotationViewModel}">
   <Setter Property="s:CompositeAnnotation.Annotations" Value="{s:AnnotationsBinding Annotations}"/>
                                            </Style>
- Chris Morris asked 3 months ago
- last active 3 months ago
Dear all, I am trying to export a heat map that I have generated that you can see at the right side of the attached image. However, the resulting XPS generated is the figure at the left. As one can see they are not very similar as one would expect. I have checked my code, but can’t seem to find the problem. Parts of my code are shown here to give more info. If anyone has tips why this strange result may occur , let me know please.
 <s:SciChartSurface x:Name="sciChart"  ChartTitle="Carbon and DBE">


       <s:SciChartSurface.RenderableSeries>
           <s:FastHeatMapRenderableSeries x:Name="heatmapSeries" Opacity="0.5" Maximum="100">
               <s:FastHeatMapRenderableSeries.ColorMap>
                   <LinearGradientBrush>
                       <GradientStop Offset="0" Color="DarkBlue"/>
                       <GradientStop Offset="0.2" Color="CornflowerBlue"/>
                       <GradientStop Offset="0.4" Color="DarkGreen"/>
                       <GradientStop Offset="0.6" Color="Chartreuse"/>
                       <GradientStop Offset="0.8" Color="Yellow"/>
                       <GradientStop Offset="1" Color="Red"/>
                   </LinearGradientBrush>
               </s:FastHeatMapRenderableSeries.ColorMap>
           </s:FastHeatMapRenderableSeries>

       </s:SciChartSurface.RenderableSeries> .
    </s:SciChartSurface>
and code
    double[,] a = x.Normalized2DArray(100);
                    Heatmap2DArrayDataSeries<double, double, double> heatmap = new Heatmap2DArrayDataSeries<double, double, double>(a, ix => (double)ix * x.binSizeX, iy => (double)iy * x.binSizeY);
                      heatmapSeries.DataSeries = heatmap;
          sciChart.ExportToFile(@"C:\Temp\chart.xps", ExportType.Xps, true, new Size(2000, 2000));
- Michel Bieleveld asked 8 years ago
- last active 8 years ago
Running off of visual studio 2017. Slightly changed one of the line examples. Here is my source code.
// *************************************************************************************
// SCICHART® Copyright SciChart Ltd. 2011-2017. All rights reserved.
//
// Web: http://www.scichart.com
// Support: [email protected]
// Sales: [email protected]
//
// LineChartExampleView.xaml.cs is part of the SCICHART® Examples. Permission is hereby granted
// to modify, create derivative works, distribute and publish any part of this source
// code whether for commercial, private or personal use.
//
// The SCICHART® examples are distributed in the hope that they will be useful, but
// without any warranty. It is provided “AS IS” without warranty of any kind, either
// expressed or implied.
// *************************************************************************************
using System;
using System.Collections.Generic;
using System.Collections.ObjectModel;
using System.ComponentModel;
using System.Globalization;
using System.Linq;
using System.Windows;
using System.Windows.Controls;
using System.Windows.Data;
using System.Windows.Media;
using SciChart.Charting.Model.DataSeries;
using SciChart.Charting.Visuals.RenderableSeries;
using SciChart.Data.Model;
using SciChart.Examples.ExternalDependencies.Data;
using SciChart.Charting;
namespace SciChart.Examples.Examples.CreateSimpleChart
{
public partial class LineChartExampleView : UserControl
{
public LineChartExampleView()
{
InitializeComponent();
    }

    private void LineChartExampleView_OnLoaded(object sender, RoutedEventArgs e)
    {
        // Create a DataSeries of type X=double, Y=double
        var dataSeries = new XyDataSeries<double, double>();

        lineRenderSeries.DataSeries = dataSeries;

        var data = DataManager.Instance.GetFourierSeries(1.0, 0.1);

        // Append data to series. SciChart automatically redraws
        ThemeManager.SetTheme(this, "Chrome");
        dataSeries.Append(data.XData, data.YData);

        sciChart.ZoomExtents();
    }

    private void Button_Click(object sender, RoutedEventArgs e)
    {
        Clipboard.SetImage(this.sciChart.ExportToBitmapSource());
    }
}
}
And the xaml
<UserControl.Resources>
    <ResourceDictionary>
    </ResourceDictionary>
</UserControl.Resources>

<Grid>
    <Grid.ColumnDefinitions>
        <ColumnDefinition Width="Auto" />
        <ColumnDefinition Width="*" />
    </Grid.ColumnDefinitions>

    <!--  The SciChartInteractionToolbar adds zoom, pan, zoom extents and rotate functionality  -->
    <!--  to the chart and is included for example purposes.  -->
    <!--  If you wish to know how to zoom and pan a chart then do a search for Zoom Pan in the Examples suite!  -->
    <Button Foreground="AntiqueWhite"  Visibility="Visible" Click="Button_Click" MinWidth="100" MinHeight="40">COPY</Button>


    <!--  Create the chart surface  -->
    <s:SciChartSurface Name="sciChart"
                       Grid.Column="1">

        <!--  Declare RenderableSeries  -->
        <s:SciChartSurface.RenderableSeries>
            <s:FastLineRenderableSeries x:Name="lineRenderSeries"
                                        Stroke="#FF99EE99"
                                        StrokeThickness="2"/>
        </s:SciChartSurface.RenderableSeries>

        <!--  Create an X Axis with Growby  -->
        <s:SciChartSurface.XAxis>
            <s:NumericAxis DrawMajorBands="True"
                           FlipCoordinates="True"
                           GrowBy="0.1, 0.1"
                           ScientificNotation="None"
                           TextFormatting="#.############" />
        </s:SciChartSurface.XAxis>

        <!--  Create a Y Axis with Growby. Optional bands give a cool look and feel for minimal performance impact  -->
        <s:SciChartSurface.YAxis>
            <s:NumericAxis DrawMajorBands="True" GrowBy="0.5, 0.5" />
        </s:SciChartSurface.YAxis>

    </s:SciChartSurface>
</Grid>
All I did was remove the toolbar and a dd a button that copied the image to the clipboard. Yet Somehow the result of what you see while running and what you get from the clipboard are not the same. The lower half of the image you get by rendering to memory is clearly darker. I tried uploading them but could not.
- Jean Francois Valero Hernandez asked 6 years ago
- last active 6 years ago
I’m overriding FastLineRenderableSeries so I can do some custom rendering.
I have a data series defined as :
 var xyDataSeries = new XyDataSeries<double>();
            xyDataSeries.Append(0, 0);
            xyDataSeries.Append(1, 1);
Test.DataSeries = xyDataSeries;
and my chart as :
<s:SciChartSurface Loaded="SciChartSurface_Loaded">
        <s:SciChartSurface.RenderableSeries>
            <customSeriesMvvmExample:FastLineRenderableSeriesEx x:Name="Test" />
        </s:SciChartSurface.RenderableSeries>
        <s:SciChartSurface.XAxis>
            <s:NumericAxis/>
        </s:SciChartSurface.XAxis>
        <s:SciChartSurface.YAxis>
            <s:NumericAxis/>
        </s:SciChartSurface.YAxis>
    </s:SciChartSurface>
And then I override InternalDraw :
public class FastLineRenderableSeriesEx : FastLineRenderableSeries
{
    protected override void InternalDraw(IRenderContext2D renderContext, IRenderPassData renderPassData)
    {
        base.InternalDraw(renderContext, renderPassData);

        using (var brush = renderContext.CreateBrush(Colors.Transparent))
        using (var pen = renderContext.CreatePen(Stroke, true, StrokeThickness, Opacity))
        {

            var xCalc = renderPassData.XCoordinateCalculator;
            var yCalc = renderPassData.YCoordinateCalculator;

            var xCoord = xCalc.GetCoordinate(0.5);
            var yCoord = yCalc.GetCoordinate(0.5);

            renderContext.DrawEllipse(pen, brush, new System.Windows.Point(xCoord, yCoord), 150, 150);

            renderContext.DrawLine(pen,
                new System.Windows.Point(xCalc.GetCoordinate(0.6), yCalc.GetCoordinate(0)),
                new System.Windows.Point(xCalc.GetCoordinate(2), yCalc.GetCoordinate(1.4)));
        }
    }
}
The problem is that the base.InternalDraw draws the original data series line very nicely with anti-aliasing, but the custom circle I draw has no AA, and the custom line I draw looks very thin?
what’s going on here?
- forl forl asked 11 months ago
- last active 11 months ago
Has anyone encountered this before?
XamlParseException: Unexpected record in Baml stream. Trying to add to SciChartSurface which is not a collection or has a TypeConverter.
<DataTemplate x:Key="SciLineChartTemplate"><Grid><s:SciChartSurface ...
- Christopher McCowan asked 5 years ago
- last active 5 years ago
Hi, I’m struggling to reduce times for loading draw (5,000Series x 5,000points) x 10 charts
which is in Scichart example ‘Load 500Seriesx500points’.
-
Present, Loading (5,000Series x 5,000points) x 10 charts consumes about 1 minutes.
How can i load and draw this more faster? -
And While in loading, how can i generate and show a Progress bar?
- Hyunji Jeon asked 11 months ago
- last active 10 months ago
Sorry. My English is not good.
I have to mapping “Connector” image to 3D Cylindroid Chart.
But I do not know how.
Please let me know
- YOUNG MIN KO asked 2 years ago
- last active 2 years ago
This is my first time in this forum, and I am analyzing SCIChart. I am planning to use it in my software, but there are some questions I haven’t been able to answer yet.
My software is similar to an IDE, where the user can build their custom applications and run on windows environment, but we also provide an option to save all the interface in html and javascript. Since SCIChart provides not only WPF Charts but also javascript Charts, I would like to know the following:
1- Does the javascript charts have the same functionalities as the wpf charts? XY Charts or Pie charts for example, will they have the same functionalities in WPF and Javascript ?
2- Does the appearence of the charts in WPF and Javascript are the same? Do they look exatcly the same?
I believe these are my biggest doubts so far. Thanks in advance !!
- Fabio Pereira de Carvalho asked 1 year ago
- last active 1 year ago
I have just finished my first pass evaluation of the SciChart performance. When drawing a lesser number of points (<100000), SciChart outperforms two other packages I have evaluated. However, when drawing more points (200,000 – 2,000,000), SciChart does not meet the performance of the other packages.
The evaluation involved selecting a different number of lines and number of points per line. The transition to worse performance occurred in the following setups:
Line Count Points/Line Loop Count Total Time (ms)
2 100,000 25 1890
5 100,000 25 4670
2 1,000,000 10 7400
2 10,000,000 10 74000
These setups average out to about 0.37 usec per point. This is where the other packages outperformed SciChart, as their per point times kept improving.
I have tried to follow all of the performance tips I found on your website. I have included the code used to evaluate SciChart and would appreciate any help in improving the results.
Thanks,
Dave
- Dave Leach asked 8 years ago
- last active 8 years ago
Hi!
I’ve tried to access the values to print them in a different view, but I cant reach them. So my question is there a specific way to reach them?
- Robin Bergqvist asked 5 years ago
- last active 5 years ago
On a small PC with only Intel HD Graphics 4600 the DirectX rendering is not supported by SciChart. Thats fine but it should use the fallback render surface.
<s:SciChartSurface
  RenderPriority ="Low"
  s:VisualXcceleratorEngine.IsEnabled="True"
  s:VisualXcceleratorEngine.FallbackType="{x:Type s:HighQualityRenderSurface}"
  s:VisualXcceleratorEngine.DowngradeWithoutException="True"
  s:VisualXcceleratorEngine.EnableImpossibleMode="True"
  s:PerformanceHelper.EnableExtremeDrawingManager="True"
  s:PerformanceHelper.EnableExtremeResamplers="True"
I got this exception:
    System.Exception: Your GPU is blacklisted for use by the Visual Xccelerator Engine! There are several reasons why a GPU could belong to the blacklist. For example, low computation capabilities of the GPU could cause Timeout Detection and Recovery of Graphics Adapter Drivers by the OS, resulting in crashing the application.
   at SciChart.Charting.VisualXcceleratorEngine.ivc(DependencyObject t, DependencyPropertyChangedEventArgs u)
   at System.Windows.DependencyObject.OnPropertyChanged(DependencyPropertyChangedEventArgs e)
   at System.Windows.FrameworkElement.OnPropertyChanged(DependencyPropertyChangedEventArgs e)
   at System.Windows.DependencyObject.NotifyPropertyChange(DependencyPropertyChangedEventArgs args)
   at System.Windows.DependencyObject.UpdateEffectiveValue(EntryIndex entryIndex, DependencyProperty dp, PropertyMetadata metadata, EffectiveValueEntry oldEntry, EffectiveValueEntry& newEntry, Boolean coerceWithDeferredReference, Boolean coerceWithCurrentValue, OperationType operationType)
   at System.Windows.DependencyObject.SetValueCommon(DependencyProperty dp, Object value, PropertyMetadata metadata, Boolean coerceWithDeferredReference, Boolean coerceWithCurrentValue, OperationType operationType, Boolean isInternal)
   at System.Windows.DependencyObject.SetValue(DependencyProperty dp, Object value)
But it should use HighQualityRenderSurface without any exception.
- Tobias asked 4 years ago
- last active 4 years ago
Hi Team,
I am getting the error message Sorry! your trail of schichart has expired message is coming on the end user PC through we have purchased the developer license and activating the schichart using the runtime key provided in my account. Gone through the steps provided in here .
Also checked if there are any spaces in the license key. FYI, my developer license is expired and using the v5.4 with nuget.
- PRADNYA NAIKWADI asked 2 years ago
- last active 2 years ago
I am considering applying server-side licensing for my javerScript application.
In the document below, there is a phrase “Our server-side licensing component is written in C++.”
(https://support.scichart.com/index.php?/Knowledgebase/Article/View/17256/42/)
However, there is only asp.net sample code on the provided github.
(https://github.com/ABTSoftware/SciChart.JS.Examples/tree/master/Sandbox/demo-dotnet-server-licensing)
I wonder if there is a sample code implemented in C++ for server-side licensing.
Can you provide c++ sample code?
Also, are there any examples to run on Ubuntu?
- John Flemmer asked 2 years ago
- last active 1 week ago
We’re working on a Nyquist plot using the latest SciChart SDK for WPF.
We have quite a MVVM dependent structure already in place.
We are working with 3D frequency based Complex data. The Nyquist plot would have 2 axes – Y for Imaginary values and X axis for Real values. We apply some averaging and post-processing of the 3D data to put in 2D form and show it in the Nyquist plot.
However, we’d like to be able to scroll the data at certain frequency ranges without showing the actual frequency graph in the plot. Is there a possibility to implement an independent scrollbar containing a averaged magnitude graph (similar idea to the processing of the Nyquist data) over a frequency range? We’d like to scroll this frequency range and on selected range changed to recalculate data in the Nyquist plot.
We have quite an extensive graphing structure implemented already. The main issue I’m currently facing is that the scrollbar is bound to the SciChartSurface and I cannot seem to figure out how to build it more like a “sexy” frequency range selector while staying within the SciChart library? Is there any possibility to not be bound to the SciChartSurface? And of course, the axes are quite different – in the Nyquist we have linear real and imaginary values (-2 to +2, for example) whereas the frequency range would extend much further data-wise (0 – 3000 Hz, for example).
Any help would be appreciated. Feel free to ask for more details.
- Kaloyan Krastev asked 10 months ago
- last active 2 months ago
Hi All!
I have a syncfusion theme (MaterialDark) applied to my WPF app.
Without the theme applied, I can set the background color of a TextAnnotaion in the normal way in bothe XAML and c#, no problem.
When I apply the theme, it overrides this setting and renders the TextAnnotation with a black background and no matter what I try, I
can’t seem to get rid of it.
I have tried:
-
setting up a Resource dictionary in XAML
-
setting the style to null and then applying inline style (in both code behind and XAML)
Nothing seems to work!
Has anyone encountered this issue beforew or know of any solutions?
It’s driving me mad!
- Scott Green asked 1 year ago
- last active 1 year ago
Hello SciChart Team,
I have multiple charts in my application where all the charts are in the same MdofierGroup to show the RolloverModifier tooltip at the same time. As I want to show custom tooltip text, I have created a custom TooltipTemplate and TooltipContainerStyle. But now when the tooltip is shown on the left side the tooltip text is a long way from the marker. I want to align the tooltip text based on the tooltip position. When the tooltip is on the right side the text will be aligned left and when the tooltip is on left side the text will be aligned right.
I have attached some code snippets of my implementations, can you suggest me any way to achieve this?
<Style x:Key="_tooltipContainer" TargetType="scichart:TooltipControl">
        <Setter Property="Template">
            <Setter.Value>
                <ControlTemplate TargetType="scichart:TooltipControl">
                    <ContentPresenter Content="{TemplateBinding DataContext}"
                                          ContentTemplate="{TemplateBinding ContentTemplate}" />
                </ControlTemplate>
            </Setter.Value>
        </Setter>
    </Style>

    <DataTemplate x:Key="_tooltipTemplate" DataType="scichart:XySeriesInfo">
        <StackPanel Orientation="Vertical">
            <TextBlock FontSize="12" FontFamily="Rubik" Foreground="White">
                <TextBlock.Text>
                    .
                    .
                    .
                </TextBlock.Text>
            </TextBlock>
        </StackPanel>
    </DataTemplate>

    <!-- Style applied via x:Key name in ViewModel -->
    <Style TargetType="scichart:BaseRenderableSeries"  x:Key="_lineSeriesStyle">
        <Setter Property="RolloverMarkerTemplate">
            <Setter.Value>
                <ControlTemplate>
                    <Ellipse Width="7" Height="7" Stroke="White" StrokeThickness="1" />
                </ControlTemplate>
            </Setter.Value>
        </Setter>

        <Setter Property="scichart:RolloverModifier.TooltipContainerStyle" Value="{StaticResource _tooltipContainer}"/>
        <Setter Property="scichart:RolloverModifier.TooltipTemplate" Value="{StaticResource _tooltipTemplate}"/>
        <Setter Property="scichart:RolloverModifier.IncludeSeries" Value="True"/>
        <Setter Property="StrokeThickness" Value="2"/>
    </Style>


 <scichart:SciChartSurface RenderableSeries="{scichart:SeriesBinding ItsRenderableTimeGraphSeries}">


                                    <scichart:SciChartSurface.ChartModifier>
                                        <scichart:ModifierGroup DataContext="{Binding Path=DataContext, RelativeSource={RelativeSource FindAncestor, AncestorType={x:Type ItemsControl}}}"
                                                            scichart:MouseManager.MouseEventGroup="MouseEventGroup" >
                                            <scichart:RolloverModifier ShowTooltipOn="MouseHover" DrawVerticalLine="False" />
                                        </scichart:ModifierGroup>
                                    </scichart:SciChartSurface.ChartModifier>
.
.
.
</scichart:SciChartSurface>
In ViewModel:
ItsRenderableTimeGraphSeries = new ObservableCollection<IRenderableSeriesViewModel>
        {
            new MountainRenderableSeriesViewModel()
            {
                IsDigitalLine = false,
                StyleKey = "_lineSeriesStyle",
            }
        };
- Habibur Rahman asked 2 years ago
- last active 2 years ago
Hello,
Is there a corresponding Documentation for the 3D Chart like this one for 2D Charts: https://www.scichart.com/example/wpf-chart-example-series-with-metadata/
What I am trying to do is to make some PointMarkers of the ScatterRenderableSeries3DViewModel in the 3D Chart bigger depending on the PointMetadata3D.
For 2D Charts I could accomplish that with the Documentation mentioned above. Now I want to do the same for 3D Charts.
Can someone give me a hint how to do that?
- Nick Müller asked 4 years ago
- last active 4 years ago
Hi!
I have the following code for a vertical slice modifier
    <s:VerticalSliceModifier Name="sliceModifier"
                                             ReceiveHandledEvents="True"
                                             >
                        <s:VerticalSliceModifier.VerticalLines>
                            <s:VerticalLineAnnotation Style="{StaticResource sliceStyle}"
                                                      X1="{Binding ParentViewModel.SliceModifierPosition, Mode=TwoWay}" />
                        </s:VerticalSliceModifier.VerticalLines>

 </s:VerticalSliceModifier>
This results in a nullreference exception. When I remove the VerticalLines, there is no nullreference exception, also no vertical lines.
As far as I can see ParentViewModel.SliceModifierPosition, does not have a value at the time.
I tried setting the visibility of the slicemodifier to collapsed, but it did not help the exception. Is there any to remove the slicemodifier for the time when X1 is not valid (using MVVM and not binding the slicemodifier itself)?
- nullreference exception location
- Abt.Controls.SciChart.ChartModifiers.VerticalSliceModifier.TB()
: Abt.Controls.SciChart.ChartModifiers.VerticalSliceModifier.OnAttached()
: Abt.Controls.SciChart.ChartModifiers.ModifierGroup.TB(IChartModifier C)
: Abt.Controls.SciChart.Common.Extensions.EnumerableExtensions. <a href="IEnumerable1 , Action1″>
: Abt.Controls.SciChart.ChartModifiers.ModifierGroup.TB(IEnumerable`1 C)
- Kristóf Czimer asked 8 years ago
- last active 8 years ago
Is there a way to apply functionalities on signals as in average, slope, etc. ?
Thank you
Anders
- Anders Persson asked 2 years ago
- last active 2 years ago
The format of the set DateTimeAxis x-axis is (“yyyy-MM-dd hh:mm:ss”), but when the chart is enlarged, if the range is short, it changes to (“hh:mm:ss”). I want to display year/month/day information as well, even if the range is short. Please answer with the MVVM model.
- Lee Ji Un asked 6 months ago
- last active 6 months ago
I’m trying to render Histograms at runtime where the bins’ information like upper and lower bounds and width are known. However when I set the DataPointWidth to 0.2 for example, the bin spacing is different. Here is my code and XAML:
        // We can create a histogram with evenly spaced bins
        // by specifying the lower bound, the upper bound,
        // and the number of bins:
        var histogram = Histogram.CreateEmpty(values.Min(), values.Max(), numberOfBins);
        double width = (values.Max() - values.Min()) / numberOfBins;
        histogram.Tabulate(values);

        foreach (var bin in histogram.BinsAndValues)
        {
            XyDataSeries<double, double> dataSeries = new XyDataSeries<double, double>();
            dataSeries.Append(bin.Key.LowerBound, bin.Value);
            pointList.Add(new ColumnRenderableSeriesViewModel() { DataSeries = dataSeries, StrokeThickness = 2, Stroke = Colors.Gray, Fill = Brushes.CornflowerBlue, DataPointWidth = 0.2 });
        }

        ChartData = new ObservableCollection<IRenderableSeriesViewModel>(pointList);

        <Style x:Key="BaseColumnStyle" TargetType="s:FastColumnRenderableSeries">
        <Setter Property="Opacity" Value="0.3"/>
        <Setter Property="StrokeThickness" Value="2"/>
    </Style>

    <Style x:Key="BlueColumnStyle" BasedOn="{StaticResource BaseColumnStyle}" TargetType="s:FastColumnRenderableSeries">
        <Setter Property="Fill" Value="CornflowerBlue"/>
    </Style>
    <!--  Define styles for the SciChartSurface  -->
    <Style x:Key="SciChartSurfaceStyle" TargetType="s:SciChartSurface">
        <Setter Property="Background" Value="White"/>
        <Setter Property="Padding" Value="20"/>
        <Setter Property="Foreground" Value="Black"/>
        <Setter Property="FontSize" Value="20"/>
        <Setter Property="FontFamily" Value="Arial Black"/>
        <Setter Property="FontWeight" Value="Bold"/>
    </Style>

    <!--  Define styles for the GridLinesPanel  -->
    <Style x:Key="GridLinesPanelStyle" TargetType="s:GridLinesPanel">
        <Setter Property="Background" Value="White"/>
        <Setter Property="BorderThickness" Value="1"/>
        <Setter Property="BorderBrush" Value="Black"/>
    </Style>

    <!--  Using the LayoutTransform is much more apropriate in this point  -->
    <!--  the RenderTransform is used for demonstration purposes only,  -->
    <!--  for the compatibility with Silverlight reasons  -->
    <Style x:Key="AxisLabelStyle" TargetType="s:DefaultTickLabel">
        <!--<Setter Property="RenderTransform">
            <Setter.Value>
                <RotateTransform Angle="-15"/>
            </Setter.Value>
        </Setter>-->
        <Setter Property="Margin" Value="0"/>
    </Style>

    <!--  Define styles for the X and Y Axes  -->
    <Style x:Key="AxisStyle" TargetType="s:AxisBase">
        <Setter Property="FontSize" Value="18"/>
        <Setter Property="FontWeight" Value="Normal"/>
        <Setter Property="FontFamily" Value="Arial"/>
        <Setter Property="TitleFontSize" Value="12"/>
        <Setter Property="TitleFontWeight" Value="Bold"/>
        <Setter Property="TickTextBrush" Value="Black"/>
        <Setter Property="DrawMajorBands" Value="False"/>
        <Setter Property="DrawMinorGridLines" Value="False"/>
        <Setter Property="DrawMinorTicks" Value="False" />
        <Setter Property="DrawMajorTicks" Value="False"/>
        <Setter Property="TickLabelStyle" Value="{StaticResource AxisLabelStyle}"/>
        <Setter Property="MajorGridLineStyle">
            <Setter.Value>
                <Style TargetType="Line">
                    <Setter Property="Stroke" Value="LightGray"/>
                    <Setter Property="StrokeThickness" Value="1"/>
                </Style>
            </Setter.Value>
        </Setter>
    </Style>
</UserControl.Resources>
<Grid>
    <s:SciChartSurface x:Name="histogram" ChartTitle="{Binding ChartTitle}" RenderableSeries="{s:SeriesBinding ChartData}"
                       Style="{StaticResource SciChartSurfaceStyle}" GridLinesPanelStyle="{StaticResource GridLinesPanelStyle}">
        <s:SciChartSurface.XAxis>
            <s:NumericAxis AxisTitle="{Binding XAxisTitle}" Style="{StaticResource AxisStyle}" AutoRange="Always"/>
        </s:SciChartSurface.XAxis>
        <s:SciChartSurface.YAxis>
            <s:NumericAxis AxisTitle="{Binding YAxisTitle}" AxisAlignment="Left" Style="{StaticResource AxisStyle}"/>
        </s:SciChartSurface.YAxis>
    </s:SciChartSurface>
</Grid>
How can I make the bin spacing the same independent of bin width? See my attachment of two different histograms with the DataPointWidth for each.
- Dave Frey asked 7 years ago
- last active 7 years ago
Hello SciChart-Team,
we had the requirement to show the zero line when there are negative values in the chart.
We noticed the following things, especially in connection with the main grid lines.
There are some side effects at certain sizes of the window:
When the gridlines are on(see screenshot 1):
1. Grid line and tick are not on the same level (Only for certain sizes)
2. The grid line and horizontal annotation line (green) are not aligned either (Only at certain sizes)
3. The axis line (defined via BorderThickness) is also not aligned with the grid line (regardless of the size of the control).And the bottom tick is never aligned with the major grid line
If the major grid lines are switched off, the zero annotation line is not aligned to the ticks for certain sizes of the control (see screenshot 2)
It looks like different algorithms were used to calculate the line position of the ticks, grid lines and line annotations.
The problem was detected on the monitor with 100% scaling. On a 4K monitor with scaling > 100%, the problem became even more apparent
Do you have any suggestion how to solve the problem?
I’ve attached a modified example project in which the behavior can be reproduced.
Regards
Silvester Schneidt
- Silvester Schneidt asked 2 years ago
- last active 6 months ago
HI,
I’m new in scichart. I would like to ask you if it’s possible to build a graph with custom candles.
I want to build a footprint graph, something like this:
http://footprintchart.com/wp-content/uploads/2011/06/Shade_Dominant_Side.png
could you tell me if It’s possible to build this kind of graph and suggest me some links with documentation?
Thank you
- lorenzo522 asked 8 years ago
- last active 8 years ago
Hello support team,
We have to realize the following request:
– Yt chart with DateTime as X-axis and double values on the Y-axis
– The chart should display a user-defined area on startup (e.g. 20 sec) After the chart has run for 20 seconds ( i.e. 20 seconds), the animated scrolling should start. By default, the chart behaves as follows: The X-axis area fills up to 20 seconds and then starts scrolling. We want the chart to display 20 seconds on the X-axis at the start and fill up.
I am aware that I can implement this behavior myself. However, the question arises whether I can realize this directly with a basic functionality.
Thank you!
- Andreas Köhler asked 6 years ago
- last active 6 years ago
I wanted to experiment with adding a tooltip to the SciChart_ScatterChartPerformanceDemo.
I extended the xaml with
 <s:SciChartSurface.ChartModifier>
            <s:ModifierGroup>
                <s:MouseWheelZoomModifier/>
                <s:TooltipModifier />
            </s:ModifierGroup>
        </s:SciChartSurface.ChartModifier>
However, I have noticed that the tooltip doesn’t seem to react properly to the geometry under the cursor. The tooltip will often show up when the cursor is outside the geometry.
If you use a SquarePointMarker with a width and height of 25, the tooltip pops up even when you’re a fair distance away from the geometry.
The hit detection doesn’t appear to be working correctly?
Edit : Also, it appears I am unable to answer questions here, when I add an answer, it accepts it, but doesn’t show anything?
- forl forl asked 11 months ago
- last active 10 months ago
Hello all,
I was trying to export my SciChartSurface to bitmap, to save in a pdf.
First I tried ExportToBitmapSource(true/false, wantedSize) method. It leaded to StackOverflowException.
Then I tried to set explicitly the Height and Width and call the parameterless ExportToBitmapSource() method. It works fine, saves fine, but for a second I see the modified Height and Width and axes.
I tried them sync and async calls too.
Have you ever met these kind of functioning, or is the failure in me?
On my SciChart almost everything has predefined Style. Maybe that’s why the ExportToBitmapSource(true/false, wantedSize) dies while cloning the chart inside?
- László Jancsó asked 2 years ago
- last active 2 years ago
Good day,
we are using the VerticalSliceModifier for sorted data and it works very good.
<local:VerticalSliceModifierExt x:Name="SliceModifier">
<s:VerticalSliceModifier.VerticalLines>
    <chartModifier:SnappyVerticalLine x:Name="VerticalLine"
                          ShowLabel="False"
                          X1="0"
                          Y1="0"
                          CoordinateMode="Absolute"
                          IsEditable="True">
    </chartModifier:SnappyVerticalLine>
</s:VerticalSliceModifier.VerticalLines>
Please see the image “Example Vertical Slice Modifier”.
The challange is to have something similar for unsorted data.
One of the issues are multiple intersections. Please see the image “Multiple Intersections” where i would like be able to select what intersections shall be highlighted.
The next challange is the usage of multiple series and synchronization based on a different property (t for time). Please see “Multiple Series” image.
We already have IPointMetadata with X,Y and t to be able to find the data point to highlight.
My question: Is there already some modifier chat can help with this requirements or what would be a clean solution if we need to develop a custom modifier.
Thank you in advance
Paul
- Paul Stempel asked 5 months ago
- last active 3 months ago
Hi,
I feel this should be obvious but I cannot find the answer in the docs. I have multiple Y axis and I want all of them to start at 0 and autoRange only the max value. Also, the zooming should not be affected, it should have normal behavior. I just want the axis to go from 0 to auto max value when we call ZoomExtents(). The default behavior of the ZoomExtents() is auto min value to auto max value.
Is there any way we can achieve this with SciChart?
Thank you,
Alex
- Alexandru Neamtu asked 2 months ago
- last active 2 months ago
Hi,
I’ve been trying to use CustomPointMarker to build a custom candle, but I need something like
CurrentRenderPassData.YCoordinateCalculator.GetCoordinate(yValue) to know the coordinates of a certain y value in the screen.
I look up CustomPointMarker documentation, but I haven’t found anything.
could you please help me?
Thank you
- lorenzo522 asked 8 years ago
- last active 8 years ago
Hello everybody,
I didnt find any answer to this. Is it possible to display data from year 0 to year 9999?
Until now i figuered out, that data from the year 834 to 9166 can be displayed. Beyond this range (eg to 9499) not data were displayed and the x-axis shows todays date.
Thanks for any help
Emanuel
- Emanuel Döser asked 3 years ago
- last active 2 years ago
I am considering applying server-side licensing for my javerScript application.
In the document below, there is a phrase “Our server-side licensing component is written in C++.”
(https://support.scichart.com/index.php?/Knowledgebase/Article/View/17256/42/)
However, there is only asp.net sample code on the provided github.
(https://github.com/ABTSoftware/SciChart.JS.Examples/tree/master/Sandbox/demo-dotnet-server-licensing)
I wonder if there is a sample code implemented in C++ for server-side licensing.
Can you provide c++ sample code?
Also, are there any examples to run on Ubuntu?
- Mohamed Ben Amar asked 2 months ago
- last active 3 weeks ago
Hello SciChart-Team,
I noticed that the columns in Sparse Column3D and in Uniform Column 3D always start at the XZ surface. Is there any option or way to do so, that columns always use the zero value of the Y axis as their starting point. The visible range of the axes should correspond to the minimum and maximum Y values.
The current behavior can be reproduced in the example SciChart_UniformColumn3D:
If the VisibleRange of the Y-axis goes from 0 to 0.5 then the columns with negative values go down (see screenshot 1)
As soon as the VisibleRange of the Y-axis goes from -0.5 to 0.5, the columns look like this (Screenshot2) We need the columns to look like in Screenshot 1, only that the Y-axis is also visible downwards.
Can the starting point of the columns be changed?
Best regards
Silvester
- Silvester Schneidt asked 3 years ago
- last active 1 year ago
I’m adding an annotation to a chart with a DateTime x-axis. Without a label the annotation is successfully added. However, if I specify a label I get an InvalidOperationException when Add() is called. The exception message is “The Type this is a test is not a valid Comparable Type”}:
                var annotation = new VerticalLineAnnotation
                {
                    VerticalAlignment = VerticalAlignment.Stretch,
                    ShowLabel = true,
                    X1 = time.DateTime,
                    Stroke = System.Windows.Media.Brushes.Orange,
                    LabelPlacement = LabelPlacement.TopRight,
                    LabelValue = "this is a test",
                    LabelsOrientation = Orientation.Vertical
                };

                MyChart.Annotations.Add(annotation);
The LabelValue is obviously of type string and non-null and indeed of type IComparable. Any reason I can’t add it?
- Dan Pilat asked 7 years ago
- last active 6 years ago
Hi,
I’m experimenting with the LegendModifier and want to control which RenderableSeries are shown via the “LegendItemTemplate” approach. The idea is to add a specific tagging class to the RenderableSeries.DataSeries.Tag and use the content inside the LegendItemTemplate which I define in the Window.Resouces.
The tagging Class:
public class DataSeriesTag
{
    public string LegendText { get; set; }
    public bool ShowLegend { get; set; }
}
The LegendItemTemplate:
<Window.Resources>
<Grid.ColumnDefinitions>
</Grid.ColumnDefinitions>
            <!--<CheckBox Width="16" Margin="5,0,0,0"
                HorizontalAlignment="Left"
                VerticalAlignment="Center"
                IsChecked="{Binding RenderableSeries.IsVisible, Mode=TwoWay}"
                Visibility="{Binding RenderableSeries.DataSeries.Tag.ShowLegend, Converter={dxmvvm:BooleanToVisibilityConverter}}" />-->

            <s:PointMarker Grid.Column="1" Margin="5,0,0,0" Width="40" Height="10" VerticalAlignment="Center" HorizontalAlignment="Center"
              DataContext="{Binding RenderableSeries}"
              DeferredContent="{Binding LegendMarkerTemplate}"
              Visibility="{Binding ShowSeriesMarkers, RelativeSource={RelativeSource AncestorType=s:SciChartLegend}, Converter={dxmvvm:BooleanToVisibilityConverter}}" />

            <TextBlock Margin="5,0,5,0"
     Grid.Column="2"
     HorizontalAlignment="Left"
     Text="{Binding RenderableSeries.DataSeries.Tag.LegendText}" />

        </Grid>
    </DataTemplate>
</Window.Resources>
As long as I declare the SciChartSurface.ChartModifier in XAML, it works perfect.
The proplem raises when I bind the ModifierGroup to a ViewModel Property and try to build the LegendModifier there. How can I assign the LegendItemTemplate in the ViewModel?:
legendModifier = new LegendModifier(){
            ShowLegend = true,
            ShowVisibilityCheckboxes = false,
            LegendItemTemplate = ??????
        };
        TheModifiers.ChildModifiers.Add(legendModifier);
Kind regards
Martin
- Martin Mohr asked 4 years ago
- last active 4 years ago
Hi there,
Here is my xaml setting :
 <s:SciStockChart.XAxisStyle>
     <Style TargetType="s:CategoryDateTimeAxis">
         <Setter Property="VisibleRange" Value="{Binding ParentViewModel.XRange}" />
         <Setter Property="AutoRange" Value="{Binding ParentViewModel.AutoRangeX}"/>
     </Style>
 </s:SciStockChart.XAxisStyle>
And I also set, XRange = new IndexRange(0, 9), AutoRangeX = AutoRange.Never, but the chart show like image, always has gap there.
What should I do?
- CHIA CHUN TANG asked 1 month ago
- last active 1 month ago
If I have two points on my chart (x1, y1) and (x2, y2), what is the recommended way to create a line that goes through these two points? I maintain the value of the slope and the previously mentioned coordinates.
Thanks!
- Ryan Woods asked 8 years ago
- last active 8 years ago
Hi, I want to know buffer structure of 2d fastline.
I use very huge data per line.(maybe about 30,000 points/1 sec are appended to a line.)
But Memory usage is different than expected.
I use fifocapacity, and It is realtime graph.
Appending data, the memory usage increases too much.
Especially, It use more memory when drawing more lines.
For example,
Assuming one line uses 100mb, the five lines use 5000mb not 500mb.
Is it right??
- CholJin Ko asked 5 years ago
- last active 5 years ago
Hi,
I know that when I use MouseWheelZoomModifier with my chart surface, the default behavior is:
1. On mouse wheel (No keyboard mod) – Zoom according to the “ActionType” propery, and direction according to the “XYDirection” property.
2. On mouse wheel + CTRL – X-Axis pan
3. On mouse wheel + Shift – Y-Axis pan
I want to achieve this behavior:
1. On mouse wheel (No keyboard mod) – Zoom according to the “ActionType” propery, and direction according to the “XYDirection” property.
2. On mouse wheel + CTRL – XY-Axis Zoom
3. On mouse wheel + Shift – Y-Axis Zoom
Any idea how to achieve this behavior?
Thanks, Ben.
- Ben Mendel asked 4 weeks ago
- last active 2 weeks ago
Hi,
I use your library. and I want to use directX.
but when I open a page using this(following your article),
[http://support.scichart.com/index.php?/Knowledgebase/Article/View/17261/0/high-quality-vs-high-speed-vs-directx-renderer-plugins]
I saw a error message and my program was terminated…
Error is,
–
Problem signature:
Problem Event Name: CLR20r3
Problem Signature 01: myprogram.exe
Problem Signature 02: 1.0.0.0
Problem Signature 03: 5b88a1cf
Problem Signature 04: SharpDX.D3DCompiler
Problem Signature 05: 4.0.1.0
Problem Signature 06: 592da5b5
Problem Signature 07: 2e
Problem Signature 08: c8
Problem Signature 09: System.DllNotFoundException
OS Version: 6.1.7601.2.1.0.256.48
Locale ID: 1033
Additional Information 1: 0d9f
Additional Information 2: 0d9f788f3d877e9bf9dd1ced0a063406
Additional Information 3: f3e4
Additional Information 4: f3e4c83f74a923e37478f9aa84b2c268
Read our privacy statement online:
http://go.microsoft.com/fwlink/?linkid=104288&clcid=0x0409
If the online privacy statement is not available, please read our privacy statement offline:
C:\Windows\system32\en-US\erofflps.txt
–
but I imported that in my project.
and Debug or Release folder has that dll.
This problem occured on another computer…(installed directX driver/ OS is Win7)
My development PC is fine.(Win10)
Why is it??
Please tell me awesome solution…
- CholJin Ko asked 6 years ago
- last active 6 years ago
Hi,
I am developing a desktop application using your SciChart WPF v6.5.1.26067 library. Right now, it is used on Windows 10 machines. It is working in all computers except for one. In this computer, we can’t make zoom or click on it to show more data. Could you tell me a reason? The machine system information is:
      Time of this report: 2/17/2022, 17:05:06
      Machine name: PA05009
      Machine Id: {54B0843D-6CE1-4289-A978-A41820074452}
      Operating System: Windows 10 Pro 64-bit (10.0, Build 19042) (19041.vb_release.191206-1406)
      Language: Spanish (Regional Setting: Spanish)
      System Manufacturer: Dell Inc.
      System Model: Vostro 3500
      BIOS: 1.9.0 (type: UEFI)
      Processor: 11th Gen Intel(R) Core(TM) i3-1115G4 @ 3.00GHz (4 CPUs), ~3.0GHz
      Memory: 8192MB RAM
      Available OS Memory: 7914MB RAM
      Page File: 7853MB used, 6461MB available
      Windows Dir: C:\WINDOWS
      DirectX Version: DirectX 12
      DX Setup Parameters: Not found
      User DPI Setting: 120 DPI (125 percent)
      System DPI Setting: 120 DPI (125 percent)
      DWM DPI Scaling: UnKnown
      Miracast: Available, with HDCP
      Microsoft Graphics Hybrid: Not Supported
      DirectX Database Version: 1.0.8
      DxDiag Version: 10.00.19041.0928 64bit Unicode
Thanks,
Harold.
- Harold Ramirez asked 2 years ago
- last active 2 years ago
Hi,
All MyGet systems which host the SciChart nuget feeds are down: https://status.myget.org/
Does someone know where to report this issue and how to get any more information on this downtime? E.g. is it planned and is there an estimate how long this is going to take?
Thanks!
- Christian Liebhardt asked 9 months ago
- last active 9 months ago
Hello Scichart Team,
Can you guys provide me with some guidance to implement a custom IRenderableSeriesViewModel implementation that is supported in MVVM binding in Scichartsurface? Specifically, I’m looking to create a chart series that can be bound to my ViewModel and support custom styling and data handling.
I have tried following the tutorial found here…
Worked Example – CustomRenderableSeries in MVVM
https://www.scichart.com/documentation/win/current/webframe.html#Worked%20Example%20-%20CustomRenderableSeries%20in%20MVVM.html
I was getting a cast error from scicharts. I have attached the picture showing the detailed error.
Concerning the XAML code I have tried both the normal Binding keyword and s:SeriesBinding keyword to the RenderableSeries in the SciChartSurface.
Let me know how to go about this!
- Arjun Sivaprasadam asked 1 year ago
- last active 1 year ago
The first question: Where did the example go (link below)?
https://support.scichart.com/support/solutions/articles/101000513349-tutorial-custom-legend-with-color-picker-and-custom-point-markers
I want to do like what and time ago I saved link but now this page is deleted. I need it because it is good example for resolve my 2nd question I think.
And the second question: I have chart
    <s:SciChartSurface Grid.Row="0" Grid.Column="0" x:Name="SciChartSurface" Margin="5" Padding="5"
                       ChartTitle="{mainVM:Localization MainChartSciChartSurface}" RenderableSeries="{s:SeriesBinding RenderableSeries}" Annotations="{s:AnnotationsBinding Annotations}">
        <s:SciChartSurface.XAxis>
            <s:NumericAxis AxisTitle="{mainVM:Localization XNumericAxis}" VisibleRange="{Binding VisibleRangeXAxis, Mode=TwoWay}" />
        </s:SciChartSurface.XAxis>
        <s:SciChartSurface.YAxis>
            <s:NumericAxis GrowBy="0.1,0.1"
                           AxisTitle="{mainVM:Localization YNumericAxis}" VisibleRange="{Binding VisibleRangeYAxis, Mode=TwoWay}" AutoRange="{Binding IsStaticYAxis, Converter={StaticResource StaticAxisToSciChartAutoRangeConverter}}" />
        </s:SciChartSurface.YAxis>
        <s:SciChartSurface.ChartModifier>
            <s:ModifierGroup>
                <s:SeriesValueModifier />
                <s:CursorModifier IsEnabled="{Binding IsShowValuesCursor}" />
                <s:LegendModifier x:Name="SciChartLegendModifier" GetLegendDataFor="AllSeries" ShowLegend="False"
                                  SeriesData="{Binding SeriesData, Mode=TwoWay}" />
            </s:ModifierGroup>
        </s:SciChartSurface.ChartModifier>
    </s:SciChartSurface>
Legend of chart placed in another panel
    <s:SciChartLegend x:Name="SciChartLegendControl" s:ThemeManager.Theme="Chrome" Margin="5,5" ScrollViewer.HorizontalScrollBarVisibility="Auto" ScrollViewer.VerticalScrollBarVisibility="Auto"
                      LegendData="{Binding SeriesData, Mode=OneWay}" ShowVisibilityCheckboxes="True" />
SeriesData is
private ChartDataObject _seriesData;
public ChartDataObject SeriesData
{
    get => _seriesData;
    set => SetProperty(ref _seriesData, value, nameof(SeriesData));
}
I want to see chart values in additional fields near the chart. I made this
<Grid>
    <Grid.ColumnDefinitions>
        <ColumnDefinition Width="Auto" />
    </Grid.ColumnDefinitions>
    <ListView Grid.Column="0" x:Name="ChartsListView" BorderBrush="Transparent" ItemContainerStyle="{StaticResource ListViewItemContainerDefaultStyle}"
              ItemsSource="{Binding SeriesData.SeriesInfo}">
        <ListView.ItemTemplate>
            <DataTemplate>
                <Grid>
                    <Grid.ColumnDefinitions>
                        <ColumnDefinition Width="*" />
                        <ColumnDefinition Width="Auto" />
                    </Grid.ColumnDefinitions>
                    <Label Grid.Column="0" Style="{StaticResource LabelDefaultStyle}"
                           Content="{Binding SeriesName}" Visibility="{Binding IsVisible, Converter={StaticResource BooleanToVisibilityConverter}}" />
                    <Label Grid.Column="1" Style="{StaticResource LabelIndicatorStyle}"
                           Content="{Binding YValue}" />
                </Grid>
            </DataTemplate>
        </ListView.ItemTemplate>
    </ListView>
</Grid>
All working correctly. But I want to bind Legend visibility checkboxes to my custom controls for values: when I uncheck chart checkbox control bound to this chart must becomes invisible. In code above I write
Visibility="{Binding IsVisible, Converter={StaticResource BooleanToVisibilityConverter}}"
but it not worked. How can I make it like I want?
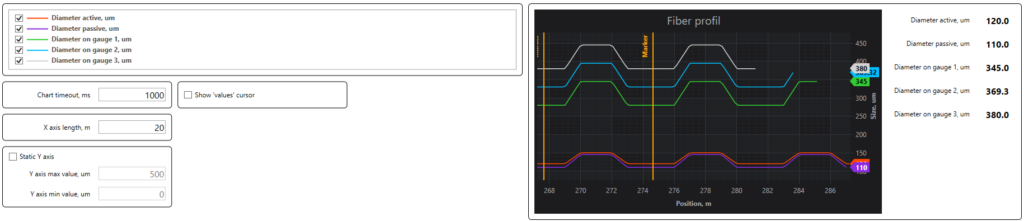
And 3rd question: how can I guarantee the order of SeriesData lines? I have to be sure that charts in legend and custom controls ordered in the same ordering
- Fedor Iudin asked 3 weeks ago
- last active 1 week ago
Hi,
Is it possible to show contour of bars in ColumnRenderableSeries3D?
Is there way to do this?
ColumnRenderableSeries3D has a Stroke property, but does not appear to have any effect on setting this property.
best regards
Silvester
- Silvester Schneidt asked 4 years ago
- last active 4 years ago
Hello,
I am currently working on a proof of concept to move make our software cross platform. Currently, we use the WPF charting package but we have the full bundle so we have access to all the charts. I’m working on a Maui Blazor app where the UI and its logic are stored in a razor class lib and most of the services are stored in the shared WebAssembly project. Ideally, I would like to create the chart data inside a service and then create the appropriate views for each platform using the platform specific charts. Eventually my plan is to have a Blazor WASM project that we host online (where users can view their data), a Maui app that will run on Windows and Mac, and a WPF app that will host the project on computers that aren’t running Windows 10 and 11.
Are there any plans to implement a shared library of some type for the IRenderableSeriesViewModel, IDataSeries, IPaletteProvider, etc. where we could reference these interfaces regardless of platform?
Thank you,
Tim Stephansen
- Tim Stephansen asked 1 year ago
- last active 1 year ago
If I set AutoRange = “Always” myHorizontalLineAnnotation draws fine. When I set it to “Never” – which I want – my HorizontalLineAnnotation won’t draw. How do I do this? ty
  <s:SciChartSurface.YAxis>
        <s:NumericAxis AutoRange="Never"
                       VisibleRange="{Binding ElementName=this, Path=YMinMax}"

        <s:HorizontalLineAnnotation HorizontalAlignment="Stretch"
                                    Y1="{Binding ElementName=this, Path=CurrentHigh}"
                                    Stroke="{Binding ElementName=this, Path=ToleranceColor}"
                                    StrokeThickness="1" />
- Paul Richardson asked 7 years ago
- last active 7 years ago
I just purchased a license for WPF 2D+3D (Pro) and tried to use a scichartsurface without DirectX and it works fine but as soon as I include
s3D:DirectXHelper.TryApplyDirectXRenderer="True"
                s3D:DirectXHelper.FallbackType="{x:Type s:HighSpeedRenderSurface}"
I get the following runtime error:
System.Windows.Markup.XamlParseException: ‘Could not load file or assembly ‘SciChart.Drawing.DirectX, PublicKeyToken=b55dd9efe817e823′ or one of its dependencies. The system cannot find the file specified.’
What am I doing wrong? I installed the newest Scichart version on the Nuget channel. In Nuget I can see that “SciChart”, “SciChart3D”, “SciChart.DirectX” and a bunch of SharpDX libraries were installed.
- bbmat asked 6 years ago
- last active 6 years ago
When the GrowBy property on NumericAxis3D is specified, a tooltip modifier on the same 3D chart shows over data points that are not those under the mouse pointer.
To replicate the issue:
-
Clone the examples project from GitHub and open the SciChart2D3D.Examples solution.
-
In UniformColumn3D.xaml change the XAxis, YAxis, ZAxis and ChartModifier elements to the following, from line 101 onwards:
<s3D:SciChart3DSurface.XAxis> <s3D:NumericAxis3D AutoRange="Always" /> </s3D:SciChart3DSurface.XAxis> <s3D:SciChart3DSurface.YAxis> <s3D:NumericAxis3D AutoRange="Always" /> </s3D:SciChart3DSurface.YAxis> <s3D:SciChart3DSurface.ZAxis> <s3D:NumericAxis3D AutoRange="Always" /> </s3D:SciChart3DSurface.ZAxis> <s3D:SciChart3DSurface.ChartModifier> <s3D:TooltipModifier3D HoverDelay="150" CrosshairMode="Lines" ShowTooltipOn="MouseOver" /> </s3D:SciChart3DSurface.ChartModifier> -
Run the application and observe that the 3D Charts -> Basic Chart Types -> Uniform Column 3D chart shows a chart with correct tooltips appearing when the mouse is hovered over columns on the chart.
-
Add GrowBy=”0.1, 0.1″ to each axis property as follows:
<s3D:SciChart3DSurface.XAxis> <s3D:NumericAxis3D AutoRange="Always" GrowBy="0.1,0.1" /> </s3D:SciChart3DSurface.XAxis> <s3D:SciChart3DSurface.YAxis> <s3D:NumericAxis3D AutoRange="Always" GrowBy="0.1,0.1" /> </s3D:SciChart3DSurface.YAxis> <s3D:SciChart3DSurface.ZAxis> <s3D:NumericAxis3D AutoRange="Always" GrowBy="0.1,0.1"/> </s3D:SciChart3DSurface.ZAxis> -
Run the application again and hover the mouse over the same chart. Note that the tooltop is now shown for a data point different to whichever one the mouse is over at the time, which is incorrect.
- Stephen Hewlett asked 4 years ago
- last active 4 years ago
