I am creating a graph for 10 data series using Scichart, with the most optimal legend placement for the graph being “Top” with Horizontal Orientation as shown in the code below. I would like to keep the spacing compact so all the data series can be visible without the need for the scrollbar, however because of the checkboxes for selecting each series being enabled I cannot compress the spaces to make all the data series visible. I did try using a custom legend with the typical binding but to no avail. I have attached an image of the current legend as well.
<s:LegendModifier Name="legendModifier" Margin="1" Width="1" ShowLegend="True" Orientation="Horizontal"
                                  HorizontalAlignment="Left" VerticalAlignment="Top"
                                  LegendPlacement="Top" ScrollViewer.HorizontalScrollBarVisibility="Auto"
                                  Visibility="Visible"/>
Is it possible to format the legend so as to keep all the series names visible while maintaining the checkboxes for displaying or hiding individual data series?
- Gil Owu asked 1 year ago
- last active 1 year ago
Several legends are displayed using LegendModifier.
-
Using ScrollViewer.VerticalScrollBarVisibility=”Auto”, it was possible to move using mouse scrolling, bar grabbing, etc., but it did not work when the border was dragged in a screen touch environment. Is there a way to drag on a touch monitor?
-
It is being displayed using Orientation=”Horizontal”, but there is a limit to displaying it on one line due to the large number of legends. What document can I refer to if I want to change it to display as multi-line? I think the MVVM method would be best.
- Lee Ji Un asked 7 months ago
- last active 7 months ago
Hi,
I’m prototyping an application with two visible data series and an individual Y-axis for each data series. See the enclosed image.
The Stroke color of each data series, the TickTextBrush and the BorderBrush of the y-axis are updated by normal data Binding through the MVVM pattern.
The problem is that I am not able to data bind the Stroke property of the MajorTickLineStyle for the individual Y-axis.
Do You know if there is a workaround for this through data binding?
The project is enclosed.
- andreasrep asked 7 years ago
- last active 7 years ago
Is there a way to draw an svg formatted annotation onto a chart for WPF?
I have found references/examples for it in javascript here . . .
https://www.scichart.com/documentation/js/current/Tutorial%2006%20-%20Adding%20Annotations.html
but not for any other platform.
- Russell Hall asked 2 years ago
- last active 2 years ago
Hi SciChart!
I am evaluating the trial for possible use in a major project within our organisation.
We have decided to use the System.Reactive reactive extensions as our event handler and I have reached the point where I have an IObservableCollection (instantiated as ObservableCollectionExtended) of where T can be any type containing X and Y values.
My question is, is it possible to Bind a scichart Line Series on to such a collection in order to update via the reactivestream updates?
I’d rather not have to copy points into yet another collection type if possible.
Note: I looked at the nuget for scichart wpf reactive library and that seems to bind on to rx 2.2.5 whereas I’m using system.reactive 4.1.6
Any direction for a new-to-reactive developer would be greatly received.
Greg
- Greg Benedict asked 5 years ago
- last active 5 years ago
Hello Scichart Team,
Can you guys provide me with some guidance to implement a custom IRenderableSeriesViewModel implementation that is supported in MVVM binding in Scichartsurface? Specifically, I’m looking to create a chart series that can be bound to my ViewModel and support custom styling and data handling.
I have tried following the tutorial found here…
Worked Example – CustomRenderableSeries in MVVM
https://www.scichart.com/documentation/win/current/webframe.html#Worked%20Example%20-%20CustomRenderableSeries%20in%20MVVM.html
I was getting a cast error from scicharts. I have attached the picture showing the detailed error.
Concerning the XAML code I have tried both the normal Binding keyword and s:SeriesBinding keyword to the RenderableSeries in the SciChartSurface.
Let me know how to go about this!
- Arjun Sivaprasadam asked 1 year ago
- last active 1 year ago
Hello,
I have a SciChartSurface with multiple StackedColumnRenderableSeries. The goal is to create a column style “Stacked Graph”.
The StackedColumnRenderableSeries are created this way:
private StackedColumnRenderableSeries[] m_layers = new StackedColumnRenderableSeries[0];
  -------
    while (num  > m_layers.Length)
              {
                  StackedColumnRenderableSeries layer = new StackedColumnRenderableSeries()
                  {
                      DataPointWidth = 0.9,
                      Fill = new SolidColorBrush(DefaultMainColorOfCurrentSetting),
                      Stroke = Colors.Black,
                      ShowLabel = false
                  };

                      layer.DataSeries = new XyDataSeries<double, double>();
                      layer.DataSeries.AcceptsUnsortedData = true;

                  m_sciChartSurface.RenderableSeries.Add(layer);

                  List<StackedColumnRenderableSeries> temp = m_layers.ToList();
                  temp.Add(layer);
                  m_layers = temp.ToArray();

              }
Later, they are fed data with this function:
void addBar(double[] layerValues)
          {

              using (m_sciChartSurface.SuspendUpdates())
              {
                  for (int i = 0; i < m_layers.Length; i++)
                  {
                      XyDataSeries<double, double> data = (XyDataSeries<double, double>)m_layers[i].DataSeries;
                      data.Append(m_currentTimepoint, layerValues[i]);
                  }
              }

              m_currentTimepoint++;
          }

  private int m_currentTimepoint = 1;
If I use this function within the class constructor, everything works as expected (see attached image).
However, sometimes, I receive the error message “”System.ArgumentException” in SciChart.Charting.dll The StackedColumnRenderableSeries type requires that all stacked stacked series with the same StackedGroupId have the same XValues.”
I fail to see the meaning of this message, since, the x-Value is the same for each part of the new column. Its “m_currentTimepoint”.
Additional Information:
This visualization is part of a medical monitoring software we are currently developing. If we use test data to call the addBar-Function (directly from the constructor, for example), the error does not appear. However, if we use data from our medical sensors, it appears. In both cases, the addBar-Function receives valid data (no NaN´s or such things)
The function is not called often, about once every 10 seconds.
Thank you
- Marc Vahldieck asked 8 months ago
- last active 8 months ago
I refactored from using custom RenderableSeries to a custom RenderableSeriesViewModel which has fixed a refresh bug in the chart:
  public class CustomExclusionRenderableSeriesViewModel : BaseRenderableSeriesViewModel
  {
     public override Type RenderSeriesType => typeof(CustomExclusionRenderableSeries);
  }
However I am invoking MouseLeftButtonUp in the chart code behind and performing a hit test. The HitTest method is not exposed on the BaseRenderableSeriesViewModel:
 private void SciChartSurfaceMouseLeftButtonUp(object sender, MouseButtonEventArgs e)
 {
    // Perform the hit test relative to the GridLinesPanel
    Point hitTestPoint = e.GetPosition(this.sciChart.GridLinesPanel as UIElement);

    // Get hit test the RenderableSeries using interpolation
    this.ViewModel.HitTestInfo = this.ViewModel.ExclusionSeries.HitTest(hitTestPoint, true);
Is there any way to get the series instance from the view model & hit test it?
- Thomas Hutchinson asked 7 years ago
- last active 7 years ago
Hi,
When hovering mouse over a graph, the box that appears showing the name and value gets cut off instead of flipping to remain in the area.
Can you please help me to overcome this issue or if any, idea or lead much appreciated. Please let me know if you need more information.
Please find the screenshot for your reference.
- Barani G asked 1 year ago
- last active 1 year ago
Hello,
I am currently working on a proof of concept to move make our software cross platform. Currently, we use the WPF charting package but we have the full bundle so we have access to all the charts. I’m working on a Maui Blazor app where the UI and its logic are stored in a razor class lib and most of the services are stored in the shared WebAssembly project. Ideally, I would like to create the chart data inside a service and then create the appropriate views for each platform using the platform specific charts. Eventually my plan is to have a Blazor WASM project that we host online (where users can view their data), a Maui app that will run on Windows and Mac, and a WPF app that will host the project on computers that aren’t running Windows 10 and 11.
Are there any plans to implement a shared library of some type for the IRenderableSeriesViewModel, IDataSeries, IPaletteProvider, etc. where we could reference these interfaces regardless of platform?
Thank you,
Tim Stephansen
- Tim Stephansen asked 1 year ago
- last active 1 year ago
Hello,
I’m trying to display a vertical line annotation on a chart using MVVM.
In order to make it work I’ve (All the INotifyPropertyChanged are managed via the BaseViewModel)
public class GraphSurfaceBaseViewModel : BaseViewModel
{
    /// <summary>
    /// A list of annotations
    /// </summary>
    public ObservableCollection<IAnnotationViewModel> Annotations { get; private set; }

 ...
}
I create annotation that way
Graph.Annotations.Add(new VerticalLineAnnotationViewModel()
            {
                X1 = TimeOfComment,
                ShowLabel = true,
                StrokeThickness = 2,
                XAxisId = "Xaxis",
                YAxisId = "Yaxis1",
                AnnotationLabels = new ObservableCollection<AnnotationLabel>() { new AnnotationLabel() {Text = "mon test", LabelPlacement = LabelPlacement.TopRight } }

            });
And the binding to the scichartsurface is :
<s:SciChartSurface
...
Annotations="{s:AnnotationsBinding Annotations}"
</s:SciChartSurface>
I’ve double check that my x axis and y axis have the same ID as the annotation.
The problem is I want to display several annotation labels but they are not appearing. I suspect a problem via the AnnotationsBinding which is not taking the AnnotationLabels from the VerticalLineAnnotationViewModel.
What I got :

What I want (paint skill here):

For the what I want, I can draw a simple vertical bar by settings showLabel = false but I suppose that all the label I previously added to the
AnnotationLabels will not be shown, that’s why I let it.
Thank you for any help.
Renaud
- Renaud Danniau asked 5 years ago
- last active 5 years ago
I have just finished my first pass evaluation of the SciChart performance. When drawing a lesser number of points (<100000), SciChart outperforms two other packages I have evaluated. However, when drawing more points (200,000 – 2,000,000), SciChart does not meet the performance of the other packages.
The evaluation involved selecting a different number of lines and number of points per line. The transition to worse performance occurred in the following setups:
Line Count Points/Line Loop Count Total Time (ms)
2 100,000 25 1890
5 100,000 25 4670
2 1,000,000 10 7400
2 10,000,000 10 74000
These setups average out to about 0.37 usec per point. This is where the other packages outperformed SciChart, as their per point times kept improving.
I have tried to follow all of the performance tips I found on your website. I have included the code used to evaluate SciChart and would appreciate any help in improving the results.
Thanks,
Dave
- Dave Leach asked 8 years ago
- last active 8 years ago
I’m using SciChartSurface to draw XyDataSeries on XyScatterRendurableSeries.
XyDataSeries changes values at certain times and requires updates.
However, it takes too long to update multiple SciChartSurfaces.
I’ve tried the SuspendUpdates method, but it doesn’t work.
Please let me know if there is a good way.
Thank you in advance.
- Seung Woo Jin asked 11 months ago
I have a problem with the alignment of the Minor Grid Line.
As you can see on the ScreenShot, the minor lines are not synchronized with the major line. They are not in the same x-axis position.
How can I do this?
Furthermore, I would like to have a dotted line instead of the dotted line. How can I do this?
How can I define the number of points between the major grids? currently there are 15, but I do not define this, it must be determined internally by the SciChart.
Thank you for your support.
Andreas
- Andreas Köhler asked 6 years ago
- last active 6 years ago
Good day,
we are using the VerticalSliceModifier for sorted data and it works very good.
<local:VerticalSliceModifierExt x:Name="SliceModifier">
<s:VerticalSliceModifier.VerticalLines>
    <chartModifier:SnappyVerticalLine x:Name="VerticalLine"
                          ShowLabel="False"
                          X1="0"
                          Y1="0"
                          CoordinateMode="Absolute"
                          IsEditable="True">
    </chartModifier:SnappyVerticalLine>
</s:VerticalSliceModifier.VerticalLines>
Please see the image “Example Vertical Slice Modifier”.
The challange is to have something similar for unsorted data.
One of the issues are multiple intersections. Please see the image “Multiple Intersections” where i would like be able to select what intersections shall be highlighted.
The next challange is the usage of multiple series and synchronization based on a different property (t for time). Please see “Multiple Series” image.
We already have IPointMetadata with X,Y and t to be able to find the data point to highlight.
My question: Is there already some modifier chat can help with this requirements or what would be a clean solution if we need to develop a custom modifier.
Thank you in advance
Paul
- Paul Stempel asked 6 months ago
- last active 4 months ago
Some customers are reporting the following exception when upgrading to SciChart v6.1.0.13075 or 6.1.1.13136 via NuGet
SciChartSurface didn't render, because an exception was thrown:
Message: Unable to find an entry point named 'CSharp_ResamplingArgs_InputSize_set' in DLL 'VXccelEngine2D'.

Stack Trace: at cnh.zlm(HandleRef dnc, Int32 dnd)
at SciChart.Charting2D.Interop.ResamplingArgs.set_InputSize(Int32 value)
at SciChart.Charting2D.Interop.ExtensionMethods.ToResamplingArgs(ResamplingParams resamplingParams, ResamplingMode resamplingMode, ResamplingArgs resamplingArgs)
at SciChart.Data.Numerics.PointResamplers.ExtremeResamplerBase`2.Execute(IList`1 xColumn, IList`1 yColumn, ResamplingParams resamplingParams, ResamplingMode resamplingMode, IPointSeries pointSeries)
at SciChart.Charting.Model.DataSeries.XyDataSeries`2.ToPointSeriesInternal(ResamplingParams resamplingParams, ResamplingMode resamplingMode, IPointResamplerFactory factory, IPointSeries lastPointSeries)
at SciChart.Charting.Model.DataSeries.DataSeries`2.ToPointSeries(ResamplingParams resamplingParams, ResamplingMode resamplingMode, IPointResamplerFactory factory, IPointSeries lastPointSeries)
at uqw.ttd(AxisCollection bzg, IRenderableSeries bzh, RenderPassInfo bzi, IPointResamplerFactory bzj, IDataSeries& bzk, IndexRange& bzl, IPointSeries& bzm, Int32& bzn, Boolean bzo)
at uqw.ttb(ISciChartSurface bzd, Size bze)
at uqw.RenderLoop(IRenderContext2D renderContext)
at SciChart.Charting.Visuals.SciChartSurface.DoDrawingLoop()
It could be a different exception message but ‘Entry Point not Found in VXccelEngine2D.dll’ is the similar message shown in the exception.
Solution below
- Andrew Burnett-Thompson asked 4 years ago
- last active 4 years ago
Hi i am new to SCiChart and i was wondering if there is an option to double click on screen and make it full screen or maybe some sort of un-dock it or open it in new window full screen?
Thx
- [email protected] asked 8 years ago
- last active 8 years ago
Hi, I am currently working with the DataPointSelectionModifier with StackedColumnRenderableSeriesViewModel series. I currently am able to get the data point with the correct values whenever I click on a column but it seems that I am not able to change the selection fill of the column.
All I can seem able to do is changing the color of the whole series, but that is not what I am looking for.
Best Regards.
- Felipe Gonzalez asked 6 years ago
- last active 6 years ago
As the title asks, is Unity 3D on the radar?
- Jules LaPrairie asked 6 years ago
- last active 6 years ago
I have a custom chartmodifier I use for highlighting points on mouseover for my 2D plots and I want to create the same functionality for my 3D scatter plot. However, I can’t get it to work;
for the 2D plot I do
var series = ParentSurface.RenderableSeries[0];
var pt = GetPointRelativeTo(e.MousePoint, ModifierSurface);
double dataPointRadius = 8;
var result = series.HitTestProvider.HitTest(pt, dataPointRadius);
However, it seems that 3D plots don’t have a hittestprovider and that it’s not possible to define a radius for the hit test, so the code becomes
var series = ParentSurface.RenderableSeries[0];
var pt = GetPointRelativeTo(e.MousePoint, ModifierSurface);
var result = series.HitTest(pt);
However, result.IsHit is always false. What am I missing?
- Troels Jensen asked 3 years ago
Hi,
i have a SciChartSurface with DateTimeAxis as xAxis and a NumericAxis as yAxis.
The fifo capacity is 500 points.
Now what i want to archieve is that when i zoom in that the visible range updates in a matter that its moving with the fifo and not to be frozen and at some point in time see how the data points are discarded.
I already implemented a CustomRubberBandZoomModifier which disables autoranging on Zoom and enables it after Zoom to Extents.
How could i archieve this like shown in the attached image?
Thank you already in advance.
- Armin Wild asked 6 months ago
- last active 5 months ago
I’m adding an annotation to a chart with a DateTime x-axis. Without a label the annotation is successfully added. However, if I specify a label I get an InvalidOperationException when Add() is called. The exception message is “The Type this is a test is not a valid Comparable Type”}:
                var annotation = new VerticalLineAnnotation
                {
                    VerticalAlignment = VerticalAlignment.Stretch,
                    ShowLabel = true,
                    X1 = time.DateTime,
                    Stroke = System.Windows.Media.Brushes.Orange,
                    LabelPlacement = LabelPlacement.TopRight,
                    LabelValue = "this is a test",
                    LabelsOrientation = Orientation.Vertical
                };

                MyChart.Annotations.Add(annotation);
The LabelValue is obviously of type string and non-null and indeed of type IComparable. Any reason I can’t add it?
- Dan Pilat asked 7 years ago
- last active 6 years ago
Hi SciChart,
We are experiencing a SciChart XPS export issue.
I am using a FlowDocumentPageViewer with a FlowDocument containing SciChart graphs. My goal is to export all pages of the FlowDocument to an XPS file using the XamlRenderSurface to save in vector graphics. However, I’m facing an issue where only the currently selected page exports correctly, while the other pages display empty graphs.
By default, we employ the VisualXcceleratorRenderSurface for all SciChart render surfaces. Before exporting, I programmatically switch them to XamlRenderSurface to save in vector graphics. This approach works well when all the graphs have been rendered on-screen at least once with the new surface type before exporting. However, if a graph hasn’t been rendered on-screen before exporting, it appears empty, and only the graphs from the selected page export correctly. You can find code snippets below.
XAML code:
<s:SciChartSurface
    x:Name="PART_Surface"
    ...
    RenderSurface="{TemplateBinding RenderType, Converter={StaticResource RenderTypeConverter}}"
    ...
Converter:
public class RenderTypeConverter : IValueConverter
{
    public object Convert(object value, Type targetType, object parameter, CultureInfo culture)
    {
        // Set render settings
        return (RenderType)value switch
        {
            RenderType.DirectX => new VisualXcceleratorRenderSurface(),
            RenderType.HighQuality => new HighQualityRenderSurface(),
            RenderType.HighSpeed => new HighSpeedRenderSurface(),
            RenderType.Vector => new XamlRenderSurface(),
            _ => new HighSpeedRenderSurface(),
        };
    }
    ...
}
Export:
private void ExportVector(string fullPath)
{
    // Sets the RenderType to Vector for all surfaces
    // This invokes RenderTypeConverter to set the RenderSurface to XamlRenderSurface
    // Since they are bound in the XAML code
    SetAxesSurfacesRenderToVector();

    XPS_Export_AllPagesOfFlowDocument(fullPath);

    // DirectX is always the default for all surfaces that we use
    ResetAxesSurfacesToDirectX();
}
private void XPS_Export_AllPagesOfFlowDocument(string fullPath)
{
    using (var package = Package.Open(fullPath, FileMode.Create))
    {
        using (var xpsDocument = new XpsDocument(package, CompressionOption.Maximum))
        {
            var xpsSerializationManager = new XpsSerializationManager(new XpsPackagingPolicy(xpsDocument), false);
            var documentPaginator = ((IDocumentPaginatorSource)FlowDocument)?.DocumentPaginator;
            xpsSerializationManager.SaveAsXaml(documentPaginator);

            xpsDocument.Close();
        }
    }
}
The binding and the converter works for all offscreen elements, yet the they won’t take effect until rendered on screen at least once.
I have to select each page manually, after setting all graphs to use XamlRenderSurface, so each would be rendered on screen at least once before the export.
My question is: How can I export XamlRenderSurfaces that are off-screen and haven’t been rendered on-screen before the export process?
You can find an image below showcasing the problem.
Thank you and looking forward to your reply!
Best Regards,
Kaloyan Krastev
- Kaloyan Krastev asked 8 months ago
- last active 6 months ago
I wanted to experiment with adding a tooltip to the SciChart_ScatterChartPerformanceDemo.
I extended the xaml with
 <s:SciChartSurface.ChartModifier>
            <s:ModifierGroup>
                <s:MouseWheelZoomModifier/>
                <s:TooltipModifier />
            </s:ModifierGroup>
        </s:SciChartSurface.ChartModifier>
However, I have noticed that the tooltip doesn’t seem to react properly to the geometry under the cursor. The tooltip will often show up when the cursor is outside the geometry.
If you use a SquarePointMarker with a width and height of 25, the tooltip pops up even when you’re a fair distance away from the geometry.
The hit detection doesn’t appear to be working correctly?
Edit : Also, it appears I am unable to answer questions here, when I add an answer, it accepts it, but doesn’t show anything?
- forl forl asked 12 months ago
- last active 10 months ago
I want to convert XorYAxis value to total chart surface coodinate Point(X, Y), that includes the axises width too.
(Not chart modifier surface coodinate)
How can I get it?
- Hiroyuki Seki asked 5 years ago
- last active 5 years ago
Hello.
Thanks for previous answer but I can’t check how it work because of new problem. I develop WPF application and try to use MVVM as architecture pattern. In the Model part of my application I used a loop started in the new thread. In that loop I get some data which received to ViewModel and used as chart data. Looks as usual.
But then I tried to set visible range updated object which bound to axis I get exception ‘System.InvalidOperationException: ‘The calling thread cannot access this object because a different thread owns it.’ in my loop. I know it happens in WPF applications and need to use Dispatcher to solve it. But as I know if you try to use MVVM you not needed to use Dispatcher often because WPF-binding in most cases is thread-safe. That happend in my case? How to solve it?
Parts of my code:
XAML
<Window x:Class="HMI.MainWindow"
xmlns="http://schemas.microsoft.com/winfx/2006/xaml/presentation"
xmlns:x="http://schemas.microsoft.com/winfx/2006/xaml"
xmlns:d="http://schemas.microsoft.com/expression/blend/2008"
xmlns:mc="http://schemas.openxmlformats.org/markup-compatibility/2006"
xmlns:s="http://schemas.abtsoftware.co.uk/scichart"
xmlns:localVM="clr-namespace:MyCom.HMI.ViewModel"
mc:Ignorable="d"
Title="MainWindow" Height="450" Width="800">
<Window.DataContext>
<localVM:HMIViewModel/>
</Window.DataContext>
<Window.Resources>
<localVM:InverseBooleanConverter x:Key="InverseBooleanConverter"/>
<localVM:ProcessStateToColorConverter x:Key="ProcessStateToColorConverter"/>
<localVM:ProcessStateToStartedConverter x:Key="ProcessStateToStartedConverter"/>
<localVM:ProcessStateToStoppedConverter x:Key="ProcessStateToStoppedConverter"/>
</Window.Resources>
<DockPanel>
<StackPanel DockPanel.Dock="Top" Orientation="Horizontal">
<StackPanel DockPanel.Dock="Left" Orientation="Vertical" Width="520">
<Border DockPanel.Dock="Top" Margin="5" Padding="5" BorderBrush="Black" BorderThickness="1,1,1,1" CornerRadius="5">
<StackPanel DockPanel.Dock="left" Orientation="Horizontal" Height="40">
<Ellipse Margin="5" Height="20" Width="20" HorizontalAlignment="Left" VerticalAlignment="Center" Stroke="Black" Fill="{Binding ProcessState, Converter={StaticResource ProcessStateToColorConverter}}"/>
<Label Content="State" Margin="5" Width="90" HorizontalContentAlignment="Left" VerticalContentAlignment="Center"/>
</StackPanel>
</Border>
<Border DockPanel.Dock="Top" Margin="5" Padding="5" BorderBrush="Black" BorderThickness="1,1,1,1" CornerRadius="5">
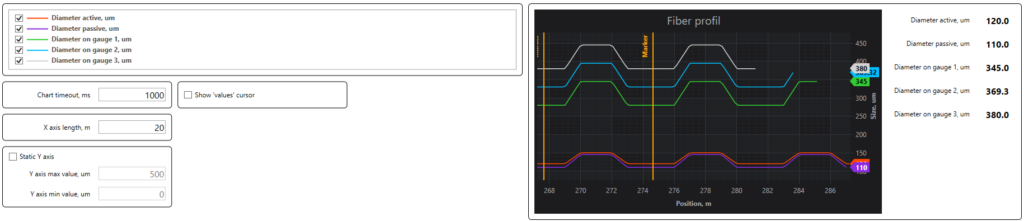
<Grid DockPanel.Dock="Left" Height="300">
<s:SciChartSurface ChartTitle="Profil" RenderableSeries="{s:SeriesBinding RenderableSeries}">
<s:SciChartSurface.XAxis>
<s:NumericAxis AxisTitle="Position, m" VisibleRange="{Binding XVisibleRange, Mode=TwoWay}"/>
</s:SciChartSurface.XAxis>
<s:SciChartSurface.YAxis>
<s:NumericAxis AxisTitle="Size, um" VisibleRange="{Binding YVisibleRange, Mode=TwoWay}"/>
</s:SciChartSurface.YAxis>
</s:SciChartSurface>
</Grid>
</Border>
</StackPanel>
...
ViewModel
namespace MyCom.HMI.ViewModel
{
    public class HMIViewModel : BindableBase
    {
        private readonly HMIModel _model = new();

        public HMIViewModel()
        {
            _renderableSeries = new ObservableCollection<IRenderableSeriesViewModel>();

            ((INotifyCollectionChanged)_model.TestControlData).CollectionChanged += (s, e) =>  { TestControlDataChanged(e); };

            InitCharts();
        }

...

        private ObservableCollection<IRenderableSeriesViewModel> _renderableSeries;
        public ObservableCollection<IRenderableSeriesViewModel> RenderableSeries
        {
            get { return _renderableSeries; }
            set
            {
                SetProperty(ref _renderableSeries, value, nameof(RenderableSeries));
            }
        }

        private IRange _xVisibleRange;
        public IRange XVisibleRange
        {
            get => _xVisibleRange;
            set
            {
                if (_xVisibleRange != value)
                {
                    SetProperty(ref _xVisibleRange, value, nameof(XVisibleRange));
                }
            }
        }

        private IRange _yVisibleRange;
        public IRange YVisibleRange
        {
            get => _yVisibleRange;
            set
            {
                if (_yVisibleRange != value)
                {
                    SetProperty(ref _yVisibleRange, value, nameof(YVisibleRange));
                }
            }
        }

        private XyDataSeries<double, double> _lineDataDiameter1;

...

        private void InitCharts()
        { // TODO
            _lineDataDiameter1 = new XyDataSeries<double, double>()
            {
                SeriesName = "Diameter1"
            };

            RenderableSeries.Add(new LineRenderableSeriesViewModel()
            {
                StrokeThickness = 2,
                Stroke = Colors.SteelBlue,
                DataSeries = _lineDataDiameter1,
                StyleKey = "LineSeriesStyle"
            });
        }

        private void TestControlDataChanged(NotifyCollectionChangedEventArgs args)
        {
            if (args.Action == NotifyCollectionChangedAction.Add && args.NewItems?.Count > 0)
            {
                var testControlActualState = args.NewItems.Cast<TestControlActualState>();

                List<double> xValues = new();
                List<double> yValuesDiameter1 = new();

                foreach (var item in testControlActualState)
                {
                    if (item.Diameter1 > 0f)
                    {
                        xValues.Add(item.FiberLength);
                        yValuesDiameter1.Add(item.Diameter1);
                    }
                }

                _lineDataDiameter1.Append(xValues, yValuesDiameter1);

                // TODO
                if (xValues.Count > 0)
                {
                    var cuurMaxValueX = xValues.Max();
                    XVisibleRange.Max = cuurMaxValueX;
                    XVisibleRange.Min = cuurMaxValueX - 7000f > 0 ? cuurMaxValueX - 7000f : 0;
                }

                // TODO
                if (yValuesDiameter1.Count > 0)
                {
                    var cuurMaxValueY = yValuesDiameter1.Max();
                    YVisibleRange.Max = cuurMaxValueY + 50;
                    YVisibleRange.Min = 0;
                }
            }
        }
Model
namespace MyCom.HMI.Model
{
    public class HMIModel : BindableBase, IDisposable
    {
        private readonly ObservableCollection<TestControlActualState> _testControlData;
        internal ReadOnlyObservableCollection<TestControlActualState> TestControlData { get; }

        public HMIModel()
        {
            _testControlData = new ObservableCollection<TestControlActualState>();
            TestControlData = new ReadOnlyObservableCollection<TestControlActualState>(_testControlData);
        }

...

        private void StartPollerThread()
        {
            _pollerCancellationToken ??= new CancellationTokenSource();

            if (!_pollerCancellationToken.IsCancellationRequested)
            {
                Task.Factory.StartNew(() => PollerDoWork(_pollerCancellationToken.Token), TaskCreationOptions.LongRunning);
            }
        }

        private void PollerDoWork(CancellationToken cancellationToken)
        {
            try
            {
                Thread.CurrentThread.Priority = ThreadPriority.Lowest;
                IsPollerStarted = true;

                while (!cancellationToken.IsCancellationRequested && (_isKeepConnection || _countOfTrying <= MAX_COUNT_OF_TRYING))
                {
                    try
                    {
                        _testControlData.Add(_emulator.GetTestControlActualState());

                        if (!_isKeepConnection && _countOfTrying > 0)
                        {
                            Thread.Sleep(_pollerTimeout / REASK_COEFICIENT);
                            continue;
                        }
                    }
                    catch
                    {
                        // Thread must be alive!!! ...ALWAYS!!!
                    }
                    Thread.Sleep(_pollerTimeout);
                }
            }
            finally
            {
                IsPollerStarted = false;
                _pollerCancellationToken = null;
            }
        }
- Fedor Iudin asked 5 months ago
- last active 5 months ago
I’ve been trying to get SciChart to work with good performance and as part of my experimentation am trying to see how RenderPriority.Manual works. As far as I can tell, it doesn’t.
I haven’t been able to find much in terms of samples or docs. According to the little documentation here:
https://www.scichart.com/documentation/v4.x/SciChart.Charting~SciChart.Charting.Visuals.RenderPriority.html
It says
Manual — Never redraws automatically. You must manually call
InvalidateElement() or ZoomExtents() on the SciChartSurface in order
to get it to redraw
Now, when I try to call either of those functions on my SciChartSurface, nothing visually happens. I’ve tried other Invalidate methods as well, and still no refresh love.
I’ve attached the small sample application that repro’s the issue.
Please let me know what I’m doing wrong.
Thanks,
Brian
- Brian Estey asked 8 years ago
- last active 8 years ago
I’m using XyDataSeries<Timespan, double> to plot to my chart.
I want to show elapsed time at chart X-Axis label like below
ex) If Timespan value is 1day 2hour 30min 40sec
Default label style: 02:30:40
Label style I want: 26:30:40
How can I set like that?
- Hiroyuki Seki asked 4 years ago
- last active 4 years ago
Hello,
I am trying to add a BoxAnnotation with MVVM pattern where the X-Axis is a DateTime axis. The annotation can be dragged into the X-direction. I need to know the DateTime of each position while dragging and also the final position(DateTime) of the BoxAnnotation when the drag Ended. I am listening to the DragDelta and DragEnded events in ViewModel. But here I couldn’t able to get the DateTime from X1 and X2 of that annotation model. I am sharing some snippets of my code. Can you please let me know how I can achieve this?
In xaml:
<Style x:Key="_boxAnnotationStyle" BasedOn="{StaticResource AnnotationBaseStyle}" TargetType="scichart:BoxAnnotation">
        <Setter Property="Template">
            <Setter.Value>
                <ControlTemplate TargetType="scichart:BoxAnnotation">
                    <Border x:Name="PART_BoxAnnotationRoot"
              Margin="{TemplateBinding Margin}"
              Background="{TemplateBinding Background}"
              BorderBrush="{TemplateBinding BorderBrush}"
              BorderThickness="{TemplateBinding BorderThickness}"
              CornerRadius="{TemplateBinding CornerRadius}" />
                </ControlTemplate>
            </Setter.Value>
        </Setter>
</Style>
<scichart:SciChartSurface x:Name="GraphSurface"
                 Annotations="{scichart:AnnotationsBinding ItsAnnotations}">

                <scichart:SciChartSurface.XAxis>
                    <scichart:DateTimeAxis x:Name="GraphXAxis"
                                           VisibleRange="{Binding ItsTimeVisibleRange, Mode=TwoWay}" />
                </scichart:SciChartSurface.XAxis>

                <scichart:SciChartSurface.YAxes>
                    <scichart:NumericAxis x:Name="GraphYAxis"
                                          VisibleRange="0, 10" />

                </scichart:SciChartSurface.YAxes>
 </scichart:SciChartSurface>
In ViewModel.cs
{
    private DateRange _timeVisibleRange;
    private ObservableCollection<IAnnotationViewModel> _annotations;
    private IAnnotationViewModel _boxAnnotation;
    public ObservableCollection<IAnnotationViewModel> ItsAnnotations
    {
        get
        {
            return _annotations;
        }
    }
    public DateRange ItsTimeVisibleRange
    {
        get { return _timeVisibleRange; }
        set
        {
            if (_timeVisibleRange == value) return;
            _timeVisibleRange = value;
            RaisePropertyChanged(() => ItsTimeVisibleRange);
        }
    }
    .
    .
    .
    _boxAnnotation = new BoxAnnotationViewModel()
        {
            IsEditable = true,
            DragDirections = SciChart.Charting.XyDirection.XDirection,
            X1 = DateTime.UtcNow.AddSeconds(300),
            X2 = DateTime.UtcNow,
            Y1 = 0,
            Y2 = 8,
            StyleKey = "_boxAnnotationStyle"
        };

     _annotations = new ObservableCollection<IAnnotationViewModel>() { };
     _annotations.Add(_boxAnnotation );

     _captureTimeRangeSelectorAnnotation.DragDelta += OnDrag;
     _captureTimeRangeSelectorAnnotation.DragEnded += DragEnded;
       .
       .
       .
    private void DragEnded(object sender, EventArgs e)
    {
         var boxAnnotationModel = sender as BoxAnnotationViewModel;
          // Need to know the DateTime value of X1 and X2
    }
    private void OnDrag(object sender, AnnotationDragDeltaEventArgs e)
    {
         var boxAnnotationModel = sender as BoxAnnotationViewModel;
         // Need to know the DateTime value of X1 and X2
    }
    .....
    .....
}
- Habibur Rahman asked 1 year ago
- last active 1 year ago
Hello SciChart-Team,
we had the requirement to show the zero line when there are negative values in the chart.
We noticed the following things, especially in connection with the main grid lines.
There are some side effects at certain sizes of the window:
When the gridlines are on(see screenshot 1):
1. Grid line and tick are not on the same level (Only for certain sizes)
2. The grid line and horizontal annotation line (green) are not aligned either (Only at certain sizes)
3. The axis line (defined via BorderThickness) is also not aligned with the grid line (regardless of the size of the control).And the bottom tick is never aligned with the major grid line
If the major grid lines are switched off, the zero annotation line is not aligned to the ticks for certain sizes of the control (see screenshot 2)
It looks like different algorithms were used to calculate the line position of the ticks, grid lines and line annotations.
The problem was detected on the monitor with 100% scaling. On a 4K monitor with scaling > 100%, the problem became even more apparent
Do you have any suggestion how to solve the problem?
I’ve attached a modified example project in which the behavior can be reproduced.
Regards
Silvester Schneidt
- Silvester Schneidt asked 2 years ago
- last active 7 months ago
On a small PC with only Intel HD Graphics 4600 the DirectX rendering is not supported by SciChart. Thats fine but it should use the fallback render surface.
<s:SciChartSurface
  RenderPriority ="Low"
  s:VisualXcceleratorEngine.IsEnabled="True"
  s:VisualXcceleratorEngine.FallbackType="{x:Type s:HighQualityRenderSurface}"
  s:VisualXcceleratorEngine.DowngradeWithoutException="True"
  s:VisualXcceleratorEngine.EnableImpossibleMode="True"
  s:PerformanceHelper.EnableExtremeDrawingManager="True"
  s:PerformanceHelper.EnableExtremeResamplers="True"
I got this exception:
    System.Exception: Your GPU is blacklisted for use by the Visual Xccelerator Engine! There are several reasons why a GPU could belong to the blacklist. For example, low computation capabilities of the GPU could cause Timeout Detection and Recovery of Graphics Adapter Drivers by the OS, resulting in crashing the application.
   at SciChart.Charting.VisualXcceleratorEngine.ivc(DependencyObject t, DependencyPropertyChangedEventArgs u)
   at System.Windows.DependencyObject.OnPropertyChanged(DependencyPropertyChangedEventArgs e)
   at System.Windows.FrameworkElement.OnPropertyChanged(DependencyPropertyChangedEventArgs e)
   at System.Windows.DependencyObject.NotifyPropertyChange(DependencyPropertyChangedEventArgs args)
   at System.Windows.DependencyObject.UpdateEffectiveValue(EntryIndex entryIndex, DependencyProperty dp, PropertyMetadata metadata, EffectiveValueEntry oldEntry, EffectiveValueEntry& newEntry, Boolean coerceWithDeferredReference, Boolean coerceWithCurrentValue, OperationType operationType)
   at System.Windows.DependencyObject.SetValueCommon(DependencyProperty dp, Object value, PropertyMetadata metadata, Boolean coerceWithDeferredReference, Boolean coerceWithCurrentValue, OperationType operationType, Boolean isInternal)
   at System.Windows.DependencyObject.SetValue(DependencyProperty dp, Object value)
But it should use HighQualityRenderSurface without any exception.
- Tobias asked 4 years ago
- last active 4 years ago
With fifocapacity(XyDataSeries), memory behaves like an image. (Repeat ups and downs)
Is this due to fifocapacity(XyDataSeries)?
Capture : x = minutes , y = MB
- Daichi Takahashi asked 3 years ago
- last active 3 years ago
HI,
I am using Scichart for drawing multiple line series on the same chart.
sciChart Image
video to make it more clear https://youtu.be/O0WiocmldXY , when we have many channels we face a performance issue due to that, and the update rate of the lines become much higher and the responsive of the UI becomes bad.
this kind of graph called segmented graph, what it does it cuts a small portion from other line chart, and draw the data that crosses a specified threshold that the user choose.
we want to draw, up to 100 lines at the same time. each line has 30,000 points.
we assume that the high number of data series causes bad performance.
what can we do, to increase performance? is there a different line series we can use?
- suhib ghreir asked 1 month ago
- last active 4 weeks ago
Hello,
I am trying to generate a graph where the ticks and the labels will be added from TickProvier and LabelProvider. But when there is not enough space, it doesn’t show most of the labels, where it can only skip one label in the middle of two labels (Please check the attached photo). I can not set IsLabelCullingEnabled = true as I do not want any overlap on labels.
I have shared a sample project. Here, I always want to show all the ticks generated from the TickProvider. But how can I handle the labels, so that I can decide inside LabelProvider(Or any other place) if I should set a label empty or not based on the previous label position?
- Habibur Rahman asked 1 year ago
How do you set X1,X2 and Y1,Y2 in xaml as suggested in a previous post here on the forum?
I also get null values here when using Composite Annotations example. the suggestion to set the value DependencyProperty.SetCurrentValue(X1Property, 0.0); does not work since DependencyProperty does not expose a SetCurrentValue method (?)
I am using your example code for doing composite Annotations on my existing chart.
I am using MeasureXAnnotation and MeasureXyAnnotation and the respective Update method that is overidden.
What am I missing ?
Appreciate your help with getting this working
Thanks
Anders
- John-Anders Persson asked 3 years ago
- last active 3 years ago
Hi there,
Here is my xaml setting :
 <s:SciStockChart.XAxisStyle>
     <Style TargetType="s:CategoryDateTimeAxis">
         <Setter Property="VisibleRange" Value="{Binding ParentViewModel.XRange}" />
         <Setter Property="AutoRange" Value="{Binding ParentViewModel.AutoRangeX}"/>
     </Style>
 </s:SciStockChart.XAxisStyle>
And I also set, XRange = new IndexRange(0, 9), AutoRangeX = AutoRange.Never, but the chart show like image, always has gap there.
What should I do?
- CHIA CHUN TANG asked 2 months ago
- last active 2 months ago
The first question: Where did the example go (link below)?
https://support.scichart.com/support/solutions/articles/101000513349-tutorial-custom-legend-with-color-picker-and-custom-point-markers
I want to do like what and time ago I saved link but now this page is deleted. I need it because it is good example for resolve my 2nd question I think.
And the second question: I have chart
    <s:SciChartSurface Grid.Row="0" Grid.Column="0" x:Name="SciChartSurface" Margin="5" Padding="5"
                       ChartTitle="{mainVM:Localization MainChartSciChartSurface}" RenderableSeries="{s:SeriesBinding RenderableSeries}" Annotations="{s:AnnotationsBinding Annotations}">
        <s:SciChartSurface.XAxis>
            <s:NumericAxis AxisTitle="{mainVM:Localization XNumericAxis}" VisibleRange="{Binding VisibleRangeXAxis, Mode=TwoWay}" />
        </s:SciChartSurface.XAxis>
        <s:SciChartSurface.YAxis>
            <s:NumericAxis GrowBy="0.1,0.1"
                           AxisTitle="{mainVM:Localization YNumericAxis}" VisibleRange="{Binding VisibleRangeYAxis, Mode=TwoWay}" AutoRange="{Binding IsStaticYAxis, Converter={StaticResource StaticAxisToSciChartAutoRangeConverter}}" />
        </s:SciChartSurface.YAxis>
        <s:SciChartSurface.ChartModifier>
            <s:ModifierGroup>
                <s:SeriesValueModifier />
                <s:CursorModifier IsEnabled="{Binding IsShowValuesCursor}" />
                <s:LegendModifier x:Name="SciChartLegendModifier" GetLegendDataFor="AllSeries" ShowLegend="False"
                                  SeriesData="{Binding SeriesData, Mode=TwoWay}" />
            </s:ModifierGroup>
        </s:SciChartSurface.ChartModifier>
    </s:SciChartSurface>
Legend of chart placed in another panel
    <s:SciChartLegend x:Name="SciChartLegendControl" s:ThemeManager.Theme="Chrome" Margin="5,5" ScrollViewer.HorizontalScrollBarVisibility="Auto" ScrollViewer.VerticalScrollBarVisibility="Auto"
                      LegendData="{Binding SeriesData, Mode=OneWay}" ShowVisibilityCheckboxes="True" />
SeriesData is
private ChartDataObject _seriesData;
public ChartDataObject SeriesData
{
    get => _seriesData;
    set => SetProperty(ref _seriesData, value, nameof(SeriesData));
}
I want to see chart values in additional fields near the chart. I made this
<Grid>
    <Grid.ColumnDefinitions>
        <ColumnDefinition Width="Auto" />
    </Grid.ColumnDefinitions>
    <ListView Grid.Column="0" x:Name="ChartsListView" BorderBrush="Transparent" ItemContainerStyle="{StaticResource ListViewItemContainerDefaultStyle}"
              ItemsSource="{Binding SeriesData.SeriesInfo}">
        <ListView.ItemTemplate>
            <DataTemplate>
                <Grid>
                    <Grid.ColumnDefinitions>
                        <ColumnDefinition Width="*" />
                        <ColumnDefinition Width="Auto" />
                    </Grid.ColumnDefinitions>
                    <Label Grid.Column="0" Style="{StaticResource LabelDefaultStyle}"
                           Content="{Binding SeriesName}" Visibility="{Binding IsVisible, Converter={StaticResource BooleanToVisibilityConverter}}" />
                    <Label Grid.Column="1" Style="{StaticResource LabelIndicatorStyle}"
                           Content="{Binding YValue}" />
                </Grid>
            </DataTemplate>
        </ListView.ItemTemplate>
    </ListView>
</Grid>
All working correctly. But I want to bind Legend visibility checkboxes to my custom controls for values: when I uncheck chart checkbox control bound to this chart must becomes invisible. In code above I write
Visibility="{Binding IsVisible, Converter={StaticResource BooleanToVisibilityConverter}}"
but it not worked. How can I make it like I want?
And 3rd question: how can I guarantee the order of SeriesData lines? I have to be sure that charts in legend and custom controls ordered in the same ordering
- Fedor Iudin asked 1 month ago
- last active 1 month ago
Hello.
I’m facing an issue where a previous team member didn’t deactivate licenses on used devices. The device has now been returned, and deactivation is currently not possible. I need to reuse a project used SciChart. Is there a way to reset the list of all previously activated devices?
Thank you.
- LEE JW asked 4 months ago
- last active 4 months ago
This is my first time in this forum, and I am analyzing SCIChart. I am planning to use it in my software, but there are some questions I haven’t been able to answer yet.
My software is similar to an IDE, where the user can build their custom applications and run on windows environment, but we also provide an option to save all the interface in html and javascript. Since SCIChart provides not only WPF Charts but also javascript Charts, I would like to know the following:
1- Does the javascript charts have the same functionalities as the wpf charts? XY Charts or Pie charts for example, will they have the same functionalities in WPF and Javascript ?
2- Does the appearence of the charts in WPF and Javascript are the same? Do they look exatcly the same?
I believe these are my biggest doubts so far. Thanks in advance !!
- Fabio Pereira de Carvalho asked 1 year ago
- last active 1 year ago
Hello,
we are building an application where Charts are created/placed by the user in a form of editor.
We observed that the creation of the first Chart takes between 1 to 3 seconds (depending on the system) but the creation of subsequent Charts takes virtually no time (as it should be).
We assume that the creation of the first Chart involves some kind of time consuming initialization that is later used in the creation of subsequent Charts.
So we have researched if there is a way to do this initialization at the start of our application, so the user is not inconvenienced by a three second waiting time while placing the first Chart.
We discovered the “LoadLibrariesAndLicenseAsync”-function. However, it looks like it has no measurable effect.
Maybe we are using it wrong?
Here is an example code to illustrate the problem in a condensed manner:
Two charts are created and each time the time it takes to create them is measured.
The first creation takes about 1600 milliseconds, the second one only 2.
How can we make both creations only take a few milliseconds?
Thank you.
        // SciChartSurface.SetRuntimeLicenseKey("our key");

         await SciChart.Charting.Visuals.SciChart2DInitializer.LoadLibrariesAndLicenseAsync(
           "our key",
            null); //...does not seem to work

        Stopwatch sw = new Stopwatch();
        sw.Restart();//start stopwatch

        //creating the first Scichart with test data:

        SciChartSurface sciChartSurface = new SciChartSurface();

        XyDataSeries<double, double> xyDataSeries = new XyDataSeries<double, double>();
        xyDataSeries.AcceptsUnsortedData = true;
        FastLineRenderableSeries fastLineRenderableSeries = new FastLineRenderableSeries();
        fastLineRenderableSeries.DataSeries = xyDataSeries;
        sciChartSurface.RenderableSeries.Add(fastLineRenderableSeries);

        NumericAxis m_xAxis = new NumericAxis();
        NumericAxis m_yAxis = new NumericAxis();
        m_yAxis.AutoRange = AutoRange.Always;
        sciChartSurface.XAxis = m_xAxis;
        sciChartSurface.YAxis = m_yAxis;

        using (xyDataSeries.SuspendUpdates())
        {
            for (int i = 0; i < 100; i++)
                xyDataSeries.Append(i, Math.Sin(i));
        }

        Screen.Children.Add(sciChartSurface);//add first Scichart to grid
        sciChartSurface.Margin = new Thickness(0, 0, 500, 0);

        MessageBox.Show("time: "+sw.ElapsedMilliseconds); //////////  1610 Mlliseconds
        sw.Restart();//restart stopwatch

        //creating the second Scichart with test data:

        SciChartSurface sciChartSurface2 = new SciChartSurface();

        XyDataSeries<double, double> xyDataSeries2 = new XyDataSeries<double, double>();
        xyDataSeries2.AcceptsUnsortedData = true;
        FastLineRenderableSeries fastLineRenderableSeries2 = new FastLineRenderableSeries();
        fastLineRenderableSeries2.DataSeries = xyDataSeries2;
        sciChartSurface2.RenderableSeries.Add(fastLineRenderableSeries2);

        NumericAxis m_xAxis2 = new NumericAxis();
        NumericAxis m_yAxis2 = new NumericAxis();
        m_yAxis2.AutoRange = AutoRange.Always;
        sciChartSurface2.XAxis = m_xAxis2;
        sciChartSurface2.YAxis = m_yAxis2;

        using (xyDataSeries2.SuspendUpdates())
        {
            for (int i = 0; i < 100; i++)
                xyDataSeries2.Append(i, Math.Sin(i));
        }

        Screen.Children.Add(sciChartSurface2);//add second Scichart to grid
        sciChartSurface2.Margin = new Thickness(500, 0, 0, 0);

        MessageBox.Show("time: "+sw.ElapsedMilliseconds); //////////////////////////// 2 Mlliseconds
- Marc Vahldieck asked 1 year ago
- last active 1 year ago
When the GrowBy property on NumericAxis3D is specified, a tooltip modifier on the same 3D chart shows over data points that are not those under the mouse pointer.
To replicate the issue:
-
Clone the examples project from GitHub and open the SciChart2D3D.Examples solution.
-
In UniformColumn3D.xaml change the XAxis, YAxis, ZAxis and ChartModifier elements to the following, from line 101 onwards:
<s3D:SciChart3DSurface.XAxis> <s3D:NumericAxis3D AutoRange="Always" /> </s3D:SciChart3DSurface.XAxis> <s3D:SciChart3DSurface.YAxis> <s3D:NumericAxis3D AutoRange="Always" /> </s3D:SciChart3DSurface.YAxis> <s3D:SciChart3DSurface.ZAxis> <s3D:NumericAxis3D AutoRange="Always" /> </s3D:SciChart3DSurface.ZAxis> <s3D:SciChart3DSurface.ChartModifier> <s3D:TooltipModifier3D HoverDelay="150" CrosshairMode="Lines" ShowTooltipOn="MouseOver" /> </s3D:SciChart3DSurface.ChartModifier> -
Run the application and observe that the 3D Charts -> Basic Chart Types -> Uniform Column 3D chart shows a chart with correct tooltips appearing when the mouse is hovered over columns on the chart.
-
Add GrowBy=”0.1, 0.1″ to each axis property as follows:
<s3D:SciChart3DSurface.XAxis> <s3D:NumericAxis3D AutoRange="Always" GrowBy="0.1,0.1" /> </s3D:SciChart3DSurface.XAxis> <s3D:SciChart3DSurface.YAxis> <s3D:NumericAxis3D AutoRange="Always" GrowBy="0.1,0.1" /> </s3D:SciChart3DSurface.YAxis> <s3D:SciChart3DSurface.ZAxis> <s3D:NumericAxis3D AutoRange="Always" GrowBy="0.1,0.1"/> </s3D:SciChart3DSurface.ZAxis> -
Run the application again and hover the mouse over the same chart. Note that the tooltop is now shown for a data point different to whichever one the mouse is over at the time, which is incorrect.
- Stephen Hewlett asked 4 years ago
- last active 4 years ago
I can’t establish a runtime license in my application because the method doesn’t show up in the intellisense.
SciChartSurface.SetRuntimeLicenseKey.
In fact, no methods exist for this class (I’m assuming this is a static class and method). I’m getting this class via…
SciChart.Charting.Visuals.SciChartSurface.
I’m guessing that this is not where this class is located, but I can’t figure out where it is.
- Chris Kirkman asked 6 years ago
- last active 6 years ago
Is it possible to show a continuous vertical line as part of Data PointMarker in graph? We have managed to show text labels for our peaks using Data Points and point markers. We have used Sprite to display the TextBlock with peak labels. Now we need to show a vertical line starting from the label text up to the tip of peak. For readability we have kept a vertical space between the data point and the peak label. Hence sometimes it becomes difficult to find which peak points to which peak label. However there is no character to represent a long and continuous line. The OR character shows dotted line. Is there any other control we can use inside the sprite to show as a line?
- Anil Soman asked 4 years ago
I want to visualize the octave band.
How can I visualize it?
- Hyunji Jeon asked 2 years ago
- last active 2 years ago
I’m new to SciChart and have been following the tutorial provided by SciChart (SciChart WPF 2D Charts > Tutorials > MVVM). Took me hours to make it through the first step in Tutorial 02b – Creating a SciChartSurface with MVVM due to namespace typo in the tutorial, and again I’m now stuck at the very second step.
I cannot replicate the result in Tutorial 03b – Adding Series to a Chart with MVVM. No error found in the output, no binding error whatsoever, but the line is not visible. Also see the attached image comparing what it should look like in the tutorial and what mine looks like.
The project is a direct copy and paste from the tutorial except for the names. I have also cross checked against the code in GitHub. I’ve attached the project as a zip with the bin and obj folders removed.
- CJ Lo asked 4 months ago
- last active 4 months ago
Hi:
My name is Harold Ramírez and I have a question I would like you to answer because I don’t find any doucmentation about it online.
I have a WPF application with several charts, some of them in 3D. These 3D charts have the X axis in horizontal, Y in vertical and the Z in depth. I want only to keep the labels on the X and Y axis, on the left and bottom of the chart.
The only documentation I have found is this page: https://www.scichart.com/documentation/v5.x/webframe.html#Showing%20Axis%20Labels%20on%20one%20side%20of%20the%203D%20Chart.html, and only shows how to make it in XAML, but I need it to do it programatically in C#.
Thank you for your time.
Harold.
- Harold Ramirez asked 5 years ago
- last active 5 years ago
Requirements:
- Main graph updates based on the data from the selected Item.
- The data and styling is independent and the style is dynamic global style for all Items.
- The data for the graphing that is Data Series is binded to DataSet which is of type XYDataSeries<DateTime, double>.
- DataSeries data is obtained from the datacontext which implements INotifyPropertyChanged
Problem:
- The databinding is not dynamic and the data series is not updated when the selection changes.
- The initial data selection is reflected but any subsequent data changes are not reflected on the sci chart surface.
- This behavior was only for the Dataseries binding and it was verified using a textbox which binds to the count of the DataSet and this updates as the selection changes but not the dataseries.
Please suggest a work around or an alternative solution so that I can predefine axes and series but swap out the data based on the selected Item. Please see the attached xaml code below.
        <Grid>
        <Grid DockPanel.Dock="Top">
            <chart:SciChartSurface x:Name="mainView"
                                   OnRenderException="MainView_OnRenderException"
                                   Loaded="MainView_Loaded">
                <chart:SciChartSurface.YAxes>
                    <chart:NumericAxis x:Name="AxisOne"
                                       Id="Id1"
                                       AxisAlignment="Left"/>

                    <chart:NumericAxis x:Name="AxisTwo"
                                       Id="Id2"
                                       AxisAlignment="Left"/>

                </chart:SciChartSurface.YAxes>
                <chart:SciChartSurface.XAxis>
                    <chart:DateTimeAxis x:Name="DateTimeAxis"/>
                </chart:SciChartSurface.XAxis>
                <chart:SciChartSurface.RenderableSeries>
                    <chart:FastLineRenderableSeries x:Name="DataSet1FS"
                                                    DataSeries="{Binding DataSet1}"
                                                    YAxisId="Id1"
                                                    Stroke="Yellow"/>
                </chart:SciChartSurface.RenderableSeries>
            </chart:SciChartSurface>
        </Grid>
        <TextBlock Text="{Binding Path=DataSet1.Count}"
                            Margin="0 -20 0 0"
                            HorizontalAlignment="Right"
                            VerticalAlignment="Top"
                            Height="20"
                            Width="200"
                            Background="White"
                            Foreground="Black"/>
    </Grid>
- Arjun Sivaprasadam asked 1 year ago
- last active 1 year ago
Hello,
I’m using SciChart in our WPF project. And we are Keeping Series and Annotations as RadObservableCollection(from Telerik) instead of ObservableCollection to get the benefits of RadObservableCollection. But when I’m adding or deleting data from RadObservableCollection it does not affect in charts. Does SciChart work with RadObservableCollection ? I’ve explored your examples and wasn’t able to found examples with RadObservableCollection.
- Lusine Torosyan asked 1 year ago
- last active 1 year ago
I have a chart that has a DateTime XAxis and a NumericYAxis. I want to do something such as FastLineRenderableSeries.GetYValueAt(datetime) yet i can’t find a suitable extension method for such thing. Seems like a fairly simple thing but the documentation does not cover it.
- Clifford Bateman asked 5 years ago
- last active 5 years ago
