Hi,
Is there a property in XAML to display series name of each FastLineRenderableSeries? TIA
- Jhelyn Suan asked 3 years ago
- last active 3 years ago
Is it possible to plot a continuous vertical line as part of data point markers in line graph? I have used sprite to render text for data points. Now I want to draw a vertical line starting from data point till the peak apex to show which peak it is pointing to. The text labels in point markers are shifted to upward for some peaks to avoid collision and therefore there is a gap between peak apex and the point marker. So this requirement. I tried so far with OR symbol but it is displayed as a vertical dotted line when multiple OR symbols are placed one below another.
- Anil Soman asked 3 years ago
- last active 3 years ago
Hello,
On our SciChart’s XAxis we are using a NumericAxis and within the NumericAxis we bind to a LabelProvider. In the UI, this works perfectly and we get the XAxis appearing with the titles we desire (as strings writing over the numeric values 0, 1, 2, …). Meanwhile the YAxis doesn’t use any LabelProvider and stays numeric. The XAxis.LabelProvider is an IList of strings.
Although this works great in the UI, when I export the SciChart it does not pick up the LabelProvider and the exported image only contains the numeric values 0, 1, 2, … on the XAxis.
I do the export as following:
SciChartSurfaceBase.ExportToFile(filename, SciChart.Core.ExportType.Png, useXamlRenderSurface, exportedSize);
Is there a way to get the ExportToFile command to acknowledge the LabelProvider is there like it does with the UI?
Thank you!
Hannah
- Hannah Pate asked 3 years ago
- last active 3 years ago
SciChart is creating too much garbage objects/events* instead of reusing through pools (Analysis through dotMemory shows this). In complex applications this additional gc-pressure causes frequent lockups. (GC Pauses in 50-250ms+ range).
Top backtraces for GC-Problem:
– WeakEventTable.Purge
– Tick Rendering (TimeSpan, Strings)
– ProperyChangedEventManager.Purge
Top Types:
– WeakEventTable+EventKey
– HybridDictionary
– Double, String, TimeSpan
– Action
All of these top types/backtraces result directly from SciChart as we cross-verified with your 2D-Chart-Realtime-Series demo and by omitting the SciChart controls from our application. ( 2/3 of the total memory pressure comes from SciChart with even just 2 charts being present in our application, we see 5MB garbage memory traffic per 2 second, resulting in very frequent GC collections sporadically spiking into a high duration)
We currently use SciChart WPF V5, it seems SciChart WPF V6 Demo didnt fix this instead just using the LowLatency GC mode causing more frequent GC-collections causing worse overall performance in complex applications. (as we verfied in our application)
Is there plans to increase memory/object reuse/pooling and reduce events/actions? (70k allocations of events/actions for short time spans arent really understandable). What are those 70k events for simply rendering a chart with not much changing, see the attached image.
What settings/methods do you recommend to lower the Memory Pressure/WeakEvents resulting from SciChart usage?
What is the best rendering method to minimize GC pressure, we only require updates if new data becomes available through our application. Would it be manual?
Please comment
Thank you
- Hendrik Polczynski asked 3 years ago
- last active 3 years ago
Hello dear SciChart team,
Our customer has a new security program that starts on Dlls that are copied into a directory during runtime. At the moment has the customer the problem that this security program starts on an AbtLicensingNative.dll. This DLL is in the following directory:
% USERPROFILE% \ AppData \ Local \ SciChart \ Dependencies \ v.6.2.1.13304 \ x64.
For this reason the following questions:
Is this DLL safe?
Why is the dll only copied at runtime? Is there another solution for this?
best regards
Silvester
- Silvester Schneidt asked 3 years ago
- last active 3 years ago
With fifocapacity(XyDataSeries), memory behaves like an image. (Repeat ups and downs)
Is this due to fifocapacity(XyDataSeries)?
Capture : x = minutes , y = MB
- Daichi Takahashi asked 3 years ago
- last active 3 years ago
Hey Guys,
On a SciChart surface (CandleStickChart), how could I add LineAnnotation, BoxAnnotation, and TextBox annotation using TradingAnnotationCreationModifierMvvm (available under
ChartAnnotations/Trade Annotations sample). I have recreated a sample, based on the example.
Following is my XAML code,
Chart Surface: Modifiers.
<s:TradingAnnotationCreationModifierMvvm AnnotationViewModelType="{Binding DataContext.AnnotationCreationVM.AnnotationType, Source={StaticResource ROOT_OHLC_CHART_SPY}}"
                                                         AnnotationViewModelsCollection="{Binding LAnnotations}"
                                                         IsEnabled="{Binding DataContext.AnnotationCreationVM.IsAnnotationCreationEnable, Source={StaticResource ROOT_OHLC_CHART_SPY}, Mode=TwoWay}"
                                                         ReceiveHandledEvents="True">
                            <i:Interaction.Behaviors>
                                <ext:EventToCommandBehavior Command="{Binding DataContext.AnnotationCreationVM.AnnotationCreatedCommand, Source={StaticResource ROOT_OHLC_CHART_SPY}}"
                                                    Event="AnnotationCreated"
                                                    PassArguments="True" />
                            </i:Interaction.Behaviors>
                        </s:TradingAnnotationCreationModifierMvvm>
ParentView Buttons,
<ToggleButton Width="Auto" HorizontalAlignment="Stretch" Content="Line"
                                  Style="{StaticResource ChartToggleButton}"
                                  IsChecked="{Binding AnnotationCreationVM.Line}"
                                  CommandParameter="{x:Type s:LineAnnotationViewModel}"/>
                    <ToggleButton Width="Auto" HorizontalAlignment="Stretch" Content="Elliot Wave"  Grid.Row="1"
                                  Style="{StaticResource ChartToggleButton}"
                                  IsChecked="{Binding AnnotationCreationVM.EllioteWave}"
                                  CommandParameter="{x:Type dt:ElliotWaveAnnotationViewModel}"/>
                    <ToggleButton Width="Auto" HorizontalAlignment="Stretch" Content="Pitch Fork" Grid.Row="2"
                                  Style="{StaticResource ChartToggleButton}"
                                  IsChecked="{Binding AnnotationCreationVM.PitchFork}"
                                  CommandParameter="{x:Type dt:PitchforkAnnotationViewModel}"/>
                    <ToggleButton Width="Auto" HorizontalAlignment="Stretch" Content="Xabcd" Grid.Row="3"
                                  Style="{StaticResource ChartToggleButton}"
                                  IsChecked="{Binding AnnotationCreationVM.Xabcd}"
                                  CommandParameter="{x:Type dt:XabcdAnnotationViewModel}"/>
                    <ToggleButton Width="Auto" HorizontalAlignment="Stretch" Content="Head N Shoulders" Grid.Row="4"
                                  Style="{StaticResource ChartToggleButton}"
                                  IsChecked="{Binding AnnotationCreationVM.Hns}"
                                  CommandParameter="{x:Type dt:HeadAndShouldersAnnotationViewModel}"/>
                    <ToggleButton Width="Auto" HorizontalAlignment="Stretch" Content="Fibonacci Extension" Grid.Row="5"
                                  Style="{StaticResource ChartToggleButton}"
                                  IsChecked="{Binding AnnotationCreationVM.FibExt}"
                                  CommandParameter="{x:Type dt:FibonacciExtensionAnnotationViewModel}"/>
                    <ToggleButton Width="Auto" HorizontalAlignment="Stretch" Content="Fibonacci Retracement" Grid.Row="6"
                                  Style="{StaticResource ChartToggleButton}"
                                  IsChecked="{Binding AnnotationCreationVM.FibRetr}"
                                  CommandParameter="{x:Type dt:FibonacciRetracementAnnotationViewModel}"/>
ParentView view model,
public ICommand AnnotationCreatedCommand => new ActionCommand<AnnotationCreationMVVMArgs>(e =>
    {
        try
        {
            var annotation = e.NewAnnotationViewModel;
            if (annotation != null)
            {
                if (annotation is ITradingAnnotationViewModel tradingAnnotation)
                {
                    ((AnnotationBase)tradingAnnotation.Annotation).Selected += OnAnnotationSelectionChanged;
                    ((AnnotationBase)tradingAnnotation.Annotation).Unselected += OnAnnotationSelectionChanged;
                }
                annotation.IsEditable = true;
                annotation.CanEditText = true;
                annotation.IsSelected = true;

                FibRetr = false;
                FibExt = false;
                Hns = false;
                Xabcd = false;
                PitchFork = false;
                EllioteWave = false;
                Line = false;
            }

            IsAnnotationCreationEnable = false;
            IsAnnotationDrawn = false;

            OnPropertyChanged("IsAnnotationDrawn");
        }
        catch { }
    });

    private void OnAnnotationSelectionChanged(object sender, EventArgs eventArgs)
    {
        try
        {
            var parent = ((System.Windows.FrameworkElement)((System.Windows.FrameworkElement)sender).Parent).TemplatedParent;
            if(parent is SciChartSurface)
            {
                var surface = parent as SciChartSurface;
                if(null != surface)
                {
                    OHLCVChart chart = surface.DataContext as OHLCVChart;
                    Annotations = chart.LAnnotations;
                    SelectedAnnotation = Annotations.FirstOrDefault(x => x.IsSelected);
                }
            }
        }
        catch { }
    }
If there is any other way to club all Trading related annotations + TextBox, Line, TrendLine Annotations creation dynamically using any other modiefier, that will do. We are tying to build Trading charts: with Ability to add annotations.
Thanks.
- Roger Thomas asked 3 years ago
- last active 3 years ago
Hi,
I am having an issue with the SciChart graphs. I have attached an image – SciChartIssue.png, here which shows the issue. Our SciChart graph contains 8 channels of dataseries for EEG / EMG signals. By default the first channel is selected. When we select/deselect additional channels, they start showing up on the graph accordingly. The issue happens when a channel is de-selected. i.e. when any channel is de-selected, we are clearing that particular channel dataseries, while the other series is being appended and rendered using SuspendUpdates(). But on the graph, the waveform tends to move towards the extreme end of the chart (as seen from the image attached). we were initially using version 5.4 of Scichart. but i later updated it to v6.3, but still have the same issue.
If you are aware or have come across such an issue, then I would appreciate any help or advice from you. Since this is a vast and secure project, I am not able to share the entire code with you at this moment. However, I have attached a xaml & .cs file used to render the graph, If it helps.
Thanks!
- Terrence Joy asked 3 years ago
Hello,
I am trying to set the interval on the x-axis in a polar plot but it doesn’t appear to be accepting it and plotting accordingly. My axis definition is quite simple:
<s:SciChartSurface.XAxis>
       <s:PolarXAxis Name="TFxAxis" MajorDelta="15"/>
</s:SciChartSurface.XAxis>
I am plotting angles and radii so one data point might be (45, 1) and the next (50, 2) and so on where my visible range is TFxAxis.VisibleRange = new DoubleRange(-180.0, 180.0). Very simple plot but it keeps returning to a default of 1 on my MajorDelta for the x-axis and then showing major axes at 50 degree intervals. I’ve tried a variety of solutions but nothing seems to work properly.
Thanks,
Christina
- Christina Chomel asked 3 years ago
- last active 3 years ago
I have a custom chartmodifier I use for highlighting points on mouseover for my 2D plots and I want to create the same functionality for my 3D scatter plot. However, I can’t get it to work;
for the 2D plot I do
var series = ParentSurface.RenderableSeries[0];
var pt = GetPointRelativeTo(e.MousePoint, ModifierSurface);
double dataPointRadius = 8;
var result = series.HitTestProvider.HitTest(pt, dataPointRadius);
However, it seems that 3D plots don’t have a hittestprovider and that it’s not possible to define a radius for the hit test, so the code becomes
var series = ParentSurface.RenderableSeries[0];
var pt = GetPointRelativeTo(e.MousePoint, ModifierSurface);
var result = series.HitTest(pt);
However, result.IsHit is always false. What am I missing?
- Troels Jensen asked 3 years ago
Hello guys !
I am looking at the Composite Annotation example provided with the SDK that I downloaded a few days back.
I am somewhat confused on what assemblies I will need . The assemblies list you use is extensive and it is unclear to me what assemblies I need to include to apply this to my plot implementation.
The namespace
SciChart.Examples.Examples.AnnotateAChart.CompositeAnnotations is what I am looking at and what in that list of assemblies will I need to include to successfully implement Composite Annotation in our application ?
I work with a few models and views. Two of them, the ChartView and the PlotView respectively handles the charting surface , then the surrounding toggle buttons and such belongs to the PlotView.
What would be your recommendation how to begin implement this ?
Appreciate the support
Thank you
Cheers
Anders
- John-Anders Persson asked 3 years ago
- last active 3 years ago
I am having an issue with my Composite Annotation implementation.
I am using the example provided in the MeasureXyAnnotation.xaml that I found here.
My exception that is thrown (see exception attachment provided) complains about a missing Axis value.
In the public override void Update(ICoordinateCalculator xCoordCalc, ICoordinateCalculator yCoordCalc)
the yCoordCalc comes in with a null value. The xCoordCalc is populated and looks valid.
See attachment of my plotting area and well as the chart area. The composite annotation shows up alright, but as soon as I try to drag it the exception is immediately thrown.
I have no idea at this point why. I have tried to implement the annotation according to your example but obviously I am missing something.
Support getting this to work would be immensely appreciated.
Thank you
Anders
- John-Anders Persson asked 3 years ago
- last active 3 years ago
How do you set X1,X2 and Y1,Y2 in xaml as suggested in a previous post here on the forum?
I also get null values here when using Composite Annotations example. the suggestion to set the value DependencyProperty.SetCurrentValue(X1Property, 0.0); does not work since DependencyProperty does not expose a SetCurrentValue method (?)
I am using your example code for doing composite Annotations on my existing chart.
I am using MeasureXAnnotation and MeasureXyAnnotation and the respective Update method that is overidden.
What am I missing ?
Appreciate your help with getting this working
Thanks
Anders
- John-Anders Persson asked 3 years ago
- last active 3 years ago
I have a chart with multiple series, and I would like to have the RolloverModifier behavior for all selected series, but with a single tooltip combining the values for all selected series rather than a separate tooltip per series (similar to the CursorModifier)
Is there a way to do one of the following?
- Merge the tooltips from the RolloverModifier?
OR - Only show the vertical crosshair from the CursorModifier, and snap the crosshair to the closest point in the series?
The RolloverModifier is closer to the behavior I want, the only change I would want is the merged tooltip.
- Brandon Dybala asked 3 years ago
- last active 3 years ago
Hi,
I am developing an MVVM WPF application and need to access the SelectedPointMarkers property of DataPointSelectionModifier from the ViewModel.
From looking at the DataPointSelectionModifier documentation (https://www.scichart.com/documentation/win/current/webframe.html#DataPoint%20Selection.html) I can see how you can get the X and Y coordinate values of a selected point in a view, by binding the PointMarkersSelectionModifier to a listbox.
However this doesn’t really help me, I need to get the coordinates of the SelectedPointMarker into a property inside the ViewModel that can be accessed, rather than just binding to a listbox in the view itself.
I’ve also looked at this similar post: (https://www.scichart.com/questions/wpf/i-want-to-bind-selectedpointmarkers-of-datapointselectionmodifier), but I had no luck getting Kenishis solution to work in my case.
How can i do this?
Thanks.
- Sean Connell asked 3 years ago
- last active 3 years ago
Hello everybody,
I didnt find any answer to this. Is it possible to display data from year 0 to year 9999?
Until now i figuered out, that data from the year 834 to 9166 can be displayed. Beyond this range (eg to 9499) not data were displayed and the x-axis shows todays date.
Thanks for any help
Emanuel
- Emanuel Döser asked 3 years ago
- last active 2 years ago
Hello SciChart-Team,
I noticed that the columns in Sparse Column3D and in Uniform Column 3D always start at the XZ surface. Is there any option or way to do so, that columns always use the zero value of the Y axis as their starting point. The visible range of the axes should correspond to the minimum and maximum Y values.
The current behavior can be reproduced in the example SciChart_UniformColumn3D:
If the VisibleRange of the Y-axis goes from 0 to 0.5 then the columns with negative values go down (see screenshot 1)
As soon as the VisibleRange of the Y-axis goes from -0.5 to 0.5, the columns look like this (Screenshot2) We need the columns to look like in Screenshot 1, only that the Y-axis is also visible downwards.
Can the starting point of the columns be changed?
Best regards
Silvester
- Silvester Schneidt asked 3 years ago
- last active 1 year ago
Hi,
I’m trying to evaluate the reality of creating multiple realtime charts and I’m hitting a huge performance brick wall.
My application will have high speed streamed data coming in over ethernet. Currently I’m simulating this with a thread timer that updates 100 data objects at 60Hz. Screen data and chart updates I’ve got throttled to 30Hz but it’s still grinding my charts are still struggling. If I move the mouse pointer the charts freeze entirely until the mouse is still.
I want the end user to be able to choose any data object and chart it however they want. Adding charts and adding plots to charts etc. To enable this I’ve created a chart template as a user control and at runtime the charts are added to a panel on a tab control. Event one chart on one tab chugs though. Move the mouse over it and it locks up.
I have a single overview chart with a scrollbar over the top on the parent control. I need this to control the cursor (vertical line) and shared X visible range. Live data is Fifo limited to a 10 second range. All this works, just painfully slowly.
SharedXVisible range is MVVM bound. Renderable series is LineRenderableSeriesViewModel and data is pushed at 30Hz from a Data provider as per this tutorial:
https://www.scichart.com/documentation/win/current/Tutorial%2006b%20-%20Adding%20Realtime%20Updates%20with%20MVVM.html
CPU usage is sub 20%. Max frame rate is 30fps. Render priority doesn’t seem to make much difference, though “immediate” will lock up the whole app. I’m no expert at performance profiling but I’m not getting any clues from ReShaper dotTrace so far.
I tried creating a version that hand almost no binding and used codebehind to update the data. It didn’t seem to help. I’d rather not do this though as I have a lot of things working that I like such as vertical slice, annotations, templates etc.
I’ve got a list of all the live data on the right of the screen and it all updates rapidly, even while the mouse is moving and the charts are frozen.
I’m also using some Syncfusion controls and theming, if it matters.
I must be missing something obvious surely.
<!--  Define Chart  -->
        <s:SciChartSurface x:Name="chart" Grid.Row="0" Grid.Column="0"
                           Background="Black"
                           RenderPriority="low"
                           MaxFrameRate="30"
                           RenderableSeries="{s:SeriesBinding RenderableSeriesCollection}"
                           >

            <!--  Define X and Y Axis  -->
            <s:SciChartSurface.YAxis>
                <s:NumericAxis AutoRange="{Binding AxisYRangeMode}"
                               DrawMajorBands="False"
                               DrawMinorGridLines="false"
                               DrawMajorGridLines="True"
                               DrawMajorTicks="False"
                               DrawMinorTicks="False"
                               VisibleRange="{Binding AxisYVisibleRange}" />
            </s:SciChartSurface.YAxis>

            <s:SciChartSurface.XAxis>
                <s:NumericAxis AutoRange="{Binding AxisXRangeMode}"
                               BorderBrush="{StaticResource BorderBrushGray}"
                               BorderThickness="1"
                               DrawMajorBands="False"
                               DrawMinorGridLines="False"
                               DrawMajorGridLines="True"
                               DrawMajorTicks="False"
                               DrawMinorTicks="False"
                               TextFormatting="0"
                               VisibleRange="{Binding SharedXVisibleRange, Mode=TwoWay}"
                               s:VerticalSliceModifier.AxisLabelContainerStyle="{x:Null}"/>
            </s:SciChartSurface.XAxis>

            <!--  Modifiers  -->
            <s:SciChartSurface.ChartModifier>
                <s:ModifierGroup>
                    <s:RubberBandXyZoomModifier
                        IsXAxisOnly="True"
                        ZoomExtentsY="True"
                        IsAnimated="True"
                        RubberBandFill="#20FFFFFF"
                        RubberBandStroke="GreenYellow"
                        RubberBandStrokeDashArray="2 2">
                    </s:RubberBandXyZoomModifier>

                    <s:ZoomExtentsModifier IsAnimated="True"/>

                    <s:MouseWheelZoomModifier IsEnabled="True"/>

                    <s:XAxisDragModifier IsEnabled="True" DragMode="Pan"/>

                    <s:LegendModifier x:Name="legendModifier"
                                      Background="Transparent"
                                      Margin="10"
                                      GetLegendDataFor="AllSeries"
                                      LegendItemTemplate="{StaticResource CustomLegendTemplate}"
                                      ShowLegend="True" ShowVisibilityCheckboxes="True"/>

                    <s:VerticalSliceModifier Name="sliceModifier">

                    <s:VerticalSliceModifier.VerticalLines>
                            <s:VerticalLineAnnotation Style="{StaticResource sliceStyle}"
                                                      X1="{Binding SlicePosition, Mode=TwoWay}"/>
                        </s:VerticalSliceModifier.VerticalLines>
                    </s:VerticalSliceModifier>

                </s:ModifierGroup>
            </s:SciChartSurface.ChartModifier>
        </s:SciChartSurface>
Thanks in advance,
Declan.
PS. I’m trying to attach a screenshot but it keeps saying “Forbidden”.
- Declan Walsh asked 3 years ago
- last active 3 years ago
I am considering applying server-side licensing for my javerScript application.
In the document below, there is a phrase “Our server-side licensing component is written in C++.”
(https://support.scichart.com/index.php?/Knowledgebase/Article/View/17256/42/)
However, there is only asp.net sample code on the provided github.
(https://github.com/ABTSoftware/SciChart.JS.Examples/tree/master/Sandbox/demo-dotnet-server-licensing)
I wonder if there is a sample code implemented in C++ for server-side licensing.
Can you provide c++ sample code?
Also, are there any examples to run on Ubuntu?
- John Flemmer asked 2 years ago
- last active 4 weeks ago
Hi,
I am developing a desktop application using your SciChart WPF v6.5.1.26067 library. Right now, it is used on Windows 10 machines. It is working in all computers except for one. In this computer, we can’t make zoom or click on it to show more data. Could you tell me a reason? The machine system information is:
      Time of this report: 2/17/2022, 17:05:06
      Machine name: PA05009
      Machine Id: {54B0843D-6CE1-4289-A978-A41820074452}
      Operating System: Windows 10 Pro 64-bit (10.0, Build 19042) (19041.vb_release.191206-1406)
      Language: Spanish (Regional Setting: Spanish)
      System Manufacturer: Dell Inc.
      System Model: Vostro 3500
      BIOS: 1.9.0 (type: UEFI)
      Processor: 11th Gen Intel(R) Core(TM) i3-1115G4 @ 3.00GHz (4 CPUs), ~3.0GHz
      Memory: 8192MB RAM
      Available OS Memory: 7914MB RAM
      Page File: 7853MB used, 6461MB available
      Windows Dir: C:\WINDOWS
      DirectX Version: DirectX 12
      DX Setup Parameters: Not found
      User DPI Setting: 120 DPI (125 percent)
      System DPI Setting: 120 DPI (125 percent)
      DWM DPI Scaling: UnKnown
      Miracast: Available, with HDCP
      Microsoft Graphics Hybrid: Not Supported
      DirectX Database Version: 1.0.8
      DxDiag Version: 10.00.19041.0928 64bit Unicode
Thanks,
Harold.
- Harold Ramirez asked 2 years ago
- last active 2 years ago
Hello SciChart Team,
I have multiple charts in my application where all the charts are in the same MdofierGroup to show the RolloverModifier tooltip at the same time. As I want to show custom tooltip text, I have created a custom TooltipTemplate and TooltipContainerStyle. But now when the tooltip is shown on the left side the tooltip text is a long way from the marker. I want to align the tooltip text based on the tooltip position. When the tooltip is on the right side the text will be aligned left and when the tooltip is on left side the text will be aligned right.
I have attached some code snippets of my implementations, can you suggest me any way to achieve this?
<Style x:Key="_tooltipContainer" TargetType="scichart:TooltipControl">
        <Setter Property="Template">
            <Setter.Value>
                <ControlTemplate TargetType="scichart:TooltipControl">
                    <ContentPresenter Content="{TemplateBinding DataContext}"
                                          ContentTemplate="{TemplateBinding ContentTemplate}" />
                </ControlTemplate>
            </Setter.Value>
        </Setter>
    </Style>

    <DataTemplate x:Key="_tooltipTemplate" DataType="scichart:XySeriesInfo">
        <StackPanel Orientation="Vertical">
            <TextBlock FontSize="12" FontFamily="Rubik" Foreground="White">
                <TextBlock.Text>
                    .
                    .
                    .
                </TextBlock.Text>
            </TextBlock>
        </StackPanel>
    </DataTemplate>

    <!-- Style applied via x:Key name in ViewModel -->
    <Style TargetType="scichart:BaseRenderableSeries"  x:Key="_lineSeriesStyle">
        <Setter Property="RolloverMarkerTemplate">
            <Setter.Value>
                <ControlTemplate>
                    <Ellipse Width="7" Height="7" Stroke="White" StrokeThickness="1" />
                </ControlTemplate>
            </Setter.Value>
        </Setter>

        <Setter Property="scichart:RolloverModifier.TooltipContainerStyle" Value="{StaticResource _tooltipContainer}"/>
        <Setter Property="scichart:RolloverModifier.TooltipTemplate" Value="{StaticResource _tooltipTemplate}"/>
        <Setter Property="scichart:RolloverModifier.IncludeSeries" Value="True"/>
        <Setter Property="StrokeThickness" Value="2"/>
    </Style>


 <scichart:SciChartSurface RenderableSeries="{scichart:SeriesBinding ItsRenderableTimeGraphSeries}">


                                    <scichart:SciChartSurface.ChartModifier>
                                        <scichart:ModifierGroup DataContext="{Binding Path=DataContext, RelativeSource={RelativeSource FindAncestor, AncestorType={x:Type ItemsControl}}}"
                                                            scichart:MouseManager.MouseEventGroup="MouseEventGroup" >
                                            <scichart:RolloverModifier ShowTooltipOn="MouseHover" DrawVerticalLine="False" />
                                        </scichart:ModifierGroup>
                                    </scichart:SciChartSurface.ChartModifier>
.
.
.
</scichart:SciChartSurface>
In ViewModel:
ItsRenderableTimeGraphSeries = new ObservableCollection<IRenderableSeriesViewModel>
        {
            new MountainRenderableSeriesViewModel()
            {
                IsDigitalLine = false,
                StyleKey = "_lineSeriesStyle",
            }
        };
- Habibur Rahman asked 2 years ago
- last active 2 years ago
Is there a way to draw an svg formatted annotation onto a chart for WPF?
I have found references/examples for it in javascript here . . .
https://www.scichart.com/documentation/js/current/Tutorial%2006%20-%20Adding%20Annotations.html
but not for any other platform.
- Russell Hall asked 2 years ago
- last active 2 years ago
X, Z, Y are 2D (m x n) arrays of the same size.
How do I plot this as a 3D Surface mesh or a 2D Contour? I created a XyzDataSeries3D but when I set it to a SurfaceMeshRenderableSeries3D, it does not plot anything. But it does plot when using ScatterRenderableSeries3D.
I am basically trying to replicate the surf(X, Y, Z), contour(X, Y, Z) function in Matlab.
Attached is a test data that contain the X, Z and Y 2D arrays of size (261 x 10). The zip file contains an Excel file which has three sheets X, Z and Y that contain the data.
The images are of the Surf plot, and the Contour plot generated using Matlab. I need to generate these plots using SciChart instead of with Matlab.
- A Devadas asked 2 years ago
- last active 1 year ago
Is there a way to apply functionalities on signals as in average, slope, etc. ?
Thank you
Anders
- Anders Persson asked 2 years ago
- last active 2 years ago
Hello SciChart-Team,
we had the requirement to show the zero line when there are negative values in the chart.
We noticed the following things, especially in connection with the main grid lines.
There are some side effects at certain sizes of the window:
When the gridlines are on(see screenshot 1):
1. Grid line and tick are not on the same level (Only for certain sizes)
2. The grid line and horizontal annotation line (green) are not aligned either (Only at certain sizes)
3. The axis line (defined via BorderThickness) is also not aligned with the grid line (regardless of the size of the control).And the bottom tick is never aligned with the major grid line
If the major grid lines are switched off, the zero annotation line is not aligned to the ticks for certain sizes of the control (see screenshot 2)
It looks like different algorithms were used to calculate the line position of the ticks, grid lines and line annotations.
The problem was detected on the monitor with 100% scaling. On a 4K monitor with scaling > 100%, the problem became even more apparent
Do you have any suggestion how to solve the problem?
I’ve attached a modified example project in which the behavior can be reproduced.
Regards
Silvester Schneidt
- Silvester Schneidt asked 2 years ago
- last active 7 months ago
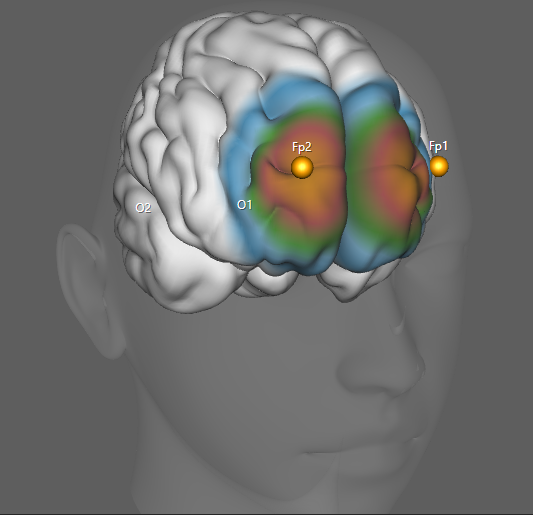
Is it possible to add color gradients to part of the mesh on an ObjectModel3D? We would love to use SciChart exclusively for our charts because they are easy to work with and almost all of the other charts in our software are SciChart charts.
Currently, we use LightningCharts for our 3D heads and the have a method call UpdateFill which applies a color gradient to part of the mesh. This shading is done using the geometry data generated from LightningCharts after the head is rendered. I didn’t see a similar method in SciChart but I don’t know that it is necessary because the geometry will be the same ever time the chart is rendered so we can just use the data generated from LightningCharts.
I’ve included a screenshot showing what I’ve been able to create with SciChart and a screenshot showing what the chart looks like currently with LightningCharts. The brain is a .obj file (along with the scalp and face but those are separate and don’t require any shading). The sensor locations (Fp1, Fp2, O1, and O2) are added using the ScatterRenderableSeries3D (I haven’t added annotations for the locations yet).

- Tim Stephansen asked 2 years ago
Hello SciChart team,
we have a problem with column series in 2D. At certain values in the X-axis, the bars in the chart overlap.
We found that the bar width is calculated incorrectly only from a certain distance between the values on the X-axis. There seems to be a bug in the calculation of the minimum bar width.
I’ve already seen issues related to a similar problem with the non-equidistant axis values and have already tried the “UseUniformWidth” property. Unfortunately without success. In principle, however, it seems to work with the non-equidistant axis values (ColumnChart1.png). As soon as the value is changed from 16 to 18, the bars overlap (ColumnChart2.png). In the application we need the width at 100%.
I’ve also attached an example project that can be used to reproduce the error.
Best regards
Silvester
- Silvester Schneidt asked 2 years ago
- last active 2 years ago
Hello all,
I was trying to export my SciChartSurface to bitmap, to save in a pdf.
First I tried ExportToBitmapSource(true/false, wantedSize) method. It leaded to StackOverflowException.
Then I tried to set explicitly the Height and Width and call the parameterless ExportToBitmapSource() method. It works fine, saves fine, but for a second I see the modified Height and Width and axes.
I tried them sync and async calls too.
Have you ever met these kind of functioning, or is the failure in me?
On my SciChart almost everything has predefined Style. Maybe that’s why the ExportToBitmapSource(true/false, wantedSize) dies while cloning the chart inside?
- László Jancsó asked 2 years ago
- last active 2 years ago
I want to customise BrightSpark theme from scratch.
In the page below, there is SciChartv4Dark theme’ s xaml.
https://www.scichart.com/documentation/win/current/webframe.html#Creating%20a%20Custom%20Theme.html
Can I get same thing for BrightSpark theme?
- Hiroyuki Seki asked 2 years ago
Sorry. My English is not good.
I have to mapping “Connector” image to 3D Cylindroid Chart.
But I do not know how.
Please let me know
- YOUNG MIN KO asked 2 years ago
- last active 2 years ago
Hi Team,
I am getting the error message Sorry! your trail of schichart has expired message is coming on the end user PC through we have purchased the developer license and activating the schichart using the runtime key provided in my account. Gone through the steps provided in here .
Also checked if there are any spaces in the license key. FYI, my developer license is expired and using the v5.4 with nuget.
- PRADNYA NAIKWADI asked 2 years ago
- last active 2 years ago
I want to visualize the octave band.
How can I visualize it?
- Hyunji Jeon asked 2 years ago
- last active 2 years ago
Hi All!
I have a syncfusion theme (MaterialDark) applied to my WPF app.
Without the theme applied, I can set the background color of a TextAnnotaion in the normal way in bothe XAML and c#, no problem.
When I apply the theme, it overrides this setting and renders the TextAnnotation with a black background and no matter what I try, I
can’t seem to get rid of it.
I have tried:
-
setting up a Resource dictionary in XAML
-
setting the style to null and then applying inline style (in both code behind and XAML)
Nothing seems to work!
Has anyone encountered this issue beforew or know of any solutions?
It’s driving me mad!
- Scott Green asked 1 year ago
- last active 1 year ago
Hello,
I am currently working on a proof of concept to move make our software cross platform. Currently, we use the WPF charting package but we have the full bundle so we have access to all the charts. I’m working on a Maui Blazor app where the UI and its logic are stored in a razor class lib and most of the services are stored in the shared WebAssembly project. Ideally, I would like to create the chart data inside a service and then create the appropriate views for each platform using the platform specific charts. Eventually my plan is to have a Blazor WASM project that we host online (where users can view their data), a Maui app that will run on Windows and Mac, and a WPF app that will host the project on computers that aren’t running Windows 10 and 11.
Are there any plans to implement a shared library of some type for the IRenderableSeriesViewModel, IDataSeries, IPaletteProvider, etc. where we could reference these interfaces regardless of platform?
Thank you,
Tim Stephansen
- Tim Stephansen asked 1 year ago
- last active 1 year ago
I’m having issues with displaying my vertical annotations on my chart. Below is the code for creating the annotation and adding it to the chart.
var annotationLine = new VerticalLineAnnotation();
annotationLine.XAxisId = XAxisID;
annotationLine.YAxisId = YAxisID;
annotationLine.Stroke = new SolidColorBrush(Colors.Blue);
annotationLine.StrokeThickness = 2;
annotationLine.IsHidden = false;
annotationLine.AnnotationCanvas = AnnotationCanvas.BelowChart;
annotationLine.Y1 = 0;
annotationLine.Y2 = ControlHeight;
annotationLine.X1 = xValues[i];
Surface.Annotations.Add(annotationLine);
I have verified that the XAxisId and the YAxisId are correct and match the id of the only axes that I have on the chart
I have verified that the xValues[i] is a valid value on the chart and within the bounds of the viewport
The tricky part here is that I am reading live streaming EEG data from a device and inserting manual triggers into the data. This works fine and the annotations appear in the chart as they are within the bounds of the chart.
I then record that data to a file (currently csv but will be doing EDF as soon as I get this figured out) where the annotation data is present (verified)
It’s when I try to read the file into my application that I can’t get the annotations to appear on the SciChart. I’m using the code above for both the live streaming data (working) and the file reading (not working) so I’m really baffled by this and could use any insight anyone has.
Thank you
- Tom Jorgensen asked 1 year ago
- last active 1 year ago
Hello,
I was trying to create a box-and-whisker diagram using the Box Plot chart. Here I found the whisker line is not showing in my case. I have tried versions 6.6.0.26505 and 6.5.1.26063. None of them worked. But, interestingly, it is working fine in version 6.5.0.13720.
I am sharing a sample project. Can you please check and let me know if there is any issue with the updated versions? Or if I am missing anything here?
- Habibur Rahman asked 1 year ago
- last active 1 year ago
Hello,
I am trying to generate a graph where the ticks and the labels will be added from TickProvier and LabelProvider. But when there is not enough space, it doesn’t show most of the labels, where it can only skip one label in the middle of two labels (Please check the attached photo). I can not set IsLabelCullingEnabled = true as I do not want any overlap on labels.
I have shared a sample project. Here, I always want to show all the ticks generated from the TickProvider. But how can I handle the labels, so that I can decide inside LabelProvider(Or any other place) if I should set a label empty or not based on the previous label position?
- Habibur Rahman asked 1 year ago
Requirements:
- Main graph updates based on the data from the selected Item.
- The data and styling is independent and the style is dynamic global style for all Items.
- The data for the graphing that is Data Series is binded to DataSet which is of type XYDataSeries<DateTime, double>.
- DataSeries data is obtained from the datacontext which implements INotifyPropertyChanged
Problem:
- The databinding is not dynamic and the data series is not updated when the selection changes.
- The initial data selection is reflected but any subsequent data changes are not reflected on the sci chart surface.
- This behavior was only for the Dataseries binding and it was verified using a textbox which binds to the count of the DataSet and this updates as the selection changes but not the dataseries.
Please suggest a work around or an alternative solution so that I can predefine axes and series but swap out the data based on the selected Item. Please see the attached xaml code below.
        <Grid>
        <Grid DockPanel.Dock="Top">
            <chart:SciChartSurface x:Name="mainView"
                                   OnRenderException="MainView_OnRenderException"
                                   Loaded="MainView_Loaded">
                <chart:SciChartSurface.YAxes>
                    <chart:NumericAxis x:Name="AxisOne"
                                       Id="Id1"
                                       AxisAlignment="Left"/>

                    <chart:NumericAxis x:Name="AxisTwo"
                                       Id="Id2"
                                       AxisAlignment="Left"/>

                </chart:SciChartSurface.YAxes>
                <chart:SciChartSurface.XAxis>
                    <chart:DateTimeAxis x:Name="DateTimeAxis"/>
                </chart:SciChartSurface.XAxis>
                <chart:SciChartSurface.RenderableSeries>
                    <chart:FastLineRenderableSeries x:Name="DataSet1FS"
                                                    DataSeries="{Binding DataSet1}"
                                                    YAxisId="Id1"
                                                    Stroke="Yellow"/>
                </chart:SciChartSurface.RenderableSeries>
            </chart:SciChartSurface>
        </Grid>
        <TextBlock Text="{Binding Path=DataSet1.Count}"
                            Margin="0 -20 0 0"
                            HorizontalAlignment="Right"
                            VerticalAlignment="Top"
                            Height="20"
                            Width="200"
                            Background="White"
                            Foreground="Black"/>
    </Grid>
- Arjun Sivaprasadam asked 1 year ago
- last active 1 year ago
Hello,
I’m using SciChart in our WPF project. And we are Keeping Series and Annotations as RadObservableCollection(from Telerik) instead of ObservableCollection to get the benefits of RadObservableCollection. But when I’m adding or deleting data from RadObservableCollection it does not affect in charts. Does SciChart work with RadObservableCollection ? I’ve explored your examples and wasn’t able to found examples with RadObservableCollection.
- Lusine Torosyan asked 1 year ago
- last active 1 year ago
Hi,
When hovering mouse over a graph, the box that appears showing the name and value gets cut off instead of flipping to remain in the area.
Can you please help me to overcome this issue or if any, idea or lead much appreciated. Please let me know if you need more information.
Please find the screenshot for your reference.
- Barani G asked 1 year ago
- last active 1 year ago
Hello,
I am trying to add a BoxAnnotation with MVVM pattern where the X-Axis is a DateTime axis. The annotation can be dragged into the X-direction. I need to know the DateTime of each position while dragging and also the final position(DateTime) of the BoxAnnotation when the drag Ended. I am listening to the DragDelta and DragEnded events in ViewModel. But here I couldn’t able to get the DateTime from X1 and X2 of that annotation model. I am sharing some snippets of my code. Can you please let me know how I can achieve this?
In xaml:
<Style x:Key="_boxAnnotationStyle" BasedOn="{StaticResource AnnotationBaseStyle}" TargetType="scichart:BoxAnnotation">
        <Setter Property="Template">
            <Setter.Value>
                <ControlTemplate TargetType="scichart:BoxAnnotation">
                    <Border x:Name="PART_BoxAnnotationRoot"
              Margin="{TemplateBinding Margin}"
              Background="{TemplateBinding Background}"
              BorderBrush="{TemplateBinding BorderBrush}"
              BorderThickness="{TemplateBinding BorderThickness}"
              CornerRadius="{TemplateBinding CornerRadius}" />
                </ControlTemplate>
            </Setter.Value>
        </Setter>
</Style>
<scichart:SciChartSurface x:Name="GraphSurface"
                 Annotations="{scichart:AnnotationsBinding ItsAnnotations}">

                <scichart:SciChartSurface.XAxis>
                    <scichart:DateTimeAxis x:Name="GraphXAxis"
                                           VisibleRange="{Binding ItsTimeVisibleRange, Mode=TwoWay}" />
                </scichart:SciChartSurface.XAxis>

                <scichart:SciChartSurface.YAxes>
                    <scichart:NumericAxis x:Name="GraphYAxis"
                                          VisibleRange="0, 10" />

                </scichart:SciChartSurface.YAxes>
 </scichart:SciChartSurface>
In ViewModel.cs
{
    private DateRange _timeVisibleRange;
    private ObservableCollection<IAnnotationViewModel> _annotations;
    private IAnnotationViewModel _boxAnnotation;
    public ObservableCollection<IAnnotationViewModel> ItsAnnotations
    {
        get
        {
            return _annotations;
        }
    }
    public DateRange ItsTimeVisibleRange
    {
        get { return _timeVisibleRange; }
        set
        {
            if (_timeVisibleRange == value) return;
            _timeVisibleRange = value;
            RaisePropertyChanged(() => ItsTimeVisibleRange);
        }
    }
    .
    .
    .
    _boxAnnotation = new BoxAnnotationViewModel()
        {
            IsEditable = true,
            DragDirections = SciChart.Charting.XyDirection.XDirection,
            X1 = DateTime.UtcNow.AddSeconds(300),
            X2 = DateTime.UtcNow,
            Y1 = 0,
            Y2 = 8,
            StyleKey = "_boxAnnotationStyle"
        };

     _annotations = new ObservableCollection<IAnnotationViewModel>() { };
     _annotations.Add(_boxAnnotation );

     _captureTimeRangeSelectorAnnotation.DragDelta += OnDrag;
     _captureTimeRangeSelectorAnnotation.DragEnded += DragEnded;
       .
       .
       .
    private void DragEnded(object sender, EventArgs e)
    {
         var boxAnnotationModel = sender as BoxAnnotationViewModel;
          // Need to know the DateTime value of X1 and X2
    }
    private void OnDrag(object sender, AnnotationDragDeltaEventArgs e)
    {
         var boxAnnotationModel = sender as BoxAnnotationViewModel;
         // Need to know the DateTime value of X1 and X2
    }
    .....
    .....
}
- Habibur Rahman asked 1 year ago
- last active 1 year ago
This is my first time in this forum, and I am analyzing SCIChart. I am planning to use it in my software, but there are some questions I haven’t been able to answer yet.
My software is similar to an IDE, where the user can build their custom applications and run on windows environment, but we also provide an option to save all the interface in html and javascript. Since SCIChart provides not only WPF Charts but also javascript Charts, I would like to know the following:
1- Does the javascript charts have the same functionalities as the wpf charts? XY Charts or Pie charts for example, will they have the same functionalities in WPF and Javascript ?
2- Does the appearence of the charts in WPF and Javascript are the same? Do they look exatcly the same?
I believe these are my biggest doubts so far. Thanks in advance !!
- Fabio Pereira de Carvalho asked 1 year ago
- last active 1 year ago
I am creating a graph for 10 data series using Scichart, with the most optimal legend placement for the graph being “Top” with Horizontal Orientation as shown in the code below. I would like to keep the spacing compact so all the data series can be visible without the need for the scrollbar, however because of the checkboxes for selecting each series being enabled I cannot compress the spaces to make all the data series visible. I did try using a custom legend with the typical binding but to no avail. I have attached an image of the current legend as well.
<s:LegendModifier Name="legendModifier" Margin="1" Width="1" ShowLegend="True" Orientation="Horizontal"
                                  HorizontalAlignment="Left" VerticalAlignment="Top"
                                  LegendPlacement="Top" ScrollViewer.HorizontalScrollBarVisibility="Auto"
                                  Visibility="Visible"/>
Is it possible to format the legend so as to keep all the series names visible while maintaining the checkboxes for displaying or hiding individual data series?
- Gil Owu asked 1 year ago
- last active 1 year ago
Hello,
we are building an application where Charts are created/placed by the user in a form of editor.
We observed that the creation of the first Chart takes between 1 to 3 seconds (depending on the system) but the creation of subsequent Charts takes virtually no time (as it should be).
We assume that the creation of the first Chart involves some kind of time consuming initialization that is later used in the creation of subsequent Charts.
So we have researched if there is a way to do this initialization at the start of our application, so the user is not inconvenienced by a three second waiting time while placing the first Chart.
We discovered the “LoadLibrariesAndLicenseAsync”-function. However, it looks like it has no measurable effect.
Maybe we are using it wrong?
Here is an example code to illustrate the problem in a condensed manner:
Two charts are created and each time the time it takes to create them is measured.
The first creation takes about 1600 milliseconds, the second one only 2.
How can we make both creations only take a few milliseconds?
Thank you.
        // SciChartSurface.SetRuntimeLicenseKey("our key");

         await SciChart.Charting.Visuals.SciChart2DInitializer.LoadLibrariesAndLicenseAsync(
           "our key",
            null); //...does not seem to work

        Stopwatch sw = new Stopwatch();
        sw.Restart();//start stopwatch

        //creating the first Scichart with test data:

        SciChartSurface sciChartSurface = new SciChartSurface();

        XyDataSeries<double, double> xyDataSeries = new XyDataSeries<double, double>();
        xyDataSeries.AcceptsUnsortedData = true;
        FastLineRenderableSeries fastLineRenderableSeries = new FastLineRenderableSeries();
        fastLineRenderableSeries.DataSeries = xyDataSeries;
        sciChartSurface.RenderableSeries.Add(fastLineRenderableSeries);

        NumericAxis m_xAxis = new NumericAxis();
        NumericAxis m_yAxis = new NumericAxis();
        m_yAxis.AutoRange = AutoRange.Always;
        sciChartSurface.XAxis = m_xAxis;
        sciChartSurface.YAxis = m_yAxis;

        using (xyDataSeries.SuspendUpdates())
        {
            for (int i = 0; i < 100; i++)
                xyDataSeries.Append(i, Math.Sin(i));
        }

        Screen.Children.Add(sciChartSurface);//add first Scichart to grid
        sciChartSurface.Margin = new Thickness(0, 0, 500, 0);

        MessageBox.Show("time: "+sw.ElapsedMilliseconds); //////////  1610 Mlliseconds
        sw.Restart();//restart stopwatch

        //creating the second Scichart with test data:

        SciChartSurface sciChartSurface2 = new SciChartSurface();

        XyDataSeries<double, double> xyDataSeries2 = new XyDataSeries<double, double>();
        xyDataSeries2.AcceptsUnsortedData = true;
        FastLineRenderableSeries fastLineRenderableSeries2 = new FastLineRenderableSeries();
        fastLineRenderableSeries2.DataSeries = xyDataSeries2;
        sciChartSurface2.RenderableSeries.Add(fastLineRenderableSeries2);

        NumericAxis m_xAxis2 = new NumericAxis();
        NumericAxis m_yAxis2 = new NumericAxis();
        m_yAxis2.AutoRange = AutoRange.Always;
        sciChartSurface2.XAxis = m_xAxis2;
        sciChartSurface2.YAxis = m_yAxis2;

        using (xyDataSeries2.SuspendUpdates())
        {
            for (int i = 0; i < 100; i++)
                xyDataSeries2.Append(i, Math.Sin(i));
        }

        Screen.Children.Add(sciChartSurface2);//add second Scichart to grid
        sciChartSurface2.Margin = new Thickness(500, 0, 0, 0);

        MessageBox.Show("time: "+sw.ElapsedMilliseconds); //////////////////////////// 2 Mlliseconds
- Marc Vahldieck asked 1 year ago
- last active 1 year ago
Hello!
I have a problem with disappearing points on refresh.
I have a measuring process in progress, so my new data coming continously. When the next data is added to my collection, it refreshes the whole graph (Clear, then re-add every point). Sometimes (sporadically) it happens, that some of my points are invisible, but after something changes (new point is added/zooming in the chart etc…) everything is back to normal again.
I have attached a gif, where I have all my 100 points arrived, but only 29 is visible. I need visible points every time.
(I am using ObservableCollection, when CollectionChanged is triggered, I clear my XyDataSeries and add every element from my collection.)
Could you please give me some hint?
Thank you!
- László Jancsó asked 1 year ago
Hello Scichart Team,
Can you guys provide me with some guidance to implement a custom IRenderableSeriesViewModel implementation that is supported in MVVM binding in Scichartsurface? Specifically, I’m looking to create a chart series that can be bound to my ViewModel and support custom styling and data handling.
I have tried following the tutorial found here…
Worked Example – CustomRenderableSeries in MVVM
https://www.scichart.com/documentation/win/current/webframe.html#Worked%20Example%20-%20CustomRenderableSeries%20in%20MVVM.html
I was getting a cast error from scicharts. I have attached the picture showing the detailed error.
Concerning the XAML code I have tried both the normal Binding keyword and s:SeriesBinding keyword to the RenderableSeries in the SciChartSurface.
Let me know how to go about this!
- Arjun Sivaprasadam asked 1 year ago
- last active 1 year ago
Hi Scichart Team,
I want to add two border lines on the top and left of the chart on the existing theme —“BrightSpark”, I searched and tried some IThemeProvider memebers but have no luck to solve it.
Please find the detail in attached pic, just like bottom and right sides, add two border lines on the other two sides.
- Keyu Yan asked 1 year ago
- last active 1 year ago
Hello,
I have several simple SciChartSurfaces in my WPF-grid. They are in the same WPF-column but in different WPF-rows, so they are arranged in a vertical manner.
I have noticed that the Y-Axis (a NumericAxis-objcet) moves automatically slightly to the left to make room for the numbers on the Y-Axis, if necessary.
I would like to ask if there is a way to “synchronize” the position of several similar Charts (or their Y-Axis´s, respectively.), so the different Y-Axis´s would always be in the same position. Ideally, the Y-Axis´s of all the Charts would move as far to the left as necessary to make room for the longest number of all the Axis´s.
I have attached an example of my current situation and the solution I would ideally like to achieve.
Is there any way to “connect” the different Axis of the charts to create the desired result?
Thank you.
- Marc Vahldieck asked 1 year ago
- last active 11 months ago
I want to create a chart like the attached image file.
I want to mark points with different colors depending on the number of data corresponding to the x and y axes.
As a result of searching, there is a HeatmapColorPalette. Is it good to use this?
If there is a more suitable chart, please introduce it.
thank you
- Seung Woo Jin asked 12 months ago
- last active 12 months ago
