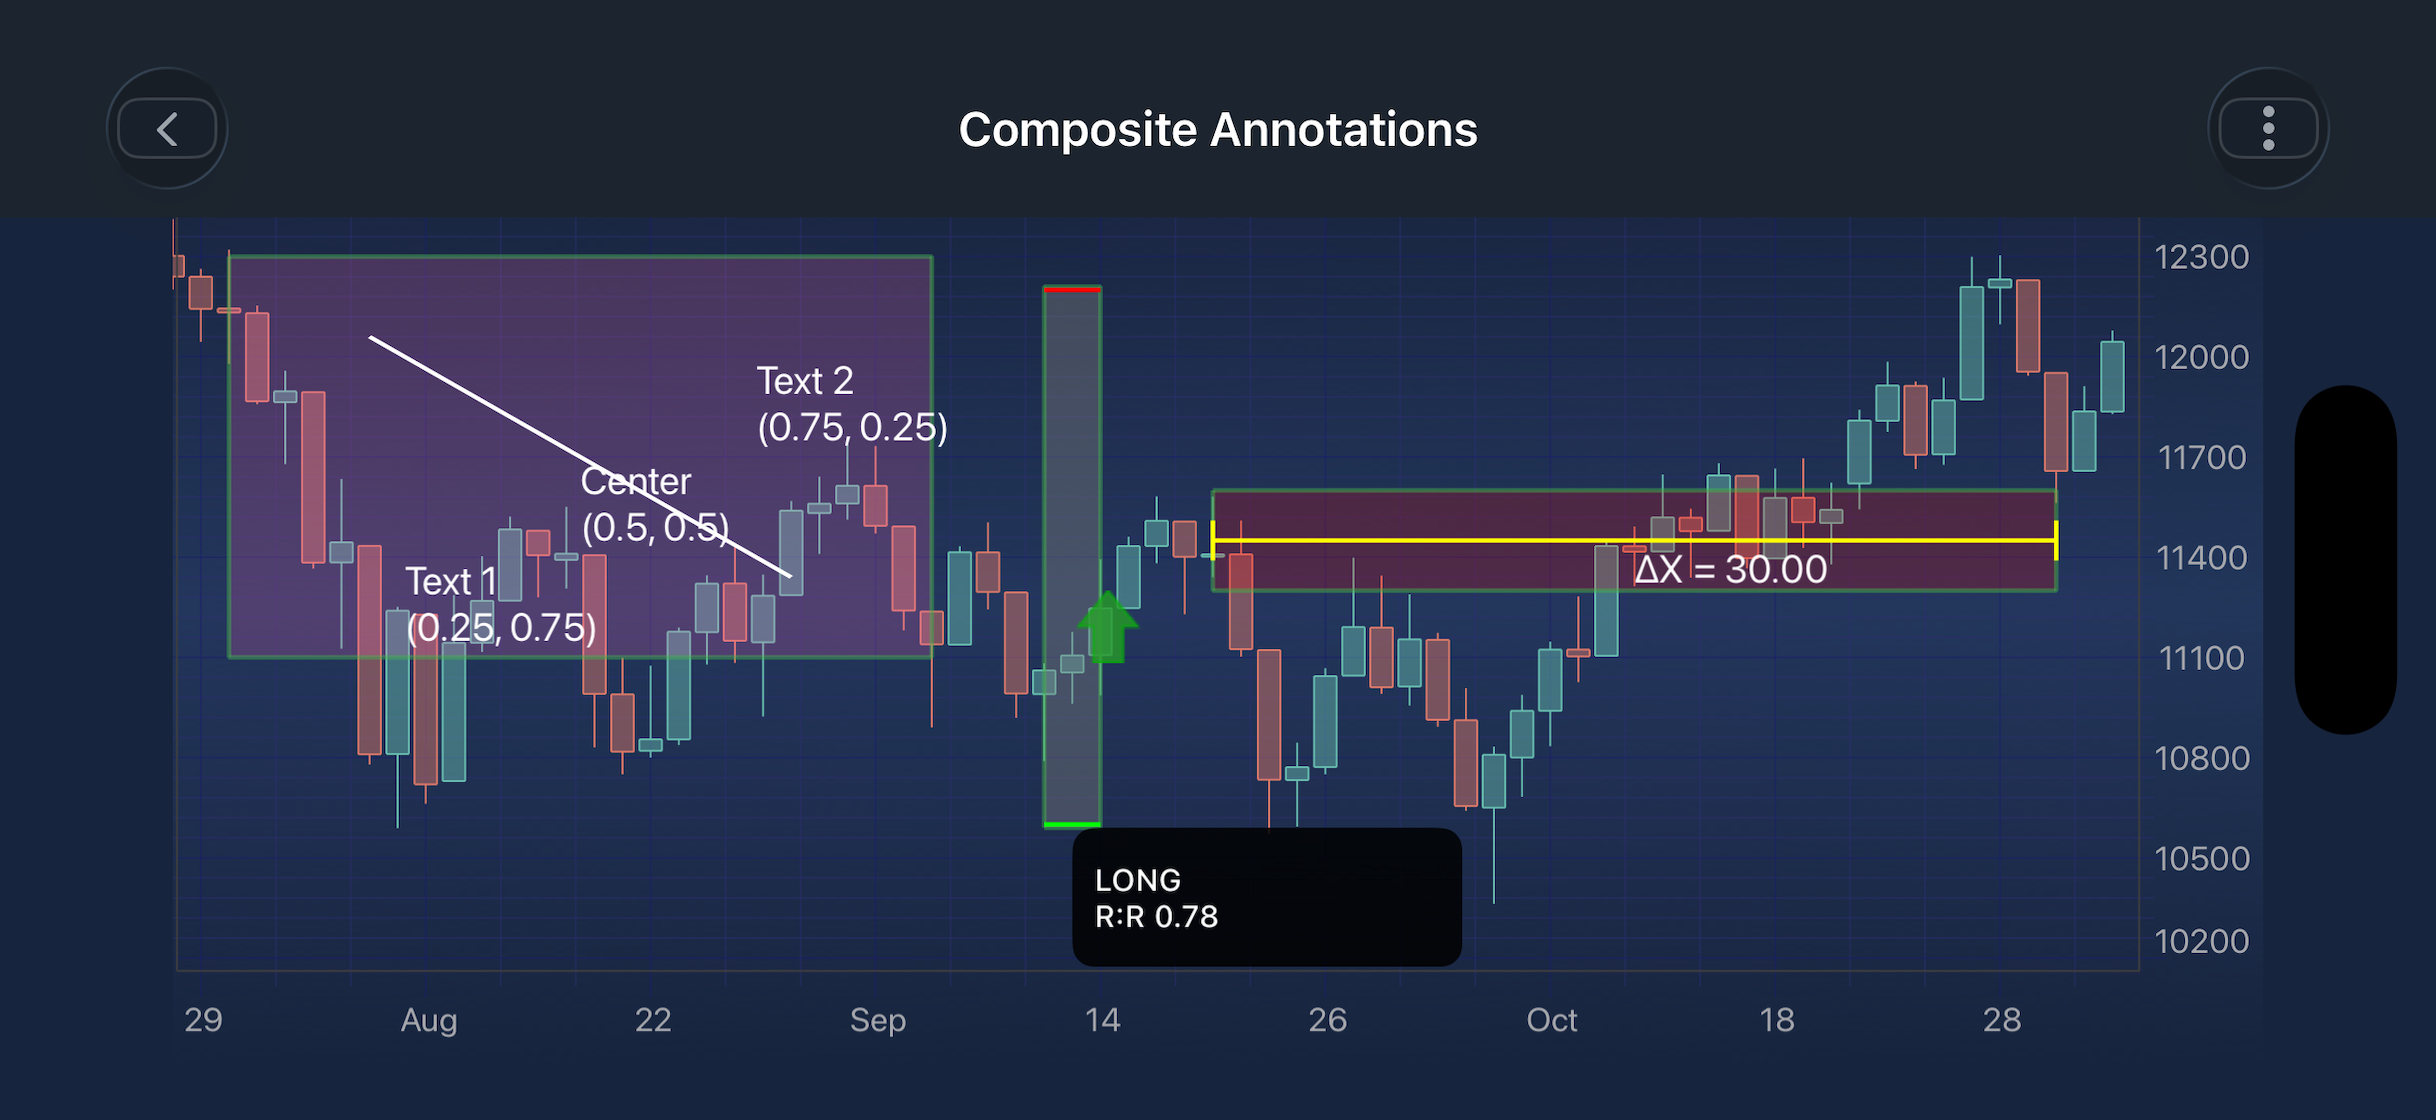
A SCICompositeAnnotation is a container annotation specific X1, X2, Y1, Y2 coordinates that allows you to group multiple child annotations and render them as a single logical unit on an SCIChartSurface. Each child annotation can use relative coordinate space (0–1) within the composite bounds, enabling scalable and reusable annotation layouts.
It inherits from SCIBoxAnnotation, meaning it also provides a resizable, draggable rectangular boundary that defines the coordinate space for its children.
The SCICompositeAnnotation class provides the SCICompositeAnnotation.borderPen and SCICompositeAnnotation.fillBrush properties, which are used for the annotation outline and background and expects the SCIPenStyle and SCIBrushStyle correspondingly.
To learn more about Pens and Brushes and how to utilize them, please refer to the SCIPenStyle, SCIBrushStyle and SCIFontStyle article.
A SCICompositeAnnotation is placed on a chart at the position determined by its [X1, Y1] and [X2, Y2] coordinates, which correspond to the top-left and bottom-right corners of the drawn rectangle.
Those can be accessed via the following properties:
// Assume a surface has been created and configured somewhere
id surface;
// Create a CompositeAnnotation
SCICompositeAnnotation *compositeAnnotation = [SCICompositeAnnotation new];
// Allow interaction at runtime
compositeAnnotation.isEditable = YES;
// In multi-axis scenario, specify axis IDs
compositeAnnotation.xAxisId = TopAxisId;
compositeAnnotation.yAxisId = LeftAxisId;
// Parent bounding box (chart coordinates)
// Defines the area where all child annotations live
[compositeAnnotation setX1:@(185.0)];
[compositeAnnotation setY1:@(12300.0)];
[compositeAnnotation setX2:@(210.0)];
[compositeAnnotation setY2:@(11100.0)];
// Fill color for composite background
compositeAnnotation.fillBrush = [[SCISolidBrushStyle alloc] initWithColorCode:0x33FF69BD];
// Optional: border styling (inherits from SCIBoxAnnotation)
compositeAnnotation.borderPen = [[SCISolidPenStyle alloc] initWithColorCode:0x99FF69BD thickness:2];
// Child Annotations (RELATIVE SPACE)
// Center Text Annotation
SCITextAnnotation *textAnnotationCenter = [SCITextAnnotation new];
// IMPORTANT: relative coordinate system (0 → 1 inside composite)
textAnnotationCenter.coordinateMode = SCIAnnotationCoordinateMode_Relative;
// Position at center of composite
[textAnnotationCenter setX1:@(0.5)];
[textAnnotationCenter setY1:@(0.5)];
textAnnotationCenter.text = @“Center\n(0.5, 0.5)”;
textAnnotationCenter.fontStyle = [[SCIFontStyle alloc] initWithFontSize:14 andTextColor:SCIColor.whiteColor];
// Diagonal Line Annotation
SCILineAnnotation *lineAnnotation = [SCILineAnnotation new];
// Relative coordinates inside composite bounds
lineAnnotation.coordinateMode = SCIAnnotationCoordinateMode_Relative;
// Draw diagonal line
[lineAnnotation setX1:@(0.2)];
[lineAnnotation setY1:@(0.2)];
[lineAnnotation setX2:@(0.8)];
[lineAnnotation setY2:@(0.8)];
lineAnnotation.stroke =
[[SCISolidPenStyle alloc] initWithColor:SCIColor.whiteColor thickness:2];
// Add child annotations to composite
compositeAnnotation.annotations =
[[SCIAnnotationCollection alloc] initWithCollection:@[
textAnnotationCenter,
lineAnnotation
]];
// Add composite annotation to surface
[self.surface.annotations add:compositeAnnotation];
// Assume a surface has been created and configured somewhere
let surface: ISCIChartSurface
// Create a CompositeAnnotation
let compositeAnnotation = SCICompositeAnnotation()
// Allow to interact with the annotation in run-time
compositeAnnotation.isEditable = true
// In a multi-axis scenario, specify the XAxisId and YAxisId
compositeAnnotation.xAxisId = “TopAxisId”
compositeAnnotation.yAxisId = “LeftAxisId”
// Specify a desired position by setting coordinates (parent bounding box)
// This defines the area in chart coordinates where all child annotations will live
compositeAnnotation.set(x1: 185.0)
compositeAnnotation.set(y1: 12300.0)
compositeAnnotation.set(x2: 210.0)
compositeAnnotation.set(y2: 11100.0)
// Specify the fill color for the composite container (background box)
compositeAnnotation.fillBrush = SCISolidBrushStyle(color: 0x33FF69BD)
// Optionally: border styling (since it inherits from SCIBoxAnnotation)
compositeAnnotation.borderPen = SCISolidPenStyle(color: 0x99FF69BD, thickness: 2)
// Child Annotations (ALL use relative coordinate space)
// Center Text Annotation
let textAnnotationCenter = SCITextAnnotation()
// IMPORTANT: child annotations use relative coordinates (0 → 1)
textAnnotationCenter.coordinateMode = .relative
// Position inside composite (center)
textAnnotationCenter.set(x1: 0.5)
textAnnotationCenter.set(y1: 0.5)
textAnnotationCenter.text = “Center\n(0.5, 0.5)”
textAnnotationCenter.fontStyle = SCIFontStyle(fontSize: 14, andTextColor: SCIColor.white)
// Diagonal Line Annotation
let lineAnnotation = SCILineAnnotation()
// Relative coordinates inside composite bounds
lineAnnotation.coordinateMode = .relative
// Draw a diagonal line across the composite area
lineAnnotation.set(x1: 0.2)
lineAnnotation.set(y1: 0.2)
lineAnnotation.set(x2: 0.8)
lineAnnotation.set(y2: 0.8)
lineAnnotation.stroke = SCISolidPenStyle(color: SCIColor.white, thickness: 2)
// Add child annotations to composite
compositeAnnotation.annotations =
SCIAnnotationCollection(collection: [
textAnnotationCenter,
lineAnnotation
])
// Add composite to surface
self.surface.annotations.add(items: compositeAnnotation)
NOTE: To learn more about other Annotation Types, available out of the box in SciChart, please find the comprehensive list in the Annotation APIs article.
 View on GitHub