 View on GitHub

iOS & macOS Charting Documentation - SciChart iOS & macOS Charts SDK v4.x
The SCIXabcdAnnotation
The SCIXabcdAnnotation is a specialized multi-point trading annotation used to draw harmonic patterns such as Gartley, Butterfly, Bat, and Crab. These patterns consist of five key points: X, A, B, C, and D, which help identify potential reversal zones in financial charts.
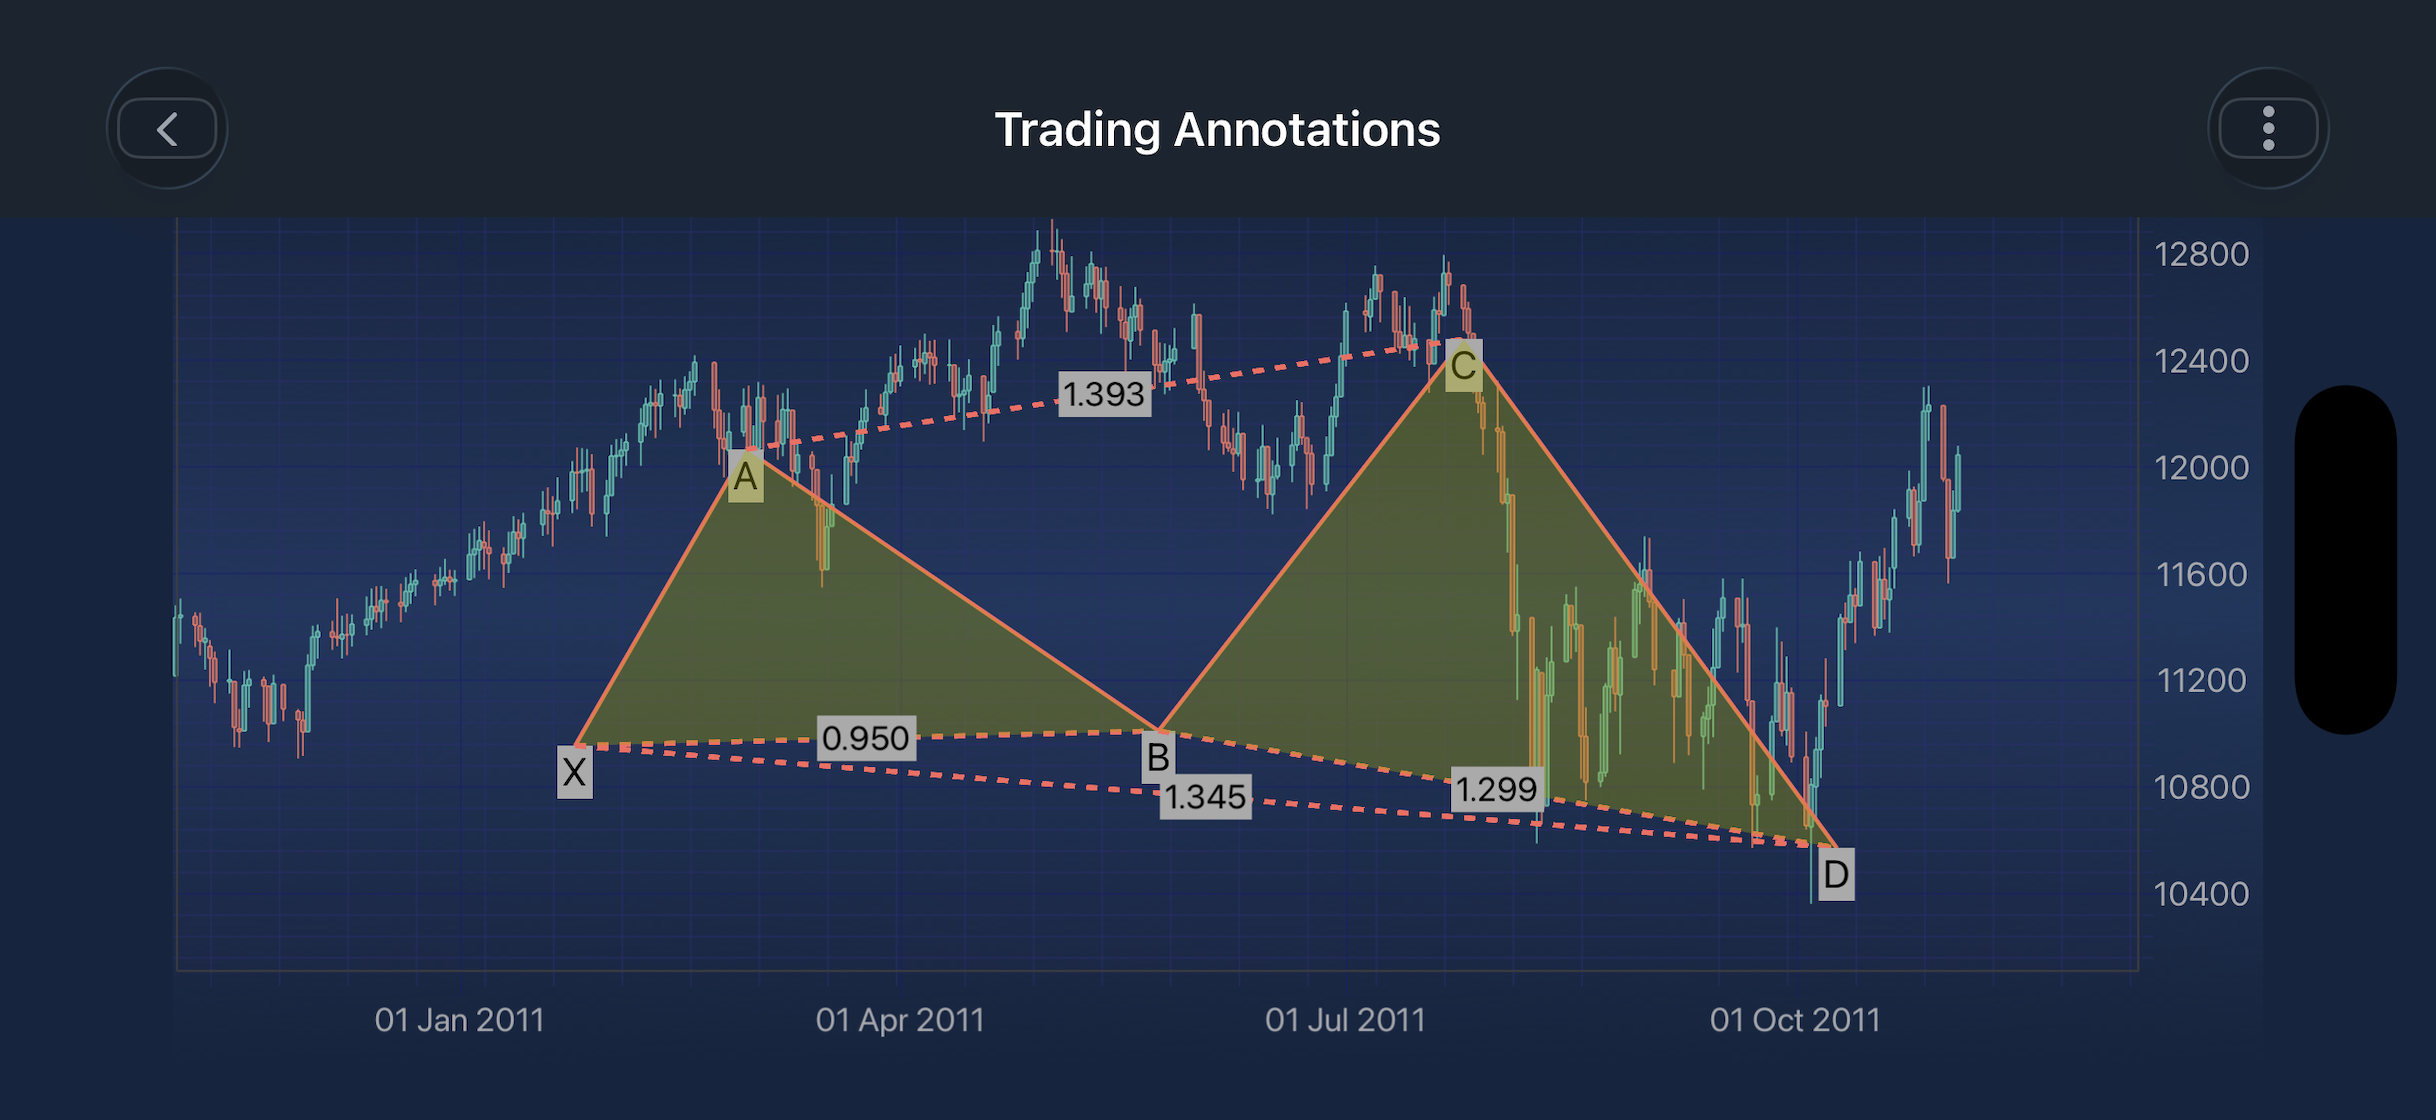
NOTE: Examples of the
Annotationsusage can be found in the SciChart iOS Examples Suite as well as on GitHub:
- Trading Annotations - Obj-C/Swift ̰
The SCICompositeAnnotation class provides the SCICompositeAnnotation.borderPen and SCICompositeAnnotation.fillBrush properties, which are used for the annotation outline and background and expects the SCIPenStyle and SCIBrushStyle correspondingly.
To learn more about Pens and Brushes and how to utilize them, please refer to the SCIPenStyle, SCIBrushStyle and SCIFontStyle article.
NOTE: To learn more about Annotations in general - please see the Common Annotation Features article.
Structure and Points
The SCIXabcdAnnotation is defined by five base points, added sequentially using the setBasePointWithX(:y) method:
- Point 0 (X): Starting point of the pattern
- Point 1 (A): First leg of the pattern
- Point 2 (B): Retracement from A
- Point 3 ©: Extension from B
- Point 4 (D): Final point completing the harmonic structure kDPointIndex = 4 indicates the index of the final D point.
Behavior
- Lines are drawn between XA, AB, BC, and CD.
- Additional helper (often dashed) lines may connect XB, AC, BD, and XD.
- Two filled regions are typically formed:
- Triangle XAB
- Triangle BCD
The SCIXabcdAnnotation can be configured using the properties and method listed in the table below:
| Field | Description |
|---|---|
SCIXabcdAnnotation.showRatios |
Determines whether calculated harmonic ratios are displayed on the chart. |
Define Points
Points are added sequentially using [annotation setBasePointWithX: y:];. Each call adds the next point in order (X → A → B → C → D).
The annotation is fully formed once all five points are provided.
NOTE: The xAxisId and yAxisId must be supplied if you have axis with non-default Axis Ids, e.g. in multi-axis scenario.
Create a XabcdAnnotation
A SCIXabcdAnnotation can be added onto a chart using the following code:
NOTE: For interactive creation of SCIXabcdAnnotation, use the corresponding annotation creation modifier SCIXabcdCreationModifier available in SciChart iOS.
NOTE: To learn more about other Annotation Types, available out of the box in SciChart, please find the comprehensive list in the Annotation APIs article.