 View on GitHub

iOS & macOS Charting Documentation - SciChart iOS & macOS Charts SDK v4.x
The SCIMeasureAnnotation
The SCIMeasureAnnotation measures the change between two points. It renders a rectangle, horizontal and vertical arrows and a dedicated measurement label. It is commonly used to analyze the magnitude and duration of a price swing, drawing a center line with arrowheads, a filled region indicating the measured range, and a label reporting the calculated change.
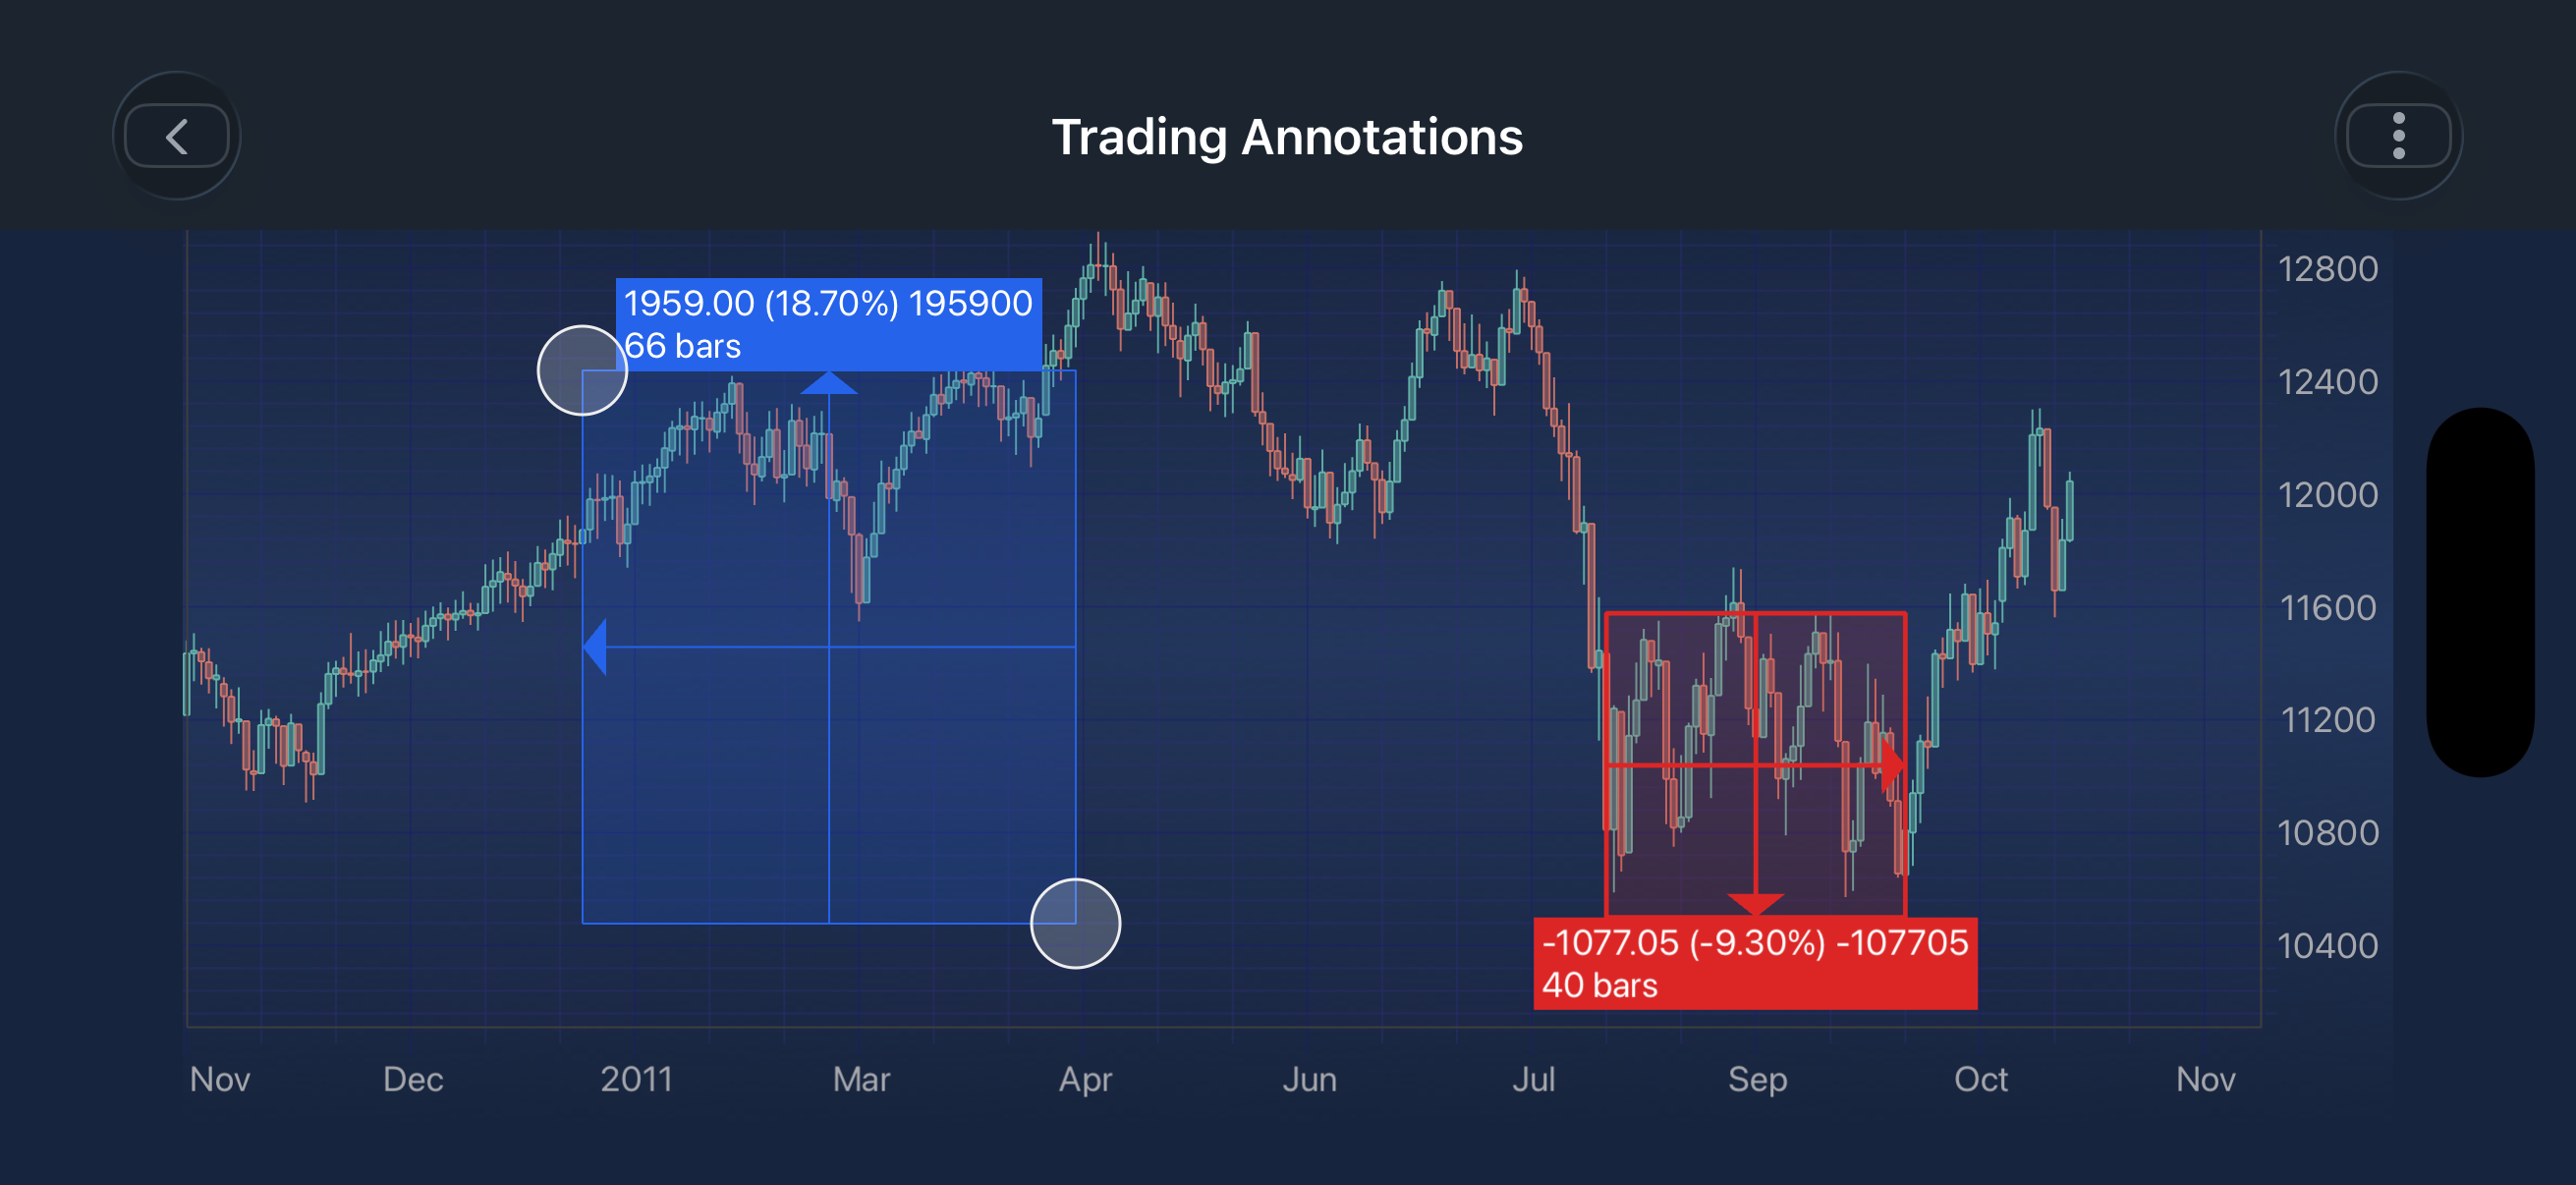
NOTE: Examples of the
Annotationsusage can be found in the SciChart iOS Examples Suite as well as on GitHub:
- Trading Annotations - Obj-C/Swift
NOTE: To learn more about Annotations in general - please see the Common Annotation Features article.
Structure and Points
The SCIMeasureAnnotation is defined by two base points, added sequentially using the setBasePointWithX(:y) method:
- Point 0: The starting anchor point of the measurement
- Point 1: The end point of the measurement
Behavior
- A center line is drawn between the two points, capped with an arrow head pointing toward the second point.
- A filled region is drawn around the measured range, bounded by the outline defined by the active stroke.
- The styling used depends on the relative position of the second point:
- If the second point is above the first, the
growingStrokeandgrowingFillare used. - If the second point is below the first, the
decliningStrokeanddecliningFillare used.
- If the second point is above the first, the
- A label is drawn showing the measured change, scaled by
yValueScaleFactor. The label background is taken from the currently active stroke colour (growing or declining).
The SCIMeasureAnnotation can be configured using the properties listed in the table below:
| Field | Description |
|---|---|
SCIMeasureAnnotation.growingStroke |
The SCIPenStyle used for the outline and centre line when the second point is above the first. |
SCIMeasureAnnotation.growingFill |
The SCIBrushStyle used to fill the measured area when the second point is above the first. |
SCIMeasureAnnotation.decliningStroke |
The SCIPenStyle used for the outline and centre line when the second point is below the first. |
SCIMeasureAnnotation.decliningFill |
The SCIBrushStyle used to fill the measured area when the second point is below the first. |
SCIMeasureAnnotation.arrowHeadLength |
The length of the centre line arrow head, in points. |
SCIMeasureAnnotation.arrowHeadWidth |
The width of the centre line arrow head, in points. |
SCIMeasureAnnotation.labelStyle |
The SCIFontStyle used by the measurement label. The label background is taken from the active stroke colour. |
SCIMeasureAnnotation.labelPadding |
The padding applied inside the measurement label. |
SCIMeasureAnnotation.yValueScaleFactor |
The factor applied to the price change to produce the scaled value shown in the label. Defaults to 100, reporting the change in basis-point style. |
SCIMeasureAnnotation.snapToCandles |
Determines whether the anchor points snap to whole candles. Only takes effect when the X-Axis is a category axis, where a data value is a bar index. |
Define Points
Points are added sequentially using [annotation setBasePointWithX: y:];. Each call adds the next point in order (Point 0 → Point 1).
The annotation is fully formed once both points are provided.
NOTE: The xAxisId and yAxisId must be supplied if you have axis with non-default Axis Ids, e.g. in multi-axis scenario.
Create a MeasureAnnotation
A SCIMeasureAnnotation can be added onto a chart using the following code:
NOTE: For interactive creation of SCIMeasureAnnotation, use the corresponding annotation creation modifier SCIMeasureCreationModifier available in SciChart iOS.
NOTE: To learn more about other Annotation Types, available out of the box in SciChart, please find the comprehensive list in the Annotation APIs article.