 View on GitHub

iOS & macOS Charting Documentation - SciChart iOS & macOS Charts SDK v4.x
The SCIFibonacciRetracementAnnotation
The SCIFibonacciRetracementAnnotation is a specialized two-point trading annotation used to plot Fibonacci retracement levels between two extreme points on a chart. A trendline connects the two points, and the vertical distance between them is divided by Fibonacci ratio levels placed at key percentages of that range (by default 0%, 23.6%, 38.2%, 50%, 61.8%, 78.6%, and 100%) to highlight potential support and resistance zones.
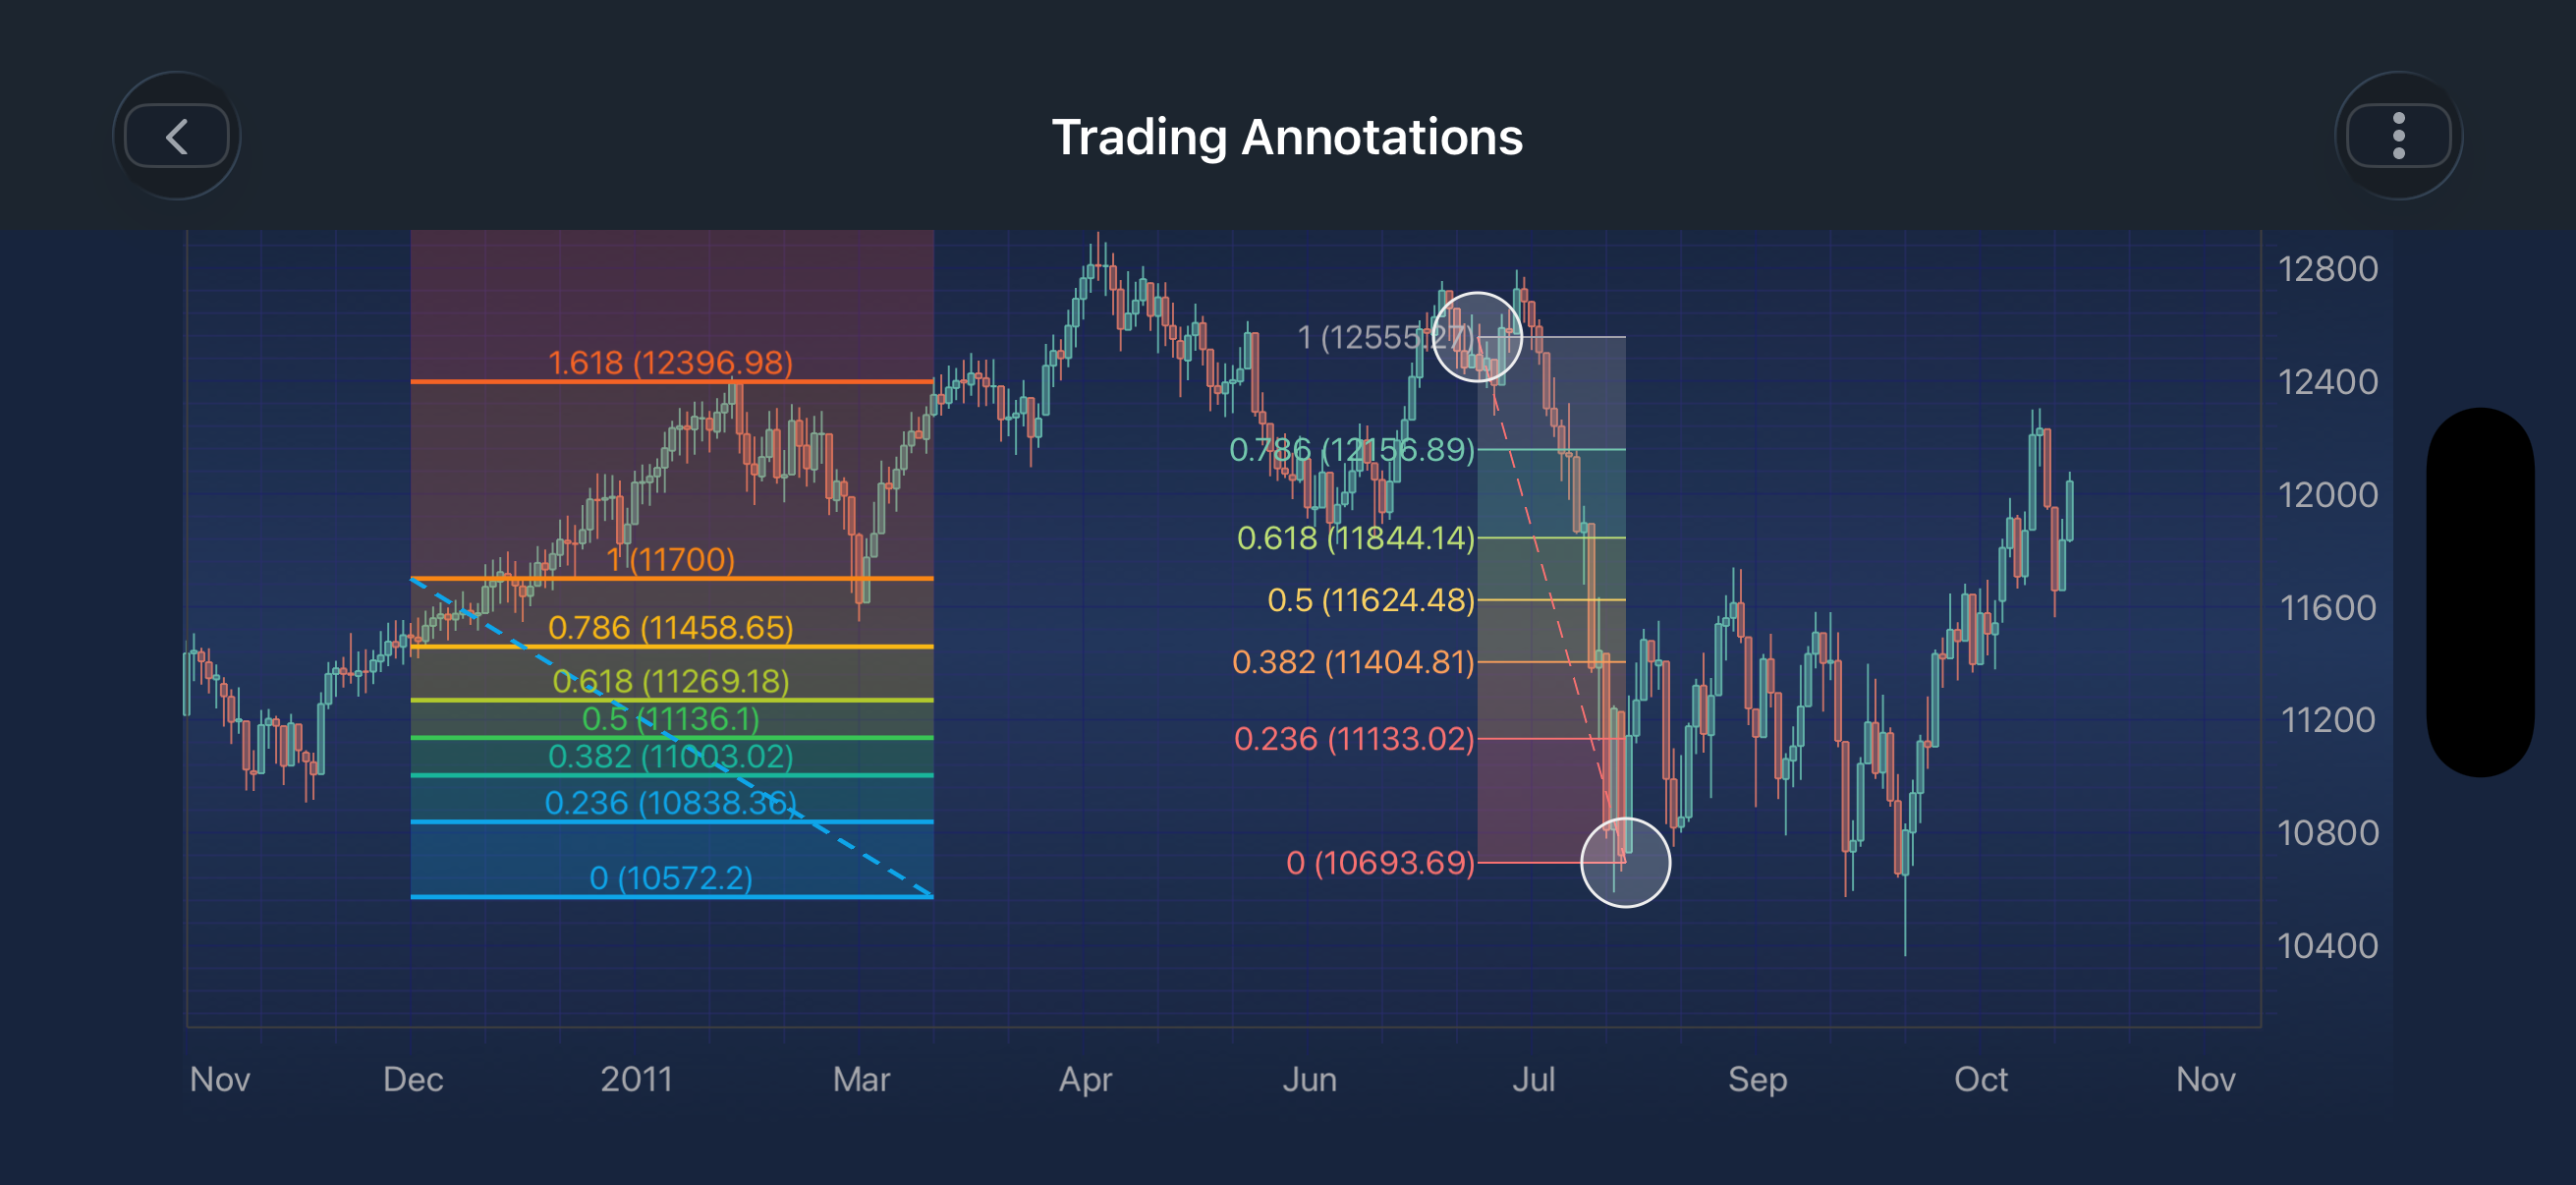
NOTE: Examples of the
Annotationsusage can be found in the SciChart iOS Examples Suite as well as on GitHub:
- Trading Annotations - Obj-C/Swift
NOTE: To learn more about Annotations in general - please see the Common Annotation Features article.
Structure and Points
The SCIFibonacciRetracementAnnotation is defined by two base points, added sequentially using the setBasePointWithX(:y) method:
- Point 0: The first extreme of the trend (start of the retracement)
- Point 1: The second extreme of the trend (end of the retracement)
Behavior
- An optional connector line (trendline) is drawn between the two base points when
showConnectorLineis enabled. - The vertical distance between the two base points is divided into ratio levels as defined by
levels, and a horizontal line is drawn at each level. - The regions between consecutive level lines are filled using
regionColors. The supplied colours are treated as a ramp and interpolated across all regions, so any number of colours may be provided. - Fill opacity for the regions is controlled independently via
fillOpacity. - A label showing the ratio (and, depending on configuration, price) is drawn alongside each level line; its position is controlled by
fibonacciLabelPlacementand its colour byfibonacciLabelColorMode.
The SCIFibonacciRetracementAnnotation can be configured using the properties listed in the table below:
| Field | Description |
|---|---|
SCIFibonacciRetracementAnnotation.levels |
Defines the Fibonacci ratios at which levels are drawn. Defaults to 0, 0.236, 0.382, 0.5, 0.618, 0.786, 1. |
SCIFibonacciRetracementAnnotation.regionColors |
Defines the colours used to fill the regions between levels. The supplied colours are treated as a ramp and interpolated to levels.count - 1 entries, so any number of colours may be provided. |
SCIFibonacciRetracementAnnotation.fillOpacity |
Defines the opacity applied to the filled regions, in the range 0.0 - 1.0. |
SCIFibonacciRetracementAnnotation.showConnectorLine |
Determines whether a connector line is drawn between the two base points. |
SCIFibonacciRetracementAnnotation.connectorLineStroke |
Defines the SCIPenStyle used to draw the connector line between the two base points. When nil, a dashed pen in the first region colour is used. |
SCIFibonacciRetracementAnnotation.fibonacciLabelPlacement |
Defines where the level labels are placed relative to their level line. Left places the label to the left of the line, Top places it above the middle of the line, and Inside places it inside the level region at the right end of the line. |
SCIFibonacciRetracementAnnotation.fibonacciLabelColorMode |
Defines how the level labels are coloured. MultiColor colours each label to match its level line, while SingleColor colours every label with the text colour of labelStyle. |
SCIFibonacciRetracementAnnotation.labelStyle |
Defines the SCIFontStyle used by the level labels. Its text colour is only used when fibonacciLabelColorMode is SCIFibonacciLabelColorMode_SingleColor; otherwise each label matches its level line’s colour. |
NOTE: The xAxisId and yAxisId must be supplied if you have axis with non-default Axis Ids, e.g. in multi-axis scenario.
Create a FibonacciRetracementAnnotation
A SCIFibonacciRetracementAnnotation can be added onto a chart using the following code:
NOTE: For interactive creation of SCIFibonacciRetracementAnnotation, use the corresponding annotation creation modifier SCIFibonacciRetracementCreationModifier available in SciChart iOS.
NOTE: To learn more about other Annotation Types, available out of the box in SciChart, please find the comprehensive list in the Annotation APIs article.