iOS & macOS charts - Examples
Please note! These examples are new to SciChart iOS v4 release! SciChart’s OpenGL ES and Metal iOS and Metal macOS Chart library ships with hundred of Objective-C and Swift iOS & macOS Chart Examples which you can browse, play with and view the source-code. All of this is possible with the new and improved SciChart iOS Examples Suite and demo application for Mac, which ships as part of the SciChart SDK.
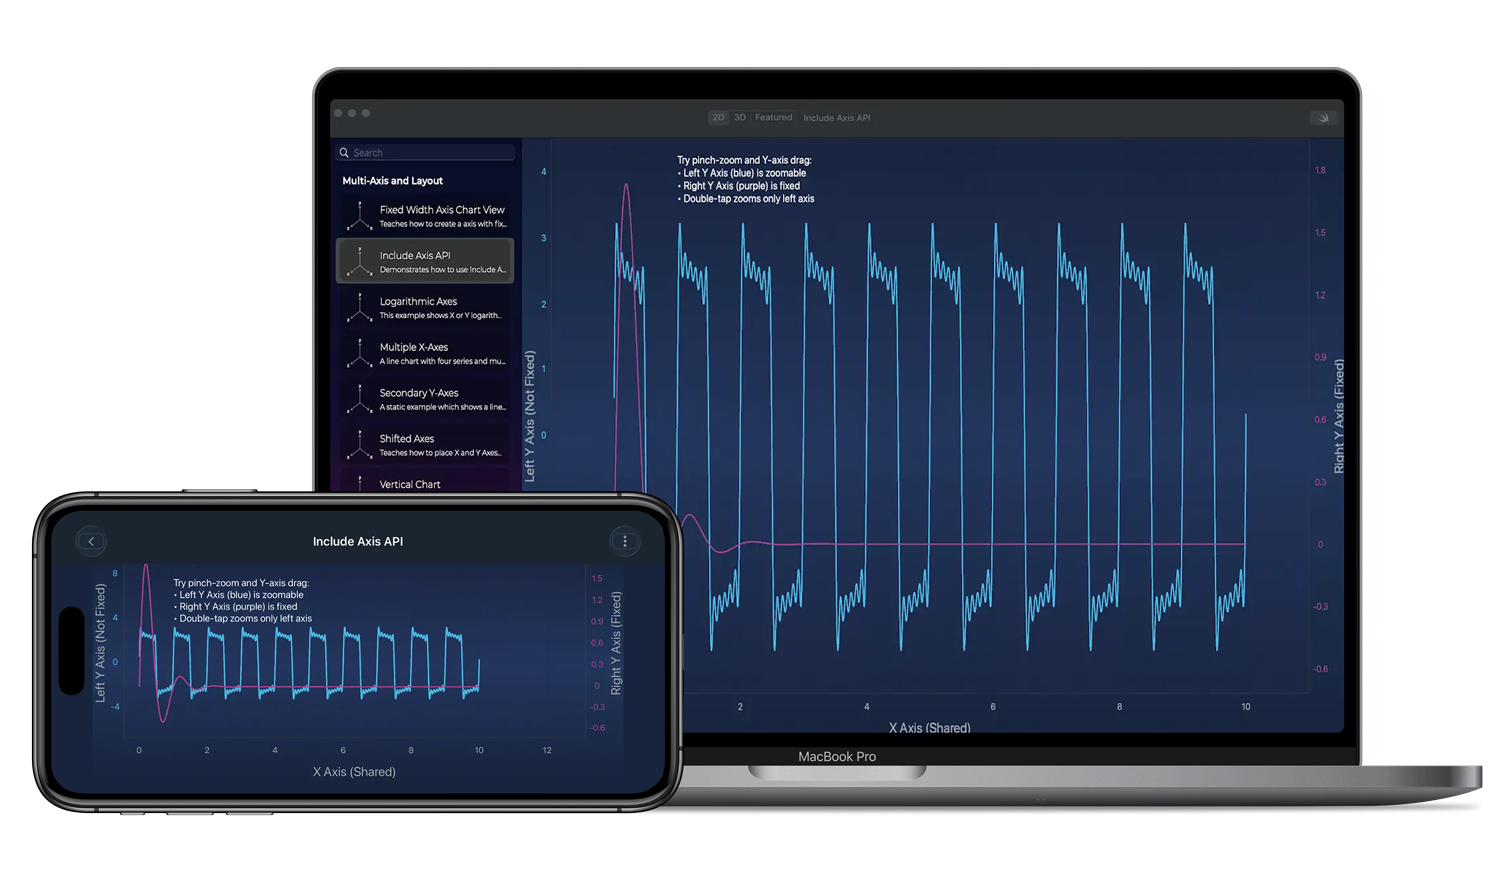
Demonstrates how to selectively include or exclude specific axes when applying chart interaction modifiers.
The Include Axis API allows fine-grained control over how gestures such as pinch, pan, axis drag, and zoom extents affect individual axes.
let pinchZoomModifier = SCIPinchZoomModifier()
// Exclude a specific X axis from pinch zoom
pinchZoomModifier.includeXAxis(xAxis, isIncluded: false)

// Include a specific Y axis in pinch zoom
pinchZoomModifier.includeYAxis(yAxis, isIncluded: true)
The Swift and Objective-C source code for the iOS & macOS Include Axis API example is included below (Scroll down!).
Did you know that we have the source code for all our example available for free on GitHub?
Clone the SciChart.iOS.Examples from Github.
Also the SciChart iOS and Scichart macOS Trials contain the full source for the examples (link below).
IncludeAxisModifiersView.swift
View source code//******************************************************************************
// SCICHART® Copyright SciChart Ltd. 2011-2019. All rights reserved.
//
// Web: http://www.scichart.com
// Support: support@scichart.com
// Sales: sales@scichart.com
//
// IncludeAxisModifiersView.swift is part of the SCICHART® Examples. Permission is hereby granted
// to modify, create derivative works, distribute and publish any part of this source
// code whether for commercial, private or personal use.
//
// The SCICHART® examples are distributed in the hope that they will be useful, but
// without any warranty. It is provided "AS IS" without warranty of any kind, either
// expressed or implied.
//******************************************************************************
class IncludeAxisModifiersView: SCDSingleChartViewController<SCIChartSurface> {
private let xAxisId = "xAxis"
private let yLeftAxisId = "yLeftAxis"
private let yRightAxisId = "yRightAxis"
override var showDefaultModifiersInToolbar: Bool { return false }
override var associatedType: AnyClass { return SCIChartSurface.self }
override func initExample() {
// MARK: - Axes
// Create X Axis
let xAxis = SCINumericAxis()
xAxis.axisId = xAxisId
xAxis.axisAlignment = .bottom
xAxis.axisTitle = "X Axis (Shared)"
xAxis.growBy = SCIDoubleRange(min: 0.1, max: 0.1)
// Create Left Y Axis
let yLeftAxis = SCINumericAxis()
yLeftAxis.axisId = yLeftAxisId
yLeftAxis.axisAlignment = .left
yLeftAxis.axisTitle = "Left Y Axis (Not Fixed)"
yLeftAxis.growBy = SCIDoubleRange(min: 0.1, max: 0.2)
yLeftAxis.tickLabelStyle = SCIFontStyle(fontSize: 12, andTextColorCode: 0xFF47BDE6)
// Create Right Y Axis
let yRightAxis = SCINumericAxis()
yRightAxis.axisId = yRightAxisId
yRightAxis.axisAlignment = .right
yRightAxis.axisTitle = "Right Y Axis (Fixed)"
yRightAxis.growBy = SCIDoubleRange(min: 0.1, max: 0.1)
yRightAxis.tickLabelStyle = SCIFontStyle(fontSize: 12, andTextColorCode: 0xFFAE418D)
// MARK: - Data Series
// Create data series for left axis
let leftData = SCDDataManager.getFourierSeries(withAmplitude: 1.0, phaseShift: 0.1, count: 5000)
let leftDataSeries = SCIXyDataSeries(xType: .double, yType: .double)
leftDataSeries.append(x: leftData.xValues, y: leftData.yValues)
// Create data series for right axis
let rightData = SCDDataManager.getDampedSinewave(withAmplitude: 3.0, dampingFactor: 0.005, pointCount: 5000, freq: 10)
let rightDataSeries = SCIXyDataSeries(xType: .double, yType: .double)
rightDataSeries.append(x: rightData.xValues, y: rightData.yValues)
// MARK: - Renderable Series
// Create renderable series for left axis
let leftSeries = SCIFastLineRenderableSeries()
leftSeries.dataSeries = leftDataSeries
leftSeries.xAxisId = xAxisId
leftSeries.yAxisId = yLeftAxisId
leftSeries.strokeStyle = SCISolidPenStyle(color: 0xFF47BDE6, thickness: 2.0, strokeDashArray: nil, antiAliasing: false)
// Create renderable series for right axis
let rightSeries = SCIFastLineRenderableSeries()
rightSeries.dataSeries = rightDataSeries
rightSeries.xAxisId = xAxisId
rightSeries.yAxisId = yRightAxisId
rightSeries.strokeStyle = SCISolidPenStyle(color: 0xFFAE418D, thickness: 2.0, strokeDashArray: nil, antiAliasing: false)
// MARK: - Modifiers
// Create ZoomPanModifier that ONLY works on LEFT Y AXIS
// This demonstrates selective axis inclusion
let zoomPanModifier = SCIZoomPanModifier()
zoomPanModifier.receiveHandledEvents = true
zoomPanModifier.includeYAxis(yRightAxis, isIncluded: false) // Include only left Y axis
// Create PinchZoomModifier that ONLY works on LEFT Y AXIS
// This demonstrates selective axis inclusion
let pinchZoomModifier = SCIPinchZoomModifier()
pinchZoomModifier.receiveHandledEvents = true
pinchZoomModifier.includeYAxis(yRightAxis, isIncluded: false) // Include only left Y axis
// Create Y Axis Drag Modifier that ONLY works on LEFT Y AXIS
let yAxisDragModifier = SCIYAxisDragModifier()
yAxisDragModifier.includeYAxis(yRightAxis, isIncluded: false) // Include only left Y axis
// Create X Axis Drag Modifier (works on X axis by default)
let xAxisDragModifier = SCIXAxisDragModifier()
// Create Zoom Extents Modifier that EXCLUDES the X AXIS
// This demonstrates selective axis exclusion
let zoomExtentsModifier = SCIZoomExtentsModifier()
zoomExtentsModifier.includeXAxis(xAxis, isIncluded: false) // exclude X axis
// MARK: - Annotation
let annotation = SCITextAnnotation()
annotation.text = """
Try pinch-zoom and Y-axis drag:
• Left Y Axis (blue) is zoomable
• Right Y Axis (purple) is fixed
• Double-tap zooms only left axis
"""
annotation.set(x1: 1)
annotation.set(y1: 3.5)
annotation.yAxisId = yLeftAxisId
annotation.xAxisId = xAxisId
annotation.verticalAnchorPoint = .bottom
annotation.fontStyle = SCIFontStyle(fontSize: 14, andTextColor: .white)
// MARK: - Chart Setup
SCIUpdateSuspender.usingWith(surface) {
self.surface.xAxes.add(items: xAxis)
self.surface.yAxes.add(items: yLeftAxis, yRightAxis)
self.surface.renderableSeries.add(items: leftSeries, rightSeries)
self.surface.annotations.add(annotation)
self.surface.chartModifiers.add(items:
zoomPanModifier,
pinchZoomModifier,
yAxisDragModifier,
xAxisDragModifier,
zoomExtentsModifier
)
}
}
}
