iOS & macOS charts - Examples
Please note! These examples are new to SciChart iOS v4 release! SciChart’s OpenGL ES and Metal iOS and Metal macOS Chart library ships with hundred of Objective-C and Swift iOS & macOS Chart Examples which you can browse, play with and view the source-code. All of this is possible with the new and improved SciChart iOS Examples Suite and demo application for Mac, which ships as part of the SciChart SDK.
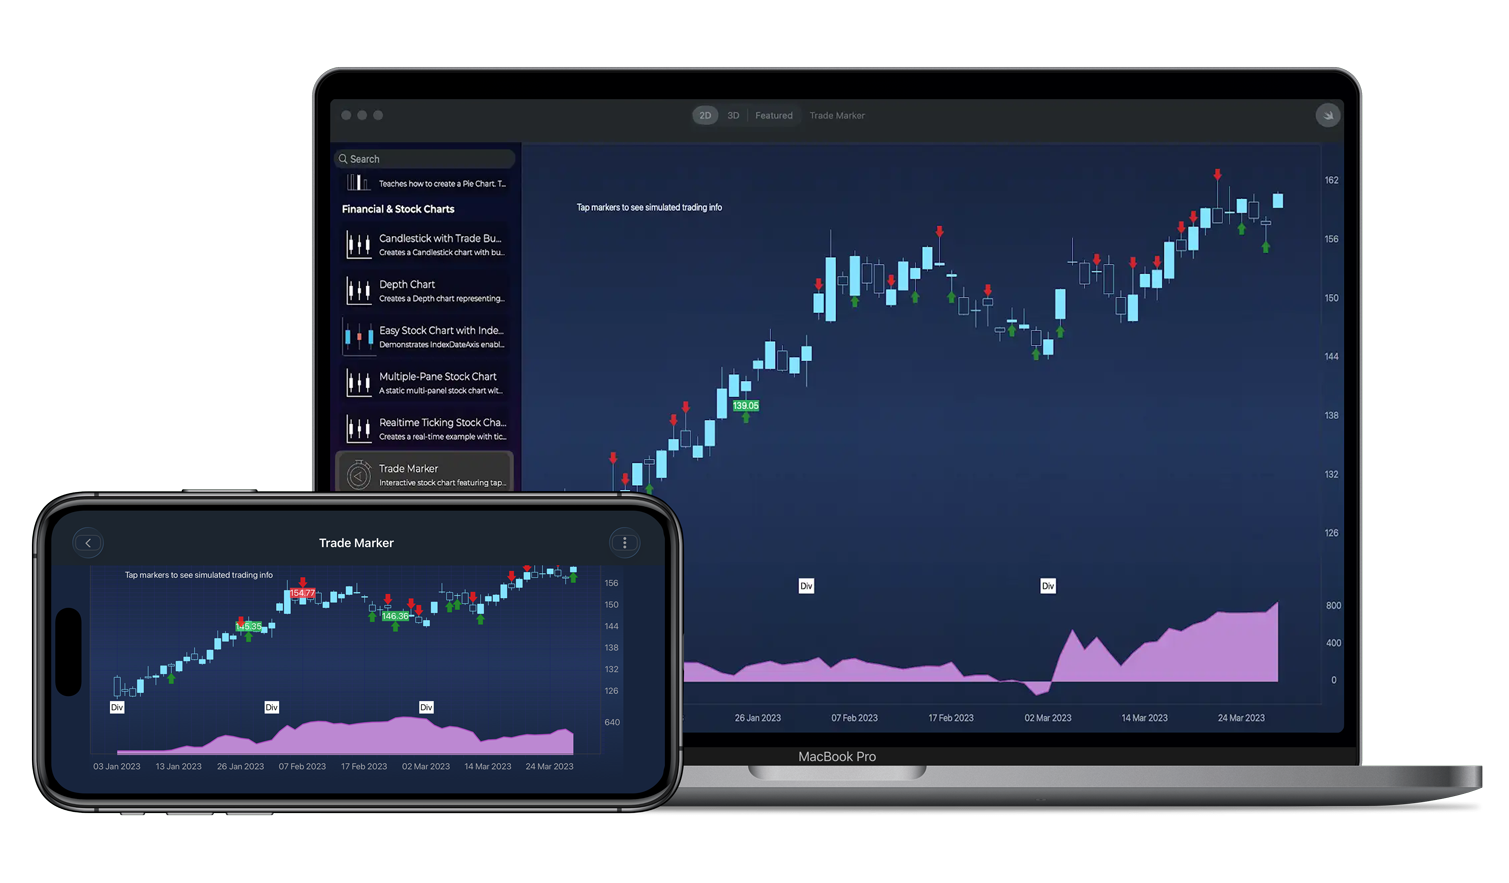
Shows how to visualize Buy and Sell trades directly on a stock chart using image annotations. Price labels make it easy to identify trade execution points at a glance. Trade markers are positioned using data coordinates and include configurable labels, styles, and alignment to represent execution price on financial charts.

The Swift and Objective-C source code for the iOS & macOS Trade Marker example is included below (Scroll down!).
Did you know that we have the source code for all our example available for free on Github?
Clone the SciChart.iOS.Examples from Github.
Also the SciChart iOS and Scichart macOS Trials contain the full source for the examples (link below).
BuySellMarkerAnnotationChartView.swift
View source code//******************************************************************************
// SCICHART® Copyright SciChart Ltd. 2011-2023. All rights reserved.
//
// Web: http://www.scichart.com
// Support: support@scichart.com
// Sales: sales@scichart.com
//
// BuySellMarkerAnnotationChartView.swift is part of the SCICHART® Examples. Permission is hereby granted
// to modify, create derivative works, distribute and publish any part of this source
// code whether for commercial, private or personal use.
//
// The SCICHART® examples are distributed in the hope that they will be useful, but
// without any warranty. It is provided "AS IS" without warranty of any kind, either
// expressed or implied.
//******************************************************************************
class StackedYAxisLayoutStrategy: SCIVerticalAxisLayoutStrategy {
override func measureAxes(withAvailableWidth width: CGFloat, height: CGFloat, andChartLayoutState chartLayoutState: SCIChartLayoutState) {
for i in 0 ..< axes.count {
let axis = axes[i] as! ISCIAxis
axis.updateMeasurements()
let requiredAxisSize = SCIVerticalAxisLayoutStrategy.getRequiredAxisSize(from: axis.axisLayoutState)
chartLayoutState.rightOuterAreaSize = max(requiredAxisSize, chartLayoutState.rightOuterAreaSize)
}
}
override func layout(withLeft left: CGFloat, top: CGFloat, right: CGFloat, bottom: CGFloat) {
let count = axes.count
let height = bottom - top
let ratios: [CGFloat] = [0.8, 0.2]
var topPlacement = top
for i in 0 ..< count {
let axis = axes[i] as! ISCIAxis
let axisLayoutState = axis.axisLayoutState
let axisHeight = height * ratios[i]
let bottomPlacement = topPlacement + axisHeight
let requiredAxisSize = SCIVerticalAxisLayoutStrategy.getRequiredAxisSize(from: axisLayoutState)
axis.layoutArea(withLeft: left, top: topPlacement, right: left + requiredAxisSize, bottom: bottomPlacement)
topPlacement = bottomPlacement
}
}
}
class BuySellMarkerAnnotationChartView: SCDSingleChartViewController<SCIChartSurface> {
override var associatedType: AnyClass { return SCIChartSurface.self }
override var showDefaultModifiersInToolbar: Bool { return false }
override func initExample() {
let historicalData = SCIOhlcDataSeries(xType: .date, yType: .double)
let priceSeries = SCDDataManager.getPriceDataIndex()
let dateData = priceSeries.dateData
let indexDataProvider = SCIDataSeriesIndexDataProvider(dataSeriesValues: historicalData)
let xAxis = SCIIndexDateAxis()
xAxis.setIndexDataProvider(indexDataProvider)
xAxis.visibleRange = SCIDateRange(min: dateData.getValueAt(0), max: dateData.getValueAt(30))
xAxis.growBy = SCIDoubleRange(min: 0.05, max: 0.05)
let xAxis1 = SCINumericAxis()
xAxis1.axisId = "balance"
xAxis1.isVisible = false
let yAxis = SCINumericAxis()
yAxis.autoRange = .never
yAxis.growBy = SCIDoubleRange(min: 0.1, max: 0.1)
yAxis.axisAlignment = .right
let balanceYAxis = SCINumericAxis()
balanceYAxis.axisId = "Balance"
balanceYAxis.growBy = SCIDoubleRange(min: 0.1, max: 0.1)
balanceYAxis.axisAlignment = .right
balanceYAxis.autoRange = .never
historicalData.append(x: dateData, open: priceSeries.openData, high: priceSeries.highData, low: priceSeries.lowData, close: priceSeries.closeData)
let historicalPrices = SCIFastCandlestickRenderableSeries()
historicalPrices.strokeUpStyle = SCISolidPenStyle(color: 0xFF84E2FF, thickness: 1)
historicalPrices.strokeDownStyle = SCISolidPenStyle(color: 0xFF84E2FF, thickness: 1)
historicalPrices.fillUpBrushStyle = SCISolidBrushStyle(color: 0xFF84E2FF)
historicalPrices.fillDownBrushStyle = SCISolidBrushStyle(color: 0x00000000)
historicalPrices.dataSeries = historicalData
// MARK: - Info Annotation
let infoText = SCITextAnnotation()
infoText.set(x1: dateData.getValueAt(1))
infoText.set(y1: 160)
infoText.text = "Tap markers to see simulated trading info"
surface.annotations.add(infoText)
var position = 0.0
var equity = 0.0
var balance = 100.0
var avgPrice = 0.0
let positionSeries = SCIXyDataSeries(xType: .int, yType: .double)
let balanceSeries = SCIXyDataSeries(xType: .date, yType: .double)
for i in 0..<priceSeries.count { //priceSeries.count
let low = priceSeries.lowData.itemsArray[i]
let high = priceSeries.highData.itemsArray[i]
let price = low + Double.random(in: 0...1) * (high - low)
if Double.random(in: 0...1) < 0.3 {
let t = equity / (equity + balance)
if Double.random(in: 0...1) > t {
// Buy
let quantity = Double(Int.random(in: 1...50))
let size = quantity * price
avgPrice = (avgPrice * position + size) / (position + quantity)
position += quantity
balance -= size
let marker = TradeMarkerAnnotation(index: dateData.getValueAt(i), isBuy: true, yPoint: low, price: price)
marker.delegate = self
surface.annotations.add(marker)
} else {
// Sell
let quantity = Double(Int.random(in: 1...50))
let size = quantity * price
position -= quantity
balance += size
//let pnl = (price - avgPrice) * quantity
let marker = TradeMarkerAnnotation(index: dateData.getValueAt(i), isBuy: false, yPoint: high, price: price)
marker.delegate = self
surface.annotations.add(marker)
}
}
equity = position * priceSeries.closeData.itemsArray[i]
positionSeries.append(x: i, y: position)
balanceSeries.append(x: dateData.getValueAt(i), y: balance + equity)
//Every 20th bar, add a news event marker
if i % 20 == 0 {
surface.annotations.add(newsBulletAnnotation(index: dateData.getValueAt(i)))
}
}
let balanceRenderable = SCIFastMountainRenderableSeries()
balanceRenderable.dataSeries = balanceSeries
balanceRenderable.yAxisId = "Balance"
balanceRenderable.areaStyle = SCISolidBrushStyle(color: 0xFFBC88D2)
balanceRenderable.strokeStyle = SCISolidPenStyle(color: 0xFFAA4BBD, thickness: 2)
let layoutManager = SCIDefaultLayoutManager()
layoutManager.rightOuterAxisLayoutStrategy = StackedYAxisLayoutStrategy()
self.surface.layoutManager = layoutManager
let priceRange = SCIDoubleRange(min: priceSeries.lowData.itemsArray.min() ?? 0,
max: priceSeries.highData.itemsArray.max() ?? 100)
yAxis.visibleRange = priceRange
let balanceRange = SCIDoubleRange(min: balanceSeries.yMin.toDouble(),
max: balanceSeries.yMax.toDouble())
balanceYAxis.visibleRange = balanceRange
surface.invalidateElement()
SCIUpdateSuspender.usingWith(surface) {
self.surface.xAxes.add(xAxis)
self.surface.yAxes.add(yAxis)
self.surface.yAxes.add(balanceYAxis)
self.surface.renderableSeries.add(items: historicalPrices, balanceRenderable)
self.surface.chartModifiers.add(SCDExampleBaseViewController.createDefaultModifiers())
}
}
fileprivate func newLineSeriesi(dataSeries: ISCIXyDataSeries, color: UInt32, axisId: String) -> SCIFastLineRenderableSeries {
let rSeries = SCIFastLineRenderableSeries()
rSeries.dataSeries = dataSeries
rSeries.strokeStyle = SCISolidPenStyle(color: color, thickness: 1.0)
rSeries.yAxisId = axisId
SCIAnimations.sweep(rSeries, duration: 3.0, easingFunction: SCICubicEase())
return rSeries
}
fileprivate func newAxis(axisId: String) -> ISCIAxis {
let axis = SCINumericAxis()
axis.axisAlignment = .left
axis.axisId = axisId
axis.axisTitle = axisId
axis.visibleRange = SCIDoubleRange(min: -2, max: 2)
axis.autoRange = .never
axis.drawMajorBands = false
axis.drawMajorGridLines = false
axis.drawMinorGridLines = false
return axis
}
//MARK: - News Annotation
func newsBulletAnnotation(index: Date) -> SCITextAnnotation {
let annotation = SCITextAnnotation()
annotation.set(x1: index)
annotation.set(y1: 120)
annotation.verticalAnchorPoint = .bottom
annotation.horizontalAnchorPoint = .center
annotation.text = "Div"
annotation.padding = SCIEdgeInsets(top: 5, left: 5, bottom: 5, right: 5)
annotation.backgroundColor = SCIColor.white
annotation.fontStyle = SCIFontStyle(fontSize: 12, andTextColorCode: 0xFF000000)
return annotation
}
}
extension BuySellMarkerAnnotationChartView : TradeAnnotationDelegate {
func didTradeAnnotationTapped(_ annotation: TradeMarkerAnnotation, atPoint: CGPoint) {
if annotation.hasLabel {
hidePriceLabel(for: annotation)
}
else if let info = annotation.userInfo?.first as? [String : Any] {
let isBuy = info["isBuy"] as? Bool ?? false
let price = info["price"] as? Double ?? 0.0
showPriceLabel(for: annotation, price: price, isBuy: isBuy)
surface.invalidateElement()
}
}
func showPriceLabel(for annotation: TradeMarkerAnnotation, price: Double, isBuy: Bool) {
let label = SCITextAnnotation()
let x1: Date = annotation.getX1()
let y1: Double = annotation.getY1()
label.set(x1: x1)
label.set(y1: y1)
label.text = String(format: "%.2f", price)
label.backgroundColor = SCIColor.red.withAlphaComponent(0.6)
label.fontStyle = SCIFontStyle(fontSize: 12, andTextColorCode: 0xFFFFFFFF)
label.backgroundColor = (isBuy ? SCIColor.systemGreen : SCIColor.systemRed).withAlphaComponent(0.8)
label.horizontalAnchorPoint = .center
label.verticalAnchorPoint = isBuy ? .bottom : .top
self.surface.annotations.add(label)
annotation.hasLabel = true
annotation.userInfo?.append(["text": label])
}
func hidePriceLabel(for annotation: TradeMarkerAnnotation) {
if ((annotation.userInfo?.count) ?? 0) > 1, let info = annotation.userInfo?[1] as? [String : Any], let label = info["text"] as? SCITextAnnotation {
DispatchQueue.main.asyncAfter(deadline: .now() + 0.1) {
self.surface.annotations.remove(label)
annotation.hasLabel = false
annotation.userInfo?.remove(at: 1)
self.surface.invalidateElement()
}
}
}
}
