SciChart® the market leader in Fast WPF Charts, WPF 3D Charts, iOS Chart, Android Chart and JavaScript Chart Components
SciChart WPF ships with hundreds of WPF Chart Examples which you can browse, play with, view the source-code and even export each WPF Chart Example to a stand-alone Visual Studio solution. All of this is possible with the new and improved SciChart WPF Examples Suite, which ships as part of the SciChart WPF SDK.
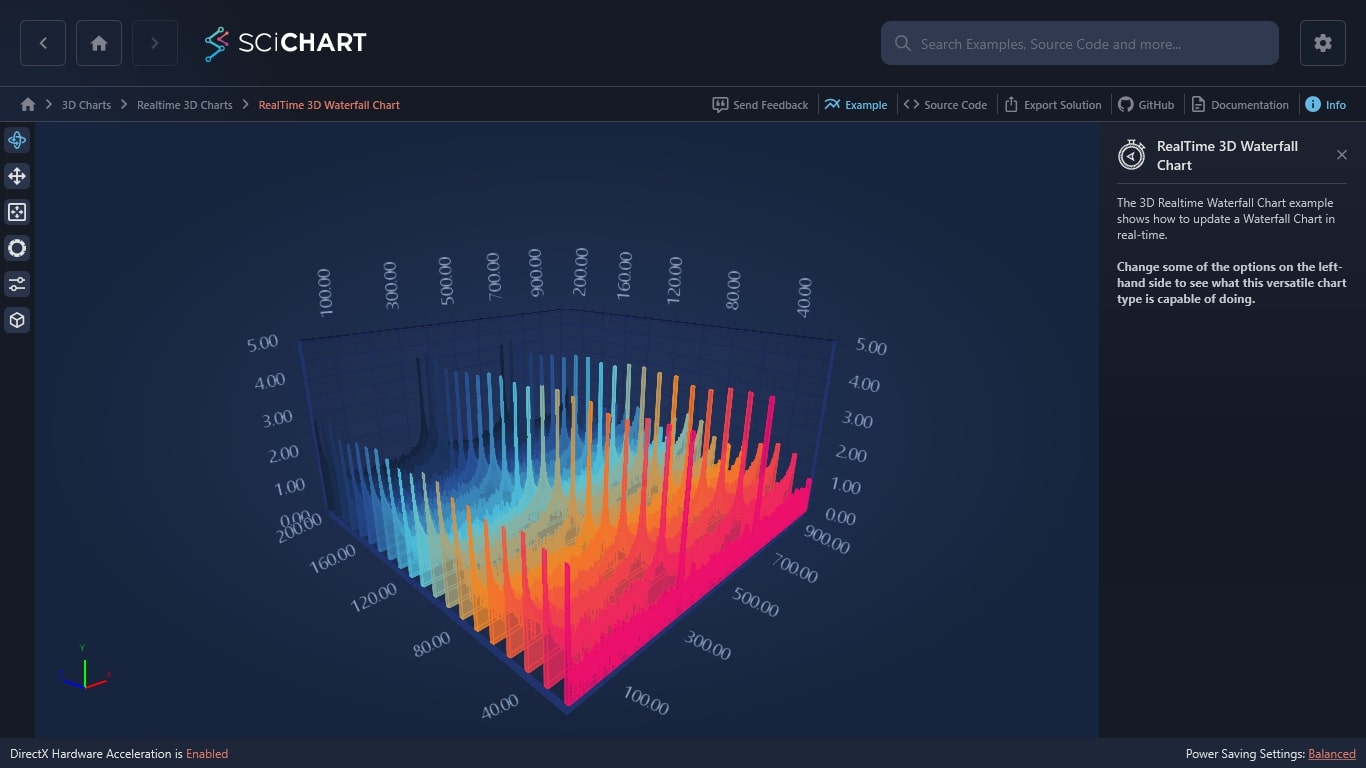
The 3D Realtime Waterfall Chart example shows how to update a Waterfall Chart in real-time.
Change some of the options on the left-hand side to see what this versatile chart type is capable of doing.
The C#/WPF source code for the WPF RealTime 3D Waterfall Chart example is included below (Scroll down!).
Did you know you can also view the source code from one of the following sources as well?
<UserControl x:Class="SciChart.Examples.Examples.Charts3D.CreateRealtime3DCharts.RealtimeWaterfall3DChart"
xmlns="http://schemas.microsoft.com/winfx/2006/xaml/presentation"
xmlns:x="http://schemas.microsoft.com/winfx/2006/xaml"
xmlns:mc="http://schemas.openxmlformats.org/markup-compatibility/2006"
xmlns:d="http://schemas.microsoft.com/expression/blend/2008"
xmlns:ext="http://schemas.abtsoftware.co.uk/scichart/exampleExternals"
xmlns:s3D="http://schemas.abtsoftware.co.uk/scichart3D"
xmlns:system="clr-namespace:System;assembly=mscorlib"
mc:Ignorable="d"
Loaded="OnExampleLoaded"
Unloaded="OnExampleUnloaded"
d:DesignHeight="600" d:DesignWidth="800">
<Grid>
<Grid.Resources>
<s3D:GradientColorPalette x:Key="GradientColorPalette" IsStepped="False">
<s3D:GradientColorPalette.GradientStops>
<GradientStop Offset="0.00" Color="Red"/>
<GradientStop Offset="0.25" Color="Orange"/>
<GradientStop Offset="0.50" Color="Yellow"/>
<GradientStop Offset="0.75" Color="Green"/>
<GradientStop Offset="1.00" Color="DarkGreen"/>
</s3D:GradientColorPalette.GradientStops>
</s3D:GradientColorPalette>
<s3D:GradientColorPalette x:Key="StrokeColorPalette" IsStepped="False">
<s3D:GradientColorPalette.GradientStops>
<GradientStop Offset="0.00" Color="Red"/>
<GradientStop Offset="0.25" Color="Orange"/>
<GradientStop Offset="0.50" Color="Yellow"/>
<GradientStop Offset="0.75" Color="Green"/>
<GradientStop Offset="1.00" Color="DarkGreen"/>
</s3D:GradientColorPalette.GradientStops>
</s3D:GradientColorPalette>
<Style x:Key="WaterfallSeriesStyle" TargetType="s3D:WaterfallRenderableSeries3D">
<Setter Property="Opacity" Value="0.8" />
<Setter Property="StrokeThickness" Value="2"/>
<Setter Property="SliceThickness" Value="2"/>
<Setter Property="ClipMode" Value="{Binding Source={x:Reference Name=ckbClipMode}, Path=SelectedValue}"/>
<Setter Property="ZColorMapping" Value="{x:Null}"/>
<Setter Property="YColorMapping" Value="{x:Null}"/>
<Style.Triggers>
<DataTrigger Binding="{Binding Source={x:Reference Name=ckbFillY}, Path=IsChecked}" Value="True">
<Setter Property="YColorMapping" Value="{StaticResource GradientColorPalette}"/>
<Setter Property="YStrokeColorMapping" Value="{StaticResource StrokeColorPalette}"/>
</DataTrigger>
<DataTrigger Binding="{Binding Source={x:Reference Name=ckbFillZ}, Path=IsChecked}" Value="True">
<Setter Property="ZColorMapping" Value="{StaticResource GradientColorPalette}"/>
<Setter Property="ZStrokeColorMapping" Value="{StaticResource StrokeColorPalette}"/>
</DataTrigger>
</Style.Triggers>
</Style>
<Style x:Key="MeshSeriesStyle" TargetType="s3D:SurfaceMeshRenderableSeries3D">
<Setter Property="Stroke" Value="#773333FF" />
<Setter Property="Opacity" Value="0.8" />
<Setter Property="MeshColorPalette" Value="{StaticResource GradientColorPalette}" />
</Style>
<ObjectDataProvider x:Key="ClipModeEnum" MethodName="GetValues" ObjectType="{x:Type system:Enum}">
<ObjectDataProvider.MethodParameters>
<x:Type TypeName="s3D:ClipMode"/>
</ObjectDataProvider.MethodParameters>
</ObjectDataProvider>
<Style x:Key="MyRadioButton" TargetType="{x:Type RadioButton}">
<Setter Property="FontSize" Value="12"/>
<Setter Property="Margin" Value="4"/>
<Setter Property="VerticalAlignment" Value="Center"/>
<Setter Property="HorizontalAlignment" Value="Left"/>
<Setter Property="Template">
<Setter.Value>
<ControlTemplate TargetType="{x:Type RadioButton}">
<Border Background="Transparent">
<CheckBox Content="{TemplateBinding Content}"
IsChecked="{TemplateBinding IsChecked}"
IsHitTestVisible="False"/>
</Border>
</ControlTemplate>
</Setter.Value>
</Setter>
</Style>
</Grid.Resources>
<Grid.ColumnDefinitions>
<ColumnDefinition Width="Auto" />
<ColumnDefinition Width="*" />
</Grid.ColumnDefinitions>
<!-- The SciChart3DInteractionToolbar adds rotate, orbit, zoom, pan, zoom extents functionality -->
<!-- to the chart and is included for example purposes. -->
<!-- If you wish to know how to zoom and pan a 3D chart then do a search for Zoom Pan in the Examples suite! -->
<ext:SciChart3DInteractionToolbar TargetSurface="{Binding Source={x:Reference Name=SciChart}}">
<ext:FlyoutMenuButton Style="{StaticResource FlyoutMenuButtonStyle}"
x:Name="CTRLButton"
Content="CTRL"
FontSize="10"
Padding="0">
<ext:FlyoutMenuButton.PopupContent>
<StackPanel Orientation="Vertical" MinWidth="150">
<!-- Checkboxes to decide how the chart should be filled -->
<TextBlock FontSize="12" Text="Gradient fill direction:" />
<RadioButton x:Name="ckbFillY" Content="Along Y Axis" IsChecked="True" Style="{StaticResource MyRadioButton}"/>
<RadioButton x:Name="ckbFillZ" Content="Along Z Axis" Style="{StaticResource MyRadioButton}"/>
<ext:FlyoutSeparator/>
<!-- Checkbox to decide which data points appear -->
<TextBlock FontSize="12" Text="Clip values:" />
<ComboBox FontSize="12" Margin="4" x:Name="ckbClipMode" ItemsSource="{Binding Source={StaticResource ClipModeEnum}}" SelectedItem="{x:Static s3D:ClipMode.BelowZero}"/>
</StackPanel>
</ext:FlyoutMenuButton.PopupContent>
</ext:FlyoutMenuButton>
<ext:FlyoutMenuButton Style="{StaticResource FlyoutMenuButtonStyle}"
Content="MESH"
FontSize="9"
Padding="0">
<ext:FlyoutMenuButton.PopupContent>
<StackPanel>
<TextBlock FontSize="12" Text="Change series Type:"/>
<ComboBox SelectionChanged="SelectedTypeChanged" SelectedIndex="1">
<ComboBox.Items>
<system:String>Surface Mesh</system:String>
<system:String>Waterfall</system:String>
</ComboBox.Items>
</ComboBox>
</StackPanel>
</ext:FlyoutMenuButton.PopupContent>
</ext:FlyoutMenuButton>
</ext:SciChart3DInteractionToolbar>
<s3D:SciChart3DSurface x:Name="SciChart"
Grid.Column="1"
BorderThickness="0"
WorldDimensions="200,100,200">
<s3D:SciChart3DSurface.Camera>
<s3D:Camera3D ZoomToFitOnAttach="True"/>
</s3D:SciChart3DSurface.Camera>
<s3D:SciChart3DSurface.RenderableSeries>
<s3D:WaterfallRenderableSeries3D x:Name="WaterfallSeries" Style="{StaticResource WaterfallSeriesStyle}"/>
<s3D:SurfaceMeshRenderableSeries3D x:Name="MeshSeries" Style="{StaticResource MeshSeriesStyle}" IsVisible="False"/>
</s3D:SciChart3DSurface.RenderableSeries>
<s3D:SciChart3DSurface.XAxis>
<s3D:NumericAxis3D/>
</s3D:SciChart3DSurface.XAxis>
<s3D:SciChart3DSurface.YAxis>
<s3D:NumericAxis3D VisibleRange="0,5"/>
</s3D:SciChart3DSurface.YAxis>
<s3D:SciChart3DSurface.ZAxis>
<s3D:NumericAxis3D/>
</s3D:SciChart3DSurface.ZAxis>
</s3D:SciChart3DSurface>
</Grid>
</UserControl>
using System;
using System.Windows;
using System.Windows.Controls;
using System.Windows.Threading;
using SciChart.Charting3D.Model.DataSeries.Waterfall;
using SciChart.Examples.ExternalDependencies.Data;
namespace SciChart.Examples.Examples.Charts3D.CreateRealtime3DCharts
{
/// <summary>
/// Interaction logic for RealtimeWaterfall3DChart.xaml
/// </summary>
public partial class RealtimeWaterfall3DChart : UserControl
{
// Data Sample Rate (sec)
private readonly double dt = 0.02;
// The current time
private double t;
private int _tick;
private int _step = 3;
private WaterfallDataSeries3D<double> _waterfallDataSeries;
private readonly Random _random;
private readonly FFT2 _transform;
private int _transformSize;
private double[] _real;
private double[] _imaginary;
private readonly int _pointsPerSlice = 1024;
private readonly int _maxSliceCount = 20;
private DispatcherTimer _timerNewDataUpdate;
public RealtimeWaterfall3DChart()
{
InitializeComponent();
_random = new Random();
_transform = new FFT2();
Loaded += OnLoaded;
}
private void OnTimerTick(object sender, EventArgs e)
{
var generatedRow = GenerateDataRow();
_waterfallDataSeries.PushRow(generatedRow);
}
private void OnLoaded(object sender, RoutedEventArgs routedEventArgs)
{
// Initialize FFT
_transform.init((uint) Math.Log(_pointsPerSlice, 2));
_transformSize = _pointsPerSlice * 2;
_real = new double[_transformSize];
_imaginary = new double[_transformSize];
// Initialize WaterfallDataSeries3D
_waterfallDataSeries = new WaterfallDataSeries3D<double>(_pointsPerSlice, _maxSliceCount)
{
StartX = 10,
StepX = 1,
StartZ = 25,
StepZ = 10
};
WaterfallSeries.DataSeries = _waterfallDataSeries;
MeshSeries.DataSeries = _waterfallDataSeries;
}
// NOTE: The purpose of this function is to simply generate some random data to display in the waterfall chart
// Each row is _pointsPerSlice wide and there are _maxSliceCount slices in the waterfall
private double[] GenerateDataRow()
{
var generatedRow = new double[_pointsPerSlice];
// Randomly introduce changes in amplitude
_tick++;
if (_tick == 2)
{
_tick = 0;
_step = _random.Next(10, 20);
}
for (int i = 0; i < _transformSize; i++)
{
double noise = _random.Next(-100, 100) * 0.002;
// Compute a sinusoidal based waveform with some varying frequency and random amplitude
double y = _step * 2 * Math.Sin(2 * Math.PI * 0.1 * t) + noise;
y += Math.Sin(2 * Math.PI * 0.2 * t);
_real[i] = y;
_imaginary[i] = 0;
t += dt;
}
// Do an FFT
_transform.run(_real, _imaginary);
// Convert FFT back to magnitude (required for a meaningful output in our test data)
for (int i = 0; i < _pointsPerSlice; i++)
{
double magnitude = Math.Sqrt(_real[i] * _real[i] + _imaginary[i] * _imaginary[i]);
generatedRow[i] = Math.Log10(magnitude);
}
return generatedRow;
}
private void OnExampleLoaded(object sender, RoutedEventArgs e)
{
if (_timerNewDataUpdate == null)
{
_timerNewDataUpdate = new DispatcherTimer(DispatcherPriority.Render);
_timerNewDataUpdate.Tick += OnTimerTick;
_timerNewDataUpdate.Interval = TimeSpan.FromMilliseconds(25);
_timerNewDataUpdate.Start();
}
}
private void OnExampleUnloaded(object sender, RoutedEventArgs e)
{
if (_timerNewDataUpdate != null)
{
_timerNewDataUpdate.Stop();
_timerNewDataUpdate = null;
}
}
private void SelectedTypeChanged(object sender, SelectionChangedEventArgs e)
{
var isWaterfallRunning = e.AddedItems[0].Equals("Waterfall");
if (WaterfallSeries != null && MeshSeries != null)
{
WaterfallSeries.IsVisible = isWaterfallRunning;
MeshSeries.IsVisible = !isWaterfallRunning;
CTRLButton.IsEnabled = isWaterfallRunning;
}
}
}
}