WPF Chart - Examples
SciChart WPF ships with hundreds of WPF Chart Examples which you can browse, play with, view the source-code and even export each WPF Chart Example to a stand-alone Visual Studio solution. All of this is possible with the new and improved SciChart WPF Examples Suite, which ships as part of the SciChart WPF SDK.
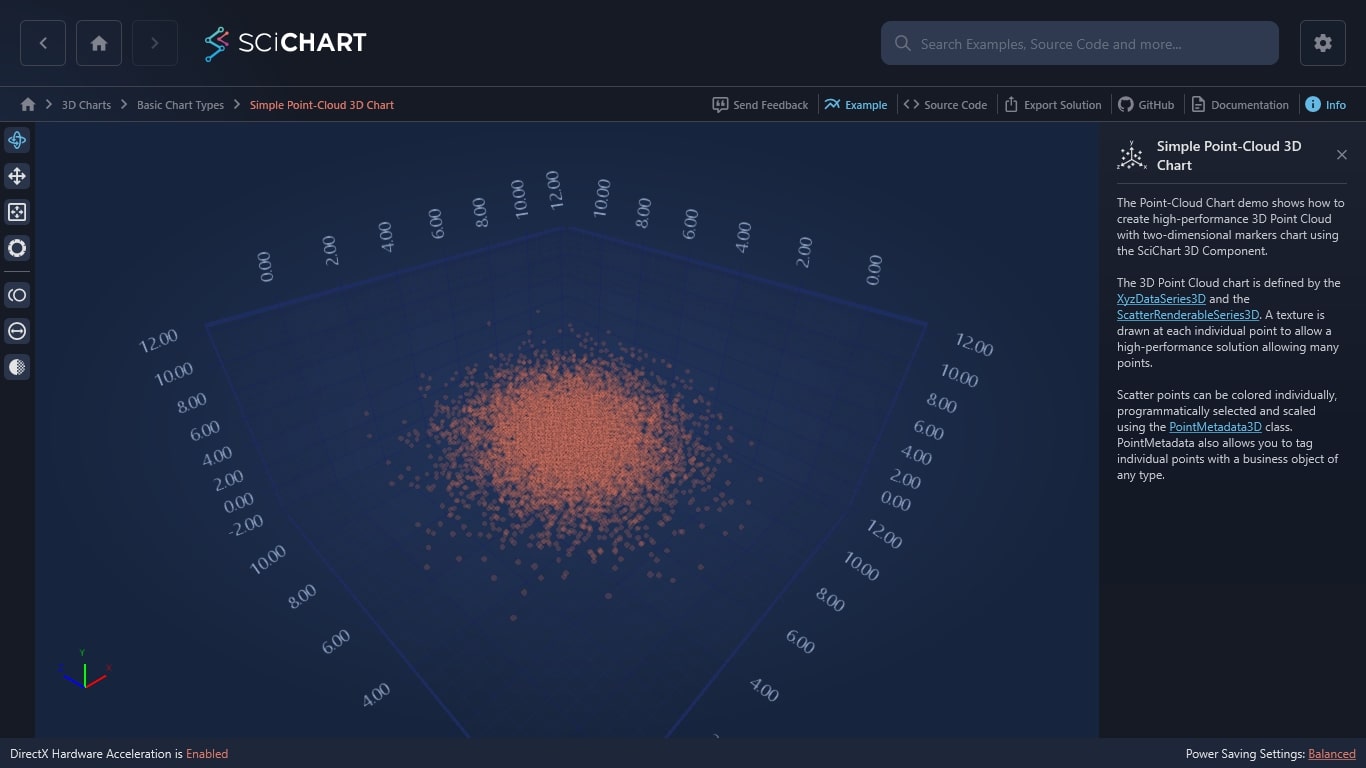
The Point-Cloud Chart demo shows how to create high-performance WPF 3D Point Cloud with two-dimensional markers chart using the SciChart 3D Component.
The 3D Point Cloud chart is defined by the XyzDataSeries3D and the ScatterRenderableSeries3D. A texture is drawn at each individual point to allow a high-performance solution allowing many points.
Scatter points can be colored individually, programmatically selected and scaled using the PointMetadata3D class. PointMetadata also allows you to tag individual points with a business object of any type.

The C#/WPF source code for the WPF 3D Point Cloud Chart Example example is included below (Scroll down!).
Did you know you can also view the source code from one of the following sources as well?
- Clone the SciChart.WPF.Examples from Github.
- Or, view source in the SciChart WPF Examples suite.
- Also the SciChart WPF Trial contains the full source for the examples (link below).
