SciChart® the market leader in Fast WPF Charts, WPF 3D Charts, and iOS Chart & Android Chart Components
SciChart WPF ships with hundreds of WPF Chart Examples which you can browse, play with, view the source-code and even export each WPF Chart Example to a stand-alone Visual Studio solution. All of this is possible with the new and improved SciChart WPF Examples Suite, which ships as part of the SciChart WPF SDK.
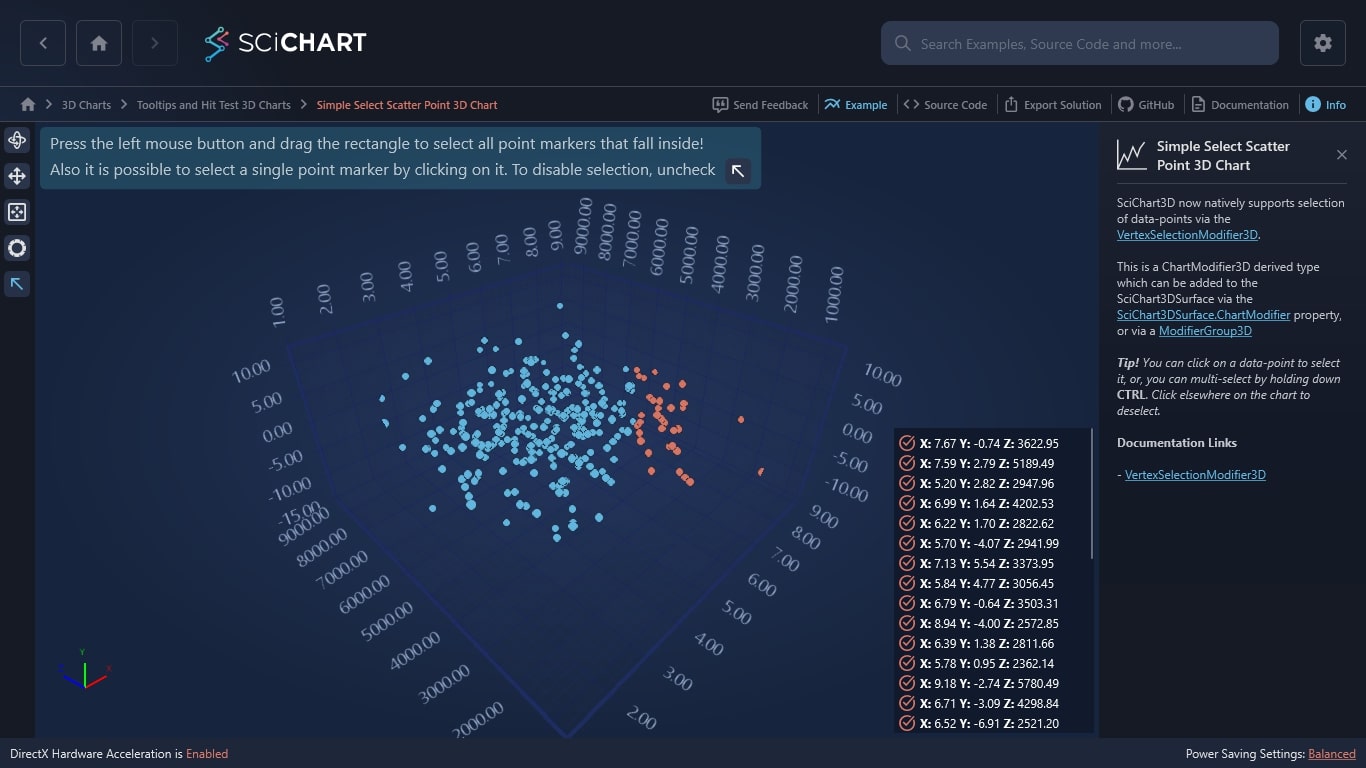
SciChart3D now natively supports selection of data-points via the VertexSelectionModifier3D.
This is a ChartModifier3D derived type which can be added to the SciChart3DSurface via the SciChart3DSurface.ChartModifier property, or via a ModifierGroup3D
Tip! You can click on a data-point to select it, or, you can multi-select by holding down CTRL. Click elsewhere on the chart to deselect.
Documentation Links
The C#/WPF source code for the WPF 3D Chart Data-Point Selection Example example is included below (Scroll down!).
Did you know you can also view the source code from one of the following sources as well?
<UserControl x:Class="SciChart.Examples.Examples.Charts3D.TooltipsAndHitTest3DCharts.SelectScatterPoint3DChart" xmlns="http://schemas.microsoft.com/winfx/2006/xaml/presentation" xmlns:x="http://schemas.microsoft.com/winfx/2006/xaml" xmlns:d="http://schemas.microsoft.com/expression/blend/2008" xmlns:mc="http://schemas.openxmlformats.org/markup-compatibility/2006" xmlns:s="http://schemas.abtsoftware.co.uk/scichart" xmlns:s3D="http://schemas.abtsoftware.co.uk/scichart3D" xmlns:system="clr-namespace:System;assembly=mscorlib" xmlns:tooltipsAndHitTest3DCharts="clr-namespace:SciChart.Examples.Examples.Charts3D.TooltipsAndHitTest3DCharts" xmlns:ext="http://schemas.abtsoftware.co.uk/scichart/exampleExternals" d:DesignHeight="400" d:DesignWidth="600" mc:Ignorable="d"> <UserControl.Resources> <ResourceDictionary> <ResourceDictionary.MergedDictionaries> <ResourceDictionary Source="/SciChart.Examples.ExternalDependencies;component/Resources/Styles/MergedResources.xaml" /> </ResourceDictionary.MergedDictionaries> <tooltipsAndHitTest3DCharts:ExamplePointCloudPaletteProvider x:Key="CloudPaletteProvider" /> </ResourceDictionary> </UserControl.Resources> <Grid> <Grid.ColumnDefinitions> <ColumnDefinition Width="Auto" /> <ColumnDefinition Width="*" /> <ColumnDefinition Width="Auto" /> </Grid.ColumnDefinitions> <Grid.RowDefinitions> <RowDefinition Height="*" /> <RowDefinition Height="Auto" /> </Grid.RowDefinitions> <ext:SciChart3DInteractionToolbar Grid.RowSpan="2" TargetSurface="{Binding Source={x:Reference Name=sciChartSurface}}"/> <s3D:SciChart3DSurface x:Name="sciChartSurface" Grid.RowSpan="2" Grid.Column="1" Grid.ColumnSpan="2" WorldDimensions="200,100,200" s:ThemeManager.Theme="SciChartv4Dark"> <s3D:SciChart3DSurface.RenderableSeries> <s3D:ScatterRenderableSeries3D x:Name="renderableSeries3D" PaletteProvider="{StaticResource CloudPaletteProvider}" > <s3D:ScatterRenderableSeries3D.PointMarker> <s3D:EllipsePointMarker3D Size="0.2"/> </s3D:ScatterRenderableSeries3D.PointMarker> </s3D:ScatterRenderableSeries3D> </s3D:SciChart3DSurface.RenderableSeries> <s3D:SciChart3DSurface.XAxis> <s3D:NumericAxis3D x:Name="XAx" /> </s3D:SciChart3DSurface.XAxis> <s3D:SciChart3DSurface.YAxis> <s3D:NumericAxis3D x:Name="YAx" /> </s3D:SciChart3DSurface.YAxis> <s3D:SciChart3DSurface.ZAxis> <s3D:NumericAxis3D x:Name="ZAx" /> </s3D:SciChart3DSurface.ZAxis> <s3D:SciChart3DSurface.ChartModifier> <s3D:ModifierGroup3D> <s3D:FreeLookModifier3D ExecuteOn="MouseLeftButton" ExecuteWhen="Shift" /> <s3D:OrbitModifier3D ExecuteOn="MouseLeftButton" /> <s3D:VertexSelectionModifier3D ExecuteOn="MouseLeftButton" ExecuteWhen="None" /> <s3D:MouseWheelZoomModifier3D /> </s3D:ModifierGroup3D> </s3D:SciChart3DSurface.ChartModifier> </s3D:SciChart3DSurface> <ListBox x:Name="slectedItem" Grid.Row="1" Grid.Column="2" Width="200" ScrollViewer.HorizontalScrollBarVisibility ="Hidden" Height="300" Margin="3" Opacity="0.6"> <ListBox.ItemTemplate> <DataTemplate> <StackPanel Orientation="Horizontal"> <CheckBox Margin="0,0,5,0" Content="{x:Null}" IsChecked="{Binding PointMetadata3D.IsSelected, Mode=TwoWay}" /> <TextBlock FontFamily="Bold" Text="X: " /> <TextBlock Text="{Binding X, StringFormat='0.00'}" /> <TextBlock FontFamily="Bold" Text=", Y: " /> <TextBlock Text="{Binding Y, StringFormat='0.00'}" /> <TextBlock FontFamily="Bold" Text=", Z: " /> <TextBlock Text="{Binding Z, StringFormat='0.00'}" /> </StackPanel> </DataTemplate> </ListBox.ItemTemplate> </ListBox> <!-- Some help text for example --> <StackPanel Grid.Column="1" Grid.ColumnSpan="2" VerticalAlignment="Top" HorizontalAlignment="Left" Orientation="Vertical"> <TextBlock FontSize="20" Opacity="0.7" Background="#232323" Margin="5" HorizontalAlignment="Left" Text="Press the left mouse button and drag the rectangle to select all point markers that fall inside!" Foreground="#FFF" /> <TextBlock FontSize="20" Opacity="0.7" Background="#232323" Margin="5 0" HorizontalAlignment="Left" Text="Also it is possible to select a single point marker by clicking on it." Foreground="#FFF" /> <StackPanel Margin="5" Orientation="Horizontal"> <TextBlock FontSize="20" Opacity="0.7" Background="#232323" Text="To disable selection, uncheck" Foreground="#FFF" /> <Image Width="32" Height="32" Margin="5 0" Source="/SciChart.Examples;component/Resources/Images/select_icon.png" Stretch="None" /> <TextBlock FontSize="20" Opacity="0.7" Background="#232323" Text="More selection options can be found in the button's popup menu." Foreground="#FFF" /> </StackPanel> </StackPanel> </Grid> </UserControl>
// ************************************************************************************* // SCICHART® Copyright SciChart Ltd. 2011-2018. All rights reserved. // // Web: http://www.scichart.com // Support: support@scichart.com // Sales: sales@scichart.com // // SelectScatterPoint3DChart.xaml.cs is part of the SCICHART® Examples. Permission is hereby granted // to modify, create derivative works, distribute and publish any part of this source // code whether for commercial, private or personal use. // // The SCICHART® examples are distributed in the hope that they will be useful, but // without any warranty. It is provided "AS IS" without warranty of any kind, either // expressed or implied. // ************************************************************************************* using System; using System.Collections.Generic; using System.Linq; using System.Text; using System.Windows; using System.Windows.Controls; using System.Windows.Data; using System.Windows.Documents; using System.Windows.Input; using System.Windows.Media; using System.Windows.Media.Imaging; using System.Windows.Navigation; using System.Windows.Shapes; using SciChart.Charting.Model.DataSeries; using SciChart.Charting3D; using SciChart.Charting3D.Model; using SciChart.Charting3D.PointMarkers; using SciChart.Core.Extensions; using SciChart.Data.Model; using SciChart.Examples.ExternalDependencies.Data; namespace SciChart.Examples.Examples.Charts3D.TooltipsAndHitTest3DCharts { /// <summary> /// Interaction logic for SelectScatterPoint3DChart.xaml /// </summary> public partial class SelectScatterPoint3DChart : UserControl { private XyzDataSeries3D<double> _xyzDataSeries3D; public SelectScatterPoint3DChart() { InitializeComponent(); XAx.VisibleRange = new DoubleRange(0, 10); YAx.VisibleRange = new DoubleRange(-10, 10); ZAx.VisibleRange = new DoubleRange(1000, 10000); _xyzDataSeries3D = new XyzDataSeries3D<double>(); _xyzDataSeries3D.DataSeriesChanged += OnScatterDataChanged; for (int i = 0; i < 300; i++) { double x = DataManager.Instance.GetGaussianRandomNumber(5, 1.5); double y = DataManager.Instance.GetGaussianRandomNumber(0.0, 5.0); double z = DataManager.Instance.GetGaussianRandomNumber(5500, 1500); PointMetadata3D vertex = new PointMetadata3D(Colors.Coral, 10); _xyzDataSeries3D.Append(x, y, z, vertex); } renderableSeries3D.DataSeries = _xyzDataSeries3D; sciChartSurface.ZoomExtents(); } private void OnScatterDataChanged(object sender, DataSeriesChangedEventArgs e) { List<XyzDataPointViewModel<double>> selectedPoints = new List<XyzDataPointViewModel<double>>(); for (int i = 0; i < _xyzDataSeries3D.Count; i++) { if (_xyzDataSeries3D.WValues[i] != null) { if (_xyzDataSeries3D.WValues[i].IsSelected) { selectedPoints.Add(new XyzDataPointViewModel<double>(i, _xyzDataSeries3D.XValues[i], _xyzDataSeries3D.YValues[i], _xyzDataSeries3D.ZValues[i], _xyzDataSeries3D.WValues[i])); } } } if (!selectedPoints.IsNullOrEmpty()) { slectedItem.Visibility = Visibility.Visible; slectedItem.ItemsSource = selectedPoints; } else slectedItem.Visibility = Visibility.Collapsed; } } }
// ************************************************************************************* // SCICHART® Copyright SciChart Ltd. 2011-2018. All rights reserved. // // Web: http://www.scichart.com // Support: support@scichart.com // Sales: sales@scichart.com // // PaletteProvider.cs is part of the SCICHART® Examples. Permission is hereby granted // to modify, create derivative works, distribute and publish any part of this source // code whether for commercial, private or personal use. // // The SCICHART® examples are distributed in the hope that they will be useful, but // without any warranty. It is provided "AS IS" without warranty of any kind, either // expressed or implied. // ************************************************************************************* using System.Windows; using System.Windows.Media; using SciChart.Charting3D.Model; using SciChart.Charting3D.RenderableSeries; namespace SciChart.Examples.Examples.Charts3D.TooltipsAndHitTest3DCharts { public class ExamplePointCloudPaletteProvider : IPointMarkerPaletteProvider3D { public Color? OverridePointMarker(IRenderableSeries3D series, int index, IPointMetadata3D metadata) { var pmFillColor = Colors.Lime; if (metadata != null && metadata.IsSelected) { pmFillColor = Colors.White; } return pmFillColor; } public void OnAttach(IRenderableSeries3D renderSeries) { } public void OnDetached() { } } }