WPF Chart - Examples
SciChart WPF ships with hundreds of WPF Chart Examples which you can browse, play with, view the source-code and even export each WPF Chart Example to a stand-alone Visual Studio solution. All of this is possible with the new and improved SciChart WPF Examples Suite, which ships as part of the SciChart WPF SDK.
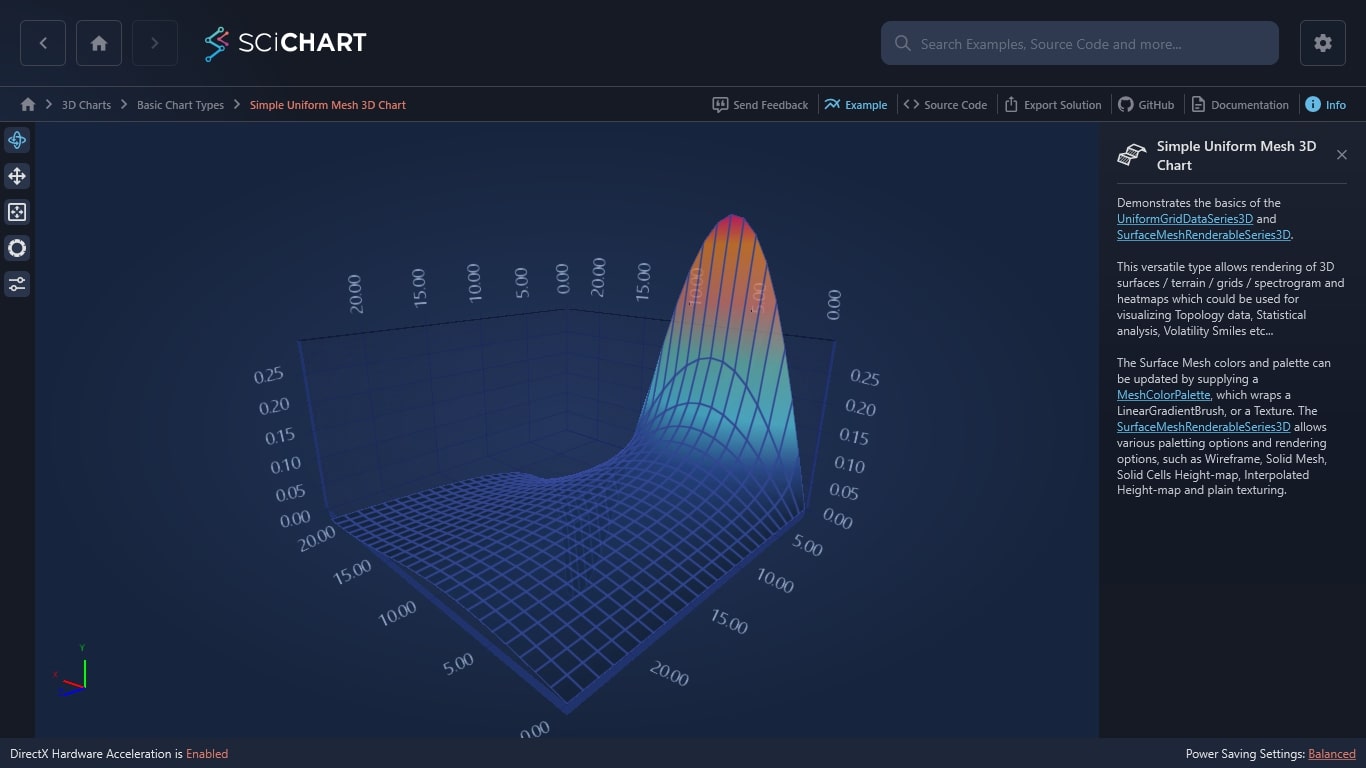
Demonstrates the basics of the UniformGridDataSeries3D and SurfaceMeshRenderableSeries3D.
This versatile type allows rendering of 3D surfaces / terrain / grids / spectrogram and heatmaps which could be used for visualizing Topology data, Statistical analysis, Volatility Smiles etc…
The Surface Mesh colors and palette can be updated by supplying a MeshColorPalette, which wraps a LinearGradientBrush, or a Texture. The SurfaceMeshRenderableSeries3D allows various paletting options and rendering options, such as Wireframe, Solid Mesh, Solid Cells Height-map, Interpolated Height-map and plain texturing.

The C#/WPF source code for the WPF 3D Chart Surface Mesh Plot Example example is included below (Scroll down!).
Did you know you can also view the source code from one of the following sources as well?
- Clone the SciChart.WPF.Examples from Github.
- Or, view source in the SciChart WPF Examples suite.
- Also the SciChart WPF Trial contains the full source for the examples (link below).
