SciChart® the market leader in Fast WPF Charts, WPF 3D Charts, iOS Chart, Android Chart and JavaScript Chart Components
SciChart WPF ships with hundreds of WPF Chart Examples which you can browse, play with, view the source-code and even export each WPF Chart Example to a stand-alone Visual Studio solution. All of this is possible with the new and improved SciChart WPF Examples Suite, which ships as part of the SciChart WPF SDK.
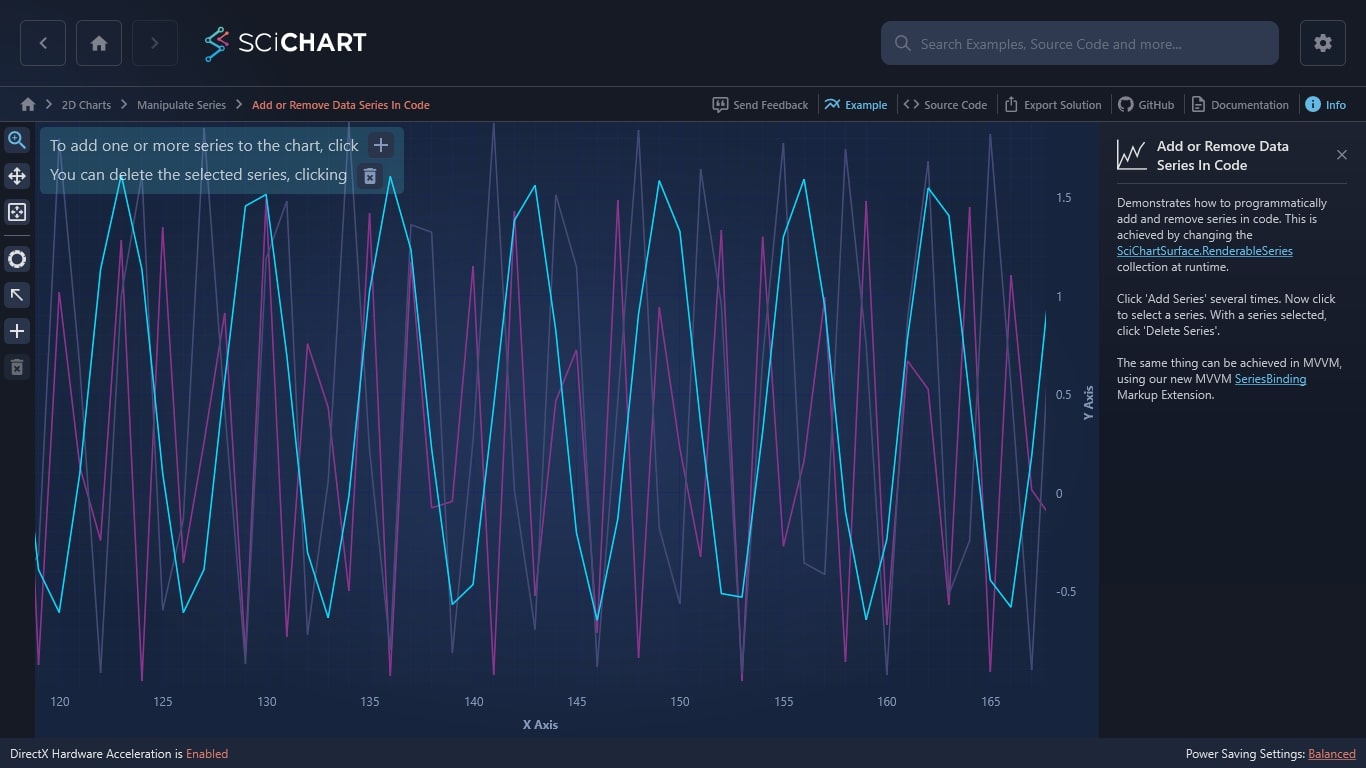
Demonstrates how to programmatically add and remove series in code. This is achieved by changing the SciChartSurface.RenderableSeries collection at runtime.
Click ‘Add Series’ several times. Now click to select a series. With a series selected, click ‘Delete Series’.
The same thing can be achieved in MVVM, using our new MVVM SeriesBinding Markup Extension.
The C#/WPF source code for the WPF Chart Add or Remove DataSeries example is included below (Scroll down!).
Did you know you can also view the source code from one of the following sources as well?
<UserControl x:Class="SciChart.Examples.Examples.ManipulateSeries.AddRemoveDataSeriesExampleView"
xmlns="http://schemas.microsoft.com/winfx/2006/xaml/presentation"
xmlns:x="http://schemas.microsoft.com/winfx/2006/xaml"
xmlns:d="http://schemas.microsoft.com/expression/blend/2008"
xmlns:ext="http://schemas.abtsoftware.co.uk/scichart/exampleExternals"
xmlns:mc="http://schemas.openxmlformats.org/markup-compatibility/2006"
xmlns:s="http://schemas.abtsoftware.co.uk/scichart"
d:DesignHeight="400"
d:DesignWidth="600"
mc:Ignorable="d">
<UserControl.Resources>
<ext:BoolToValueConverter x:Key="InvertBooleanConverter" TrueValue="False" FalseValue="True"/>
</UserControl.Resources>
<Grid>
<Grid.ColumnDefinitions>
<ColumnDefinition Width="Auto" />
<ColumnDefinition Width="*" />
</Grid.ColumnDefinitions>
<ext:SciChartInteractionToolbar TargetSurface="{Binding Source={x:Reference Name=sciChart}}">
<ext:FlyoutMenuButton Click="AddSeriesClick"
Content="ADD"
Padding="0"
Style="{StaticResource FlyoutMenuButtonStyle}"
ToolTipService.ToolTip="Add a Series">
<ext:FlyoutMenuButton.PopupContent>
<StackPanel MinWidth="150" Orientation="Vertical">
<TextBlock Text="Add one or more series to the chart" />
</StackPanel>
</ext:FlyoutMenuButton.PopupContent>
</ext:FlyoutMenuButton>
<ext:FlyoutMenuButton x:Name="deleteSeriesButton"
Click="DeleteSeriesClick"
Content="DEL"
IsEnabled="False"
Padding="0"
Style="{StaticResource FlyoutMenuButtonStyle}"
ToolTipService.ToolTip="Delete Selected Series">
<ext:FlyoutMenuButton.PopupContent>
<StackPanel MinWidth="150" Orientation="Vertical">
<TextBlock Text="Now select a series and delete it!" />
</StackPanel>
</ext:FlyoutMenuButton.PopupContent>
</ext:FlyoutMenuButton>
</ext:SciChartInteractionToolbar>
<s:SciChartSurface x:Name="sciChart" Grid.Column="1">
<s:SciChartSurface.XAxis>
<s:NumericAxis AxisTitle="X Axis" VisibleRange="0,10" />
</s:SciChartSurface.XAxis>
<s:SciChartSurface.YAxis>
<s:NumericAxis AxisTitle="Y Axis" VisibleRange="0,10" />
</s:SciChartSurface.YAxis>
<s:SciChartSurface.ChartModifier>
<s:ModifierGroup>
<s:SeriesSelectionModifier SelectionChanged="SeriesSelectionModifier_SelectionChanged">
<s:SeriesSelectionModifier.SelectedSeriesStyle>
<Style TargetType="s:BaseRenderableSeries">
<Setter Property="PointMarkerTemplate">
<Setter.Value>
<ControlTemplate>
<s:EllipsePointMarker x:Name="PART_PointMarker"
Width="5"
Height="5"
Fill="#77777777"
Stroke="White"
StrokeThickness="1" />
</ControlTemplate>
</Setter.Value>
</Setter>
</Style>
</s:SeriesSelectionModifier.SelectedSeriesStyle>
</s:SeriesSelectionModifier>
<s:ZoomExtentsModifier />
</s:ModifierGroup>
</s:SciChartSurface.ChartModifier>
<s:SciChartSurface.Annotations>
<s:CustomAnnotation CoordinateMode="Relative"
HorizontalAnchorPoint="Left"
VerticalAnchorPoint="Center"
Margin="5,18,0,0"
X1="0"
Y1="0" >
<StackPanel Orientation="Horizontal">
<TextBlock FontSize="20"
Opacity="0.7"
Background="#232323"
Margin="0 0 5 0"
Text="Add one or more series to the chart"
Foreground="#FFF" />
<Image Width="32"
Height="32"
Source="/SciChart.Examples;component/Resources/Images/add_button.png"
Stretch="None" />
</StackPanel>
</s:CustomAnnotation>
<s:CustomAnnotation CoordinateMode="Relative"
HorizontalAnchorPoint="Left"
Margin="5,50,0,0"
VerticalAnchorPoint="Center"
IsHidden="{Binding ElementName=sciChart, Path=RenderableSeries.Count, Converter={StaticResource InvertBooleanConverter}}"
X1="0"
Y1="0" >
<StackPanel Orientation="Horizontal">
<TextBlock FontSize="20"
Opacity="0.7"
Background="#232323"
Margin="0 0 5 0"
Text="Now select a series and delete it!"
Foreground="#FFF" />
<Image Width="32"
Height="32"
Source="/SciChart.Examples;component/Resources/Images/del_button.png"
Stretch="None" />
</StackPanel>
</s:CustomAnnotation>
</s:SciChartSurface.Annotations>
</s:SciChartSurface>
</Grid>
</UserControl>
// *************************************************************************************
// SCICHART® Copyright SciChart Ltd. 2011-2021. All rights reserved.
//
// Web: http://www.scichart.com
// Support: support@scichart.com
// Sales: sales@scichart.com
//
// AddRemoveDataSeriesExampleView.xaml.cs is part of the SCICHART® Examples. Permission is hereby granted
// to modify, create derivative works, distribute and publish any part of this source
// code whether for commercial, private or personal use.
//
// The SCICHART® examples are distributed in the hope that they will be useful, but
// without any warranty. It is provided "AS IS" without warranty of any kind, either
// expressed or implied.
// *************************************************************************************
using System;
using System.Linq;
using System.Windows;
using System.Windows.Controls;
using SciChart.Charting.Model.DataSeries;
using SciChart.Charting.Visuals.RenderableSeries;
using SciChart.Examples.ExternalDependencies.Data;
namespace SciChart.Examples.Examples.ManipulateSeries
{
/// <summary>
/// Interaction logic for AddRemoveDataSeriesExampleView.xaml
/// </summary>
public partial class AddRemoveDataSeriesExampleView : UserControl
{
public AddRemoveDataSeriesExampleView()
{
InitializeComponent();
this.Loaded += SciChartSurfaceLoaded;
}
private void SciChartSurfaceLoaded(object sender, RoutedEventArgs e)
{
OnSeriesSelectionChanged();
}
private void DeleteSeriesClick(object sender, RoutedEventArgs e)
{
var rSeries = sciChart.SelectedRenderableSeries.FirstOrDefault();
if (rSeries == null || rSeries.DataSeries == null)
return;
sciChart.RenderableSeries.Remove(rSeries);
sciChart.ZoomExtents();
OnSeriesSelectionChanged();
}
private void OnSeriesSelectionChanged()
{
bool hasSelection = sciChart.SelectedRenderableSeries.Any();
deleteSeriesButton.IsEnabled = hasSelection;
}
private void AddSeriesClick(object sender, RoutedEventArgs e)
{
// Create a DataSeries and append some data
var dataSeries = new XyDataSeries<double, double>();
var doubleData = DataManager.Instance.GetRandomDoubleSeries(250);
dataSeries.Append(doubleData.XData, doubleData.YData);
// Create a RenderableSeries and ensure DataSeries is set
var renderSeries = new FastLineRenderableSeries
{
Stroke = DataManager.Instance.GetRandomColor(),
DataSeries = dataSeries,
StrokeThickness=2,
};
// Add the new RenderableSeries
sciChart.RenderableSeries.Add(renderSeries);
sciChart.ZoomExtents();
}
private void SeriesSelectionModifier_SelectionChanged(object sender, EventArgs e)
{
OnSeriesSelectionChanged();
}
}
}