WPF Chart - Examples
SciChart WPF ships with hundreds of WPF Chart Examples which you can browse, play with, view the source-code and even export each WPF Chart Example to a stand-alone Visual Studio solution. All of this is possible with the new and improved SciChart WPF Examples Suite, which ships as part of the SciChart WPF SDK.
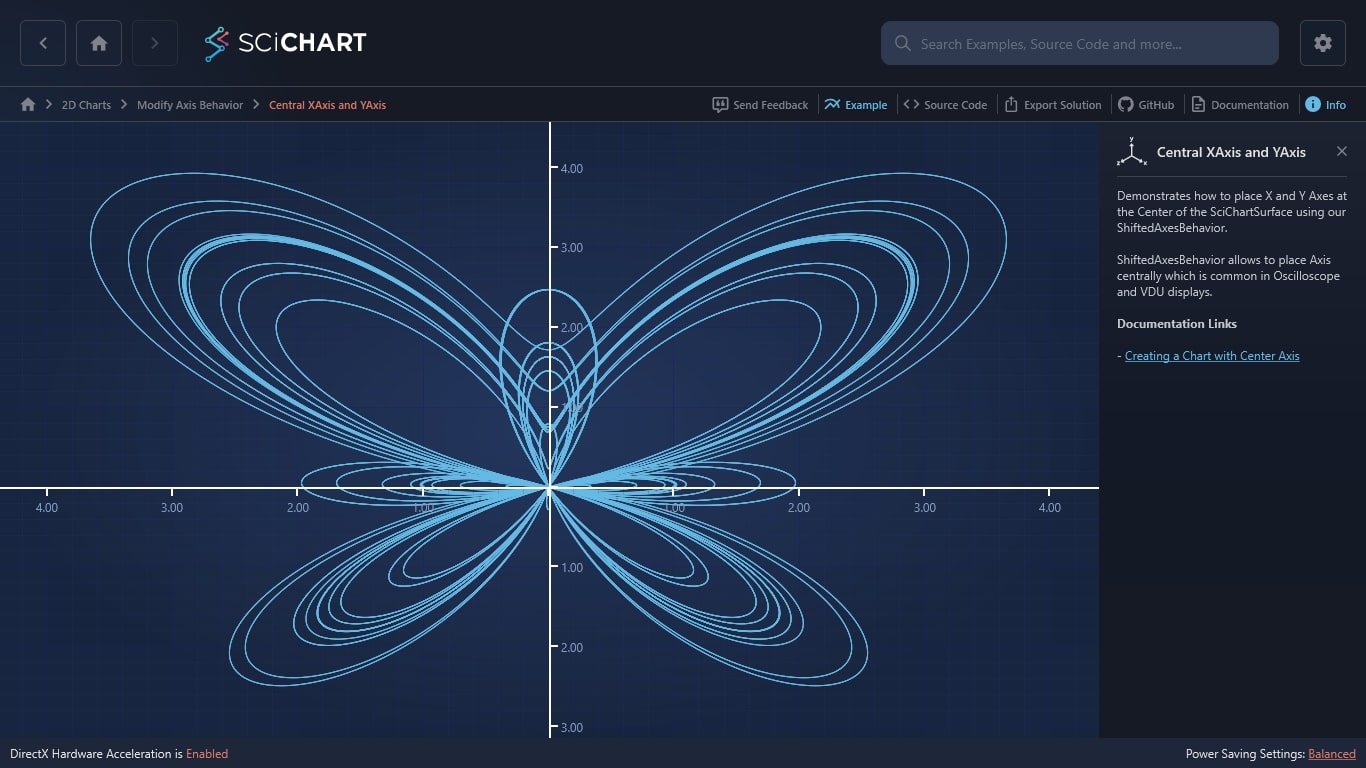
Demonstrates how to place X and Y Axes at the Center of the SciChartSurface using our ShiftedAxesBehavior.
ShiftedAxesBehavior allows to place Axis centrally which is common in Oscilloscope and VDU displays.
Documentation Links

The C#/WPF source code for the WPF Chart Central XAxis and YAxis example is included below (Scroll down!).
Did you know you can also view the source code from one of the following sources as well?
- Clone the SciChart.WPF.Examples from Github.
- Or, view source in the SciChart WPF Examples suite.
- Also the SciChart WPF Trial contains the full source for the examples (link below).
