WPF Chart - Examples
SciChart WPF ships with hundreds of WPF Chart Examples which you can browse, play with, view the source-code and even export each WPF Chart Example to a stand-alone Visual Studio solution. All of this is possible with the new and improved SciChart WPF Examples Suite, which ships as part of the SciChart WPF SDK.
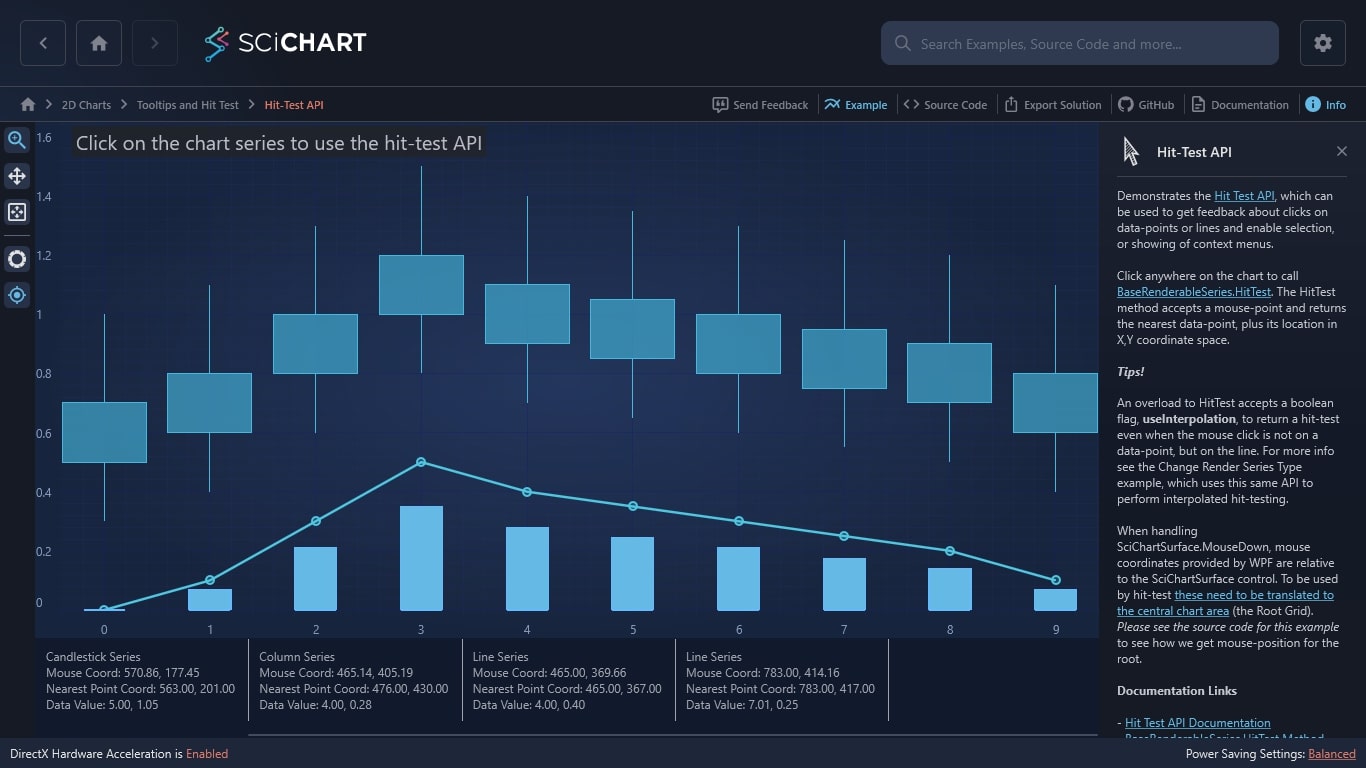
Demonstrates the Hit Test API, which can be used to get feedback about clicks on data-points or lines and enable selection, or showing of context menus.
Click anywhere on the chart to call BaseRenderableSeries.HitTest. The HitTest method accepts a mouse-point and returns the nearest data-point, plus its location in X,Y coordinate space.
Tips!
An overload to HitTest accepts a boolean flag, useInterpolation, to return a hit-test even when the mouse click is not on a data-point, but on the line. For more info see the Change Render Series Type example, which uses this same API to perform interpolated hit-testing.
When handling SciChartSurface.MouseDown, mouse coordinates provided by WPF are relative to the SciChartSurface control. To be used by hit-test these need to be translated to the central chart area (the Root Grid). Please see the source code for this example to see how we get mouse-position for the root.
Documentation Links
– Hit Test API Documentation
– BaseRenderableSeries.HitTest Method

The C#/WPF source code for the WPF Chart Hit-Test API example is included below (Scroll down!).
Did you know you can also view the source code from one of the following sources as well?
- Clone the SciChart.WPF.Examples from Github.
- Or, view source in the SciChart WPF Examples suite.
- Also the SciChart WPF Trial contains the full source for the examples (link below).
