SciChart® the market leader in Fast WPF Charts, WPF 3D Charts, iOS Chart, Android Chart and JavaScript Chart Components
SciChart WPF ships with hundreds of WPF Chart Examples which you can browse, play with, view the source-code and even export each WPF Chart Example to a stand-alone Visual Studio solution. All of this is possible with the new and improved SciChart WPF Examples Suite, which ships as part of the SciChart WPF SDK.
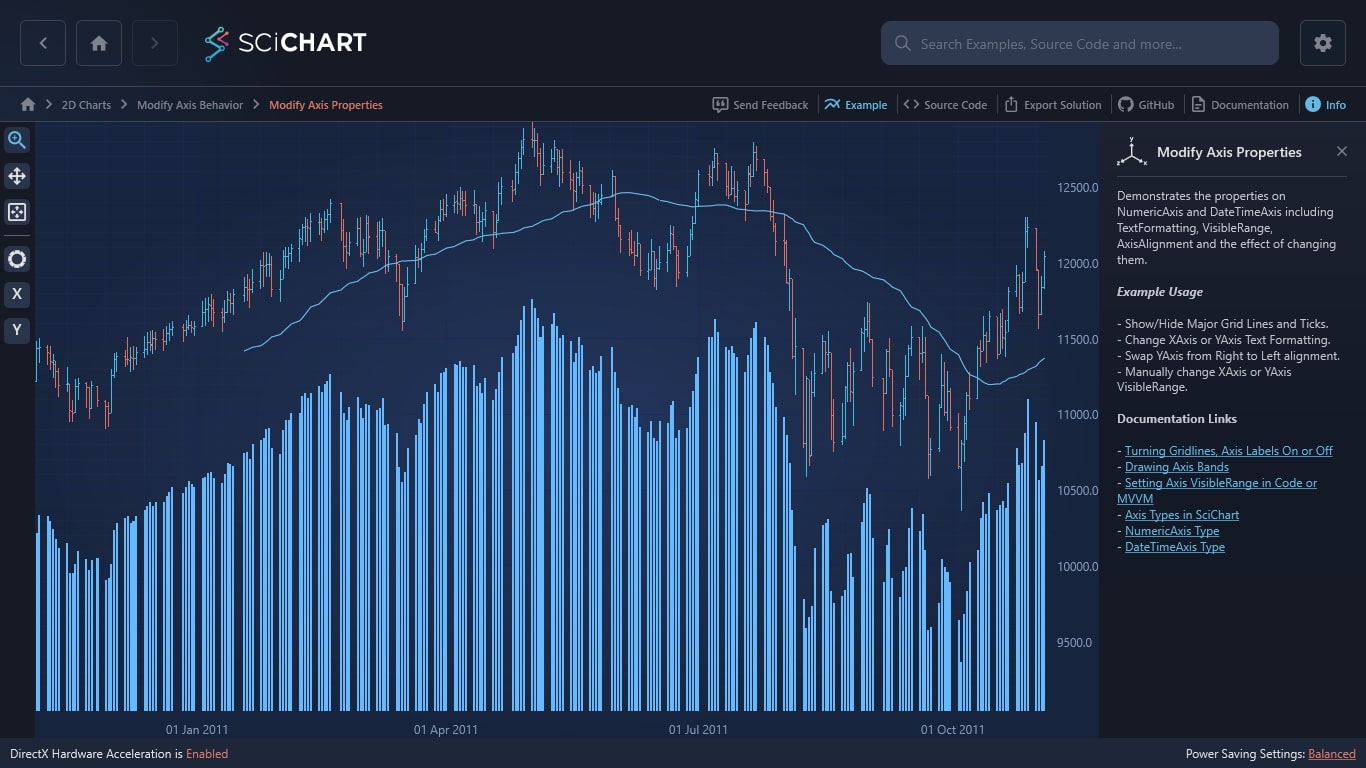
Demonstrates the properties on NumericAxis and DateTimeAxis including TextFormatting, VisibleRange, AxisAlignment and the effect of changing them.
Example Usage
– Show/Hide Major Grid Lines and Ticks.
– Change XAxis or YAxis Text Formatting.
– Swap YAxis from Right to Left alignment.
– Manually change XAxis or YAxis VisibleRange.
Documentation Links
– Turning Gridlines, Axis Labels On or Off
– Drawing Axis Bands
– Setting Axis VisibleRange in Code or MVVM
– Axis Types in SciChart
– NumericAxis Type
– DateTimeAxis Type
The C#/WPF source code for the WPF Stock Chart Control example is included below (Scroll down!).
Did you know you can also view the source code from one of the following sources as well?
<UserControl x:Class="SciChart.Examples.Examples.ModifyAxisBehaviour.ModifyAxisProperties"
xmlns="http://schemas.microsoft.com/winfx/2006/xaml/presentation"
xmlns:x="http://schemas.microsoft.com/winfx/2006/xaml"
xmlns:d="http://schemas.microsoft.com/expression/blend/2008"
xmlns:ext="http://schemas.abtsoftware.co.uk/scichart/exampleExternals"
xmlns:local="clr-namespace:SciChart.Examples.Examples.ModifyAxisBehaviour"
xmlns:mc="http://schemas.openxmlformats.org/markup-compatibility/2006"
xmlns:s="http://schemas.abtsoftware.co.uk/scichart"
Loaded="ModifyAxisPropertiesLoaded"
d:DesignHeight="400"
d:DesignWidth="600"
mc:Ignorable="d">
<UserControl.Resources>
<ResourceDictionary>
<ResourceDictionary.MergedDictionaries>
<ResourceDictionary Source="/SciChart.Examples.ExternalDependencies;component/Resources/Styles/ToggleButtonNew.xaml" />
<ResourceDictionary Source="/SciChart.Examples.ExternalDependencies;component/Resources/Styles/ButtonNew.xaml" />
</ResourceDictionary.MergedDictionaries>
</ResourceDictionary>
</UserControl.Resources>
<Grid x:Name="grid">
<Grid.Resources>
<Style x:Key="TextBoxStyle" TargetType="TextBox">
<Setter Property="FontSize" Value="12" />
<Setter Property="FontFamily" Value="Segoe UI Semibold" />
<Setter Property="Foreground" Value="#FFF" />
<Setter Property="Background" Value="#FF323539" />
<Setter Property="BorderBrush" Value="#FF5B5B5B" />
<Setter Property="BorderThickness" Value="1" />
</Style>
<ext:ToValidDateTimeConverter x:Key="ToValidDateTimeConverter" />
<ext:ValidateDateFormatStringConverter x:Key="validateTextFormattingConveter" />
<Style TargetType="{x:Type DatePickerTextBox}">
<Setter Property="Control.Template">
<Setter.Value>
<ControlTemplate>
<TextBox x:Name="PART_TextBox"
MaxLength="30"
Style="{StaticResource TextBoxStyle}"
Text="{Binding Text, RelativeSource={RelativeSource AncestorType={x:Type DatePicker}}}" />
</ControlTemplate>
</Setter.Value>
</Setter>
</Style>
</Grid.Resources>
<Grid.ColumnDefinitions>
<ColumnDefinition Width="Auto" />
<ColumnDefinition Width="*" />
</Grid.ColumnDefinitions>
<!-- ******************************************************* -->
<!-- Ignore below here: Controls to modify the Axis Behavior -->
<!-- ******************************************************* -->
<ext:SciChartInteractionToolbar x:Name="UserToolbar" TargetSurface="{Binding Source={x:Reference Name=sciChart}}">
<ext:FlyoutMenuButton HorizontalAlignment="Left"
Content="XAxis Controls"
Padding="0"
Style="{StaticResource FlyoutMenuButtonStyle}"
ToolTipService.ToolTip="XAxis Controls">
<ext:FlyoutMenuButton.PopupContent>
<StackPanel MinWidth="150" Orientation="Vertical">
<TextBlock Text="XAxis Controls" />
<CheckBox Margin="3"
Content="Draw Axis Bands"
IsChecked="{Binding Source={x:Reference Name=xAxis}, Path=DrawMajorBands, Mode=TwoWay}" />
<CheckBox Margin="3"
Content="Draw Major Gridlines"
IsChecked="{Binding Source={x:Reference Name=xAxis}, Path=DrawMajorGridLines, Mode=TwoWay}" />
<CheckBox Margin="3"
Content="Draw Minor GridLines"
IsChecked="{Binding Source={x:Reference Name=xAxis}, Path=DrawMinorGridLines, Mode=TwoWay}" />
<CheckBox Margin="3"
Content="Draw Major Ticks"
IsChecked="{Binding Source={x:Reference Name=xAxis}, Path=DrawMajorTicks, Mode=TwoWay}" />
<CheckBox Margin="3"
Content="Draw Minor Ticks"
IsChecked="{Binding Source={x:Reference Name=xAxis}, Path=DrawMinorTicks, Mode=TwoWay}" />
<CheckBox Margin="3"
Content="Draw Labels"
IsChecked="{Binding Source={x:Reference Name=xAxis}, Path=DrawLabels, Mode=TwoWay}" />
<ext:FlyoutSeparator />
<TextBlock Text="Text Formatting: " />
<TextBox Margin="3"
Style="{StaticResource TextBoxStyle}"
Text="{Binding Source={x:Reference Name=xAxis}, Path=TextFormatting, Mode=TwoWay, Converter={StaticResource validateTextFormattingConveter}, UpdateSourceTrigger=PropertyChanged}" />
<ext:FlyoutSeparator />
<TextBlock Text="Visible Range Min" />
<local:CompatibleDatePicker x:Name="minDatePicker"
BorderBrush="#FF5B5B5B"
BorderThickness="0"
SelectedDate="{Binding Source={x:Reference Name=xAxis}, Path=VisibleRange.Min, Mode=TwoWay, Converter={StaticResource ToValidDateTimeConverter}, ConverterParameter=Min}" />
<ext:FlyoutSeparator />
<TextBlock Text="Visible Range Max" />
<local:CompatibleDatePicker x:Name="maxDatePicker"
BorderBrush="#FF5B5B5B"
BorderThickness="0"
SelectedDate="{Binding Source={x:Reference Name=xAxis}, Path=VisibleRange.Max, Mode=TwoWay, Converter={StaticResource ToValidDateTimeConverter}, ConverterParameter=Max}" />
</StackPanel>
</ext:FlyoutMenuButton.PopupContent>
</ext:FlyoutMenuButton>
<ext:FlyoutMenuButton HorizontalAlignment="Left"
Content="YAxis Controls"
Padding="0"
Style="{StaticResource FlyoutMenuButtonStyle}"
ToolTipService.ToolTip="YAxis Controls">
<ext:FlyoutMenuButton.PopupContent>
<StackPanel MinWidth="150" Orientation="Vertical">
<TextBlock Text="YAxis Controls" />
<CheckBox Margin="3"
Content="Draw Axis Bands"
IsChecked="{Binding Source={x:Reference Name=yAxis}, Path=DrawMajorBands, Mode=TwoWay}" />
<CheckBox Margin="3"
Content="Draw Major Gridlines"
IsChecked="{Binding Source={x:Reference Name=yAxis}, Path=DrawMajorGridLines, Mode=TwoWay}" />
<CheckBox Margin="3"
Content="Draw Minor GridLines"
IsChecked="{Binding Source={x:Reference Name=yAxis}, Path=DrawMinorGridLines, Mode=TwoWay}" />
<CheckBox Margin="3"
Content="Draw Major Ticks"
IsChecked="{Binding Source={x:Reference Name=yAxis}, Path=DrawMajorTicks, Mode=TwoWay}" />
<CheckBox Margin="3"
Content="Draw Minor Ticks"
IsChecked="{Binding Source={x:Reference Name=yAxis}, Path=DrawMinorTicks, Mode=TwoWay}" />
<CheckBox Margin="3"
Content="Draw Labels"
IsChecked="{Binding Source={x:Reference Name=yAxis}, Path=DrawLabels, Mode=TwoWay}" />
<ext:FlyoutSeparator />
<TextBlock Text="Text Formatting: " />
<TextBox Margin="3"
Style="{StaticResource TextBoxStyle}"
Text="{Binding Source={x:Reference Name=yAxis}, Path=TextFormatting, Mode=TwoWay, UpdateSourceTrigger=PropertyChanged}" />
<ext:FlyoutSeparator />
<TextBlock Text="Axis Alignment: " />
<ComboBox x:Name="cboAlignment"
Margin="3"
SelectedItem="{Binding Source={x:Reference Name=yAxis}, Path=AxisAlignment, Mode=TwoWay}" />
<ext:FlyoutSeparator />
<TextBlock Text="VisibleRange.Min" />
<TextBox x:Name="minValueTb"
Margin="3"
LostFocus="OnMinYAxesChanged"
Style="{StaticResource TextBoxStyle}"
Text="{Binding Source={x:Reference Name=yAxis}, Path=VisibleRange.Min, Mode=OneWay}" />
<ext:FlyoutSeparator />
<TextBlock Text="VisibleRange.Max" />
<TextBox x:Name="maxValueTb"
Margin="3"
LostFocus="OnMaxYAxesChanged"
Style="{StaticResource TextBoxStyle}"
Text="{Binding Source={x:Reference Name=yAxis}, Path=VisibleRange.Max, Mode=OneWay}" />
</StackPanel>
</ext:FlyoutMenuButton.PopupContent>
</ext:FlyoutMenuButton>
</ext:SciChartInteractionToolbar>
<s:SciChartSurface x:Name="sciChart" Grid.Column="1">
<!-- Add a DateTime XAxis -->
<s:SciChartSurface.XAxis>
<s:DateTimeAxis x:Name="xAxis" VisibleRangeChanged="OnXVisibleRangeChanged" />
</s:SciChartSurface.XAxis>
<!-- Add two YAxes, to display price and volume data -->
<s:SciChartSurface.YAxis>
<s:NumericAxis x:Name="yAxis"
AxisAlignment="Right"
GrowBy="-0.7,0"
TextFormatting="#.0" />
</s:SciChartSurface.YAxis>
<!-- Add some sample RenderableSeries. Each theme has a default style for these -->
<s:SciChartSurface.RenderableSeries>
<s:FastColumnRenderableSeries x:Name="columnSeries" YAxisId="{Binding Source={x:Reference Name=yAxis}, Path=Id, Mode=TwoWay}" />
<s:FastOhlcRenderableSeries x:Name="ohlcSeries" YAxisId="{Binding Source={x:Reference Name=yAxis}, Path=Id, Mode=TwoWay}" />
<s:FastLineRenderableSeries x:Name="lineSeries" YAxisId="{Binding Source={x:Reference Name=yAxis}, Path=Id, Mode=TwoWay}" />
</s:SciChartSurface.RenderableSeries>
<!-- Add some modifiers to zoom, zoom extents -->
<s:SciChartSurface.ChartModifier>
<s:ModifierGroup>
<s:RubberBandXyZoomModifier />
<s:ZoomExtentsModifier ExecuteOn="MouseDoubleClick" />
</s:ModifierGroup>
</s:SciChartSurface.ChartModifier>
</s:SciChartSurface>
</Grid>
</UserControl>
// *************************************************************************************
// SCICHART® Copyright SciChart Ltd. 2011-2022. All rights reserved.
//
// Web: http://www.scichart.com
// Support: support@scichart.com
// Sales: sales@scichart.com
//
// ModifyAxisProperties.xaml.cs is part of the SCICHART® Examples. Permission is hereby granted
// to modify, create derivative works, distribute and publish any part of this source
// code whether for commercial, private or personal use.
//
// The SCICHART® examples are distributed in the hope that they will be useful, but
// without any warranty. It is provided "AS IS" without warranty of any kind, either
// expressed or implied.
// *************************************************************************************
using System;
using System.Globalization;
using System.Windows;
using System.Windows.Controls;
using SciChart.Charting.Model.DataSeries;
using SciChart.Charting.Visuals.Axes;
using SciChart.Charting.Visuals.Events;
using SciChart.Data.Model;
using SciChart.Examples.ExternalDependencies.Common;
using SciChart.Examples.ExternalDependencies.Data;
namespace SciChart.Examples.Examples.ModifyAxisBehaviour
{
public partial class ModifyAxisProperties : UserControl
{
public ModifyAxisProperties()
{
InitializeComponent();
cboAlignment.Items.Add(AxisAlignment.Right);
cboAlignment.Items.Add(AxisAlignment.Left);
}
public void ModifyAxisPropertiesLoaded(object sender, EventArgs e)
{
using (sciChart.SuspendUpdates())
{
// Add a data series
var dataSeries0 = new XyDataSeries<DateTime, double>();
var dataSeries1 = new OhlcDataSeries<DateTime, double>();
var dataSeries2 = new XyDataSeries<DateTime, double>();
var dataSource = DataManager.Instance;
// Prices are in the format Time, Open, High, Low, Close (all IList)
var prices = dataSource.GetPriceData(Instrument.Indu.Value, TimeFrame.Daily);
// Append data to series.
dataSeries0.Append(prices.TimeData, dataSource.Offset(prices.LowData, -1000));
dataSeries1.Append(prices.TimeData, prices.OpenData, prices.HighData, prices.LowData, prices.CloseData);
dataSeries2.Append(prices.TimeData, dataSource.ComputeMovingAverage(prices.CloseData, 50));
columnSeries.DataSeries = dataSeries0;
ohlcSeries.DataSeries = dataSeries1;
lineSeries.DataSeries = dataSeries2;
sciChart.ZoomExtents();
}
}
private void OnMinYAxesChanged(object sender, RoutedEventArgs e)
{
double value;
var isPositiveDouble = double.TryParse((sender as TextBox).Text, NumberStyles.Float, CultureInfo.InvariantCulture, out value) && value >= 0;
if (!SetVisibleRange(yAxis, isPositiveDouble ? value : yAxis.VisibleRange.Min, yAxis.VisibleRange.Max))
{
minValueTb.Text = yAxis.VisibleRange.Min.ToString();
}
}
private void OnMaxYAxesChanged(object sender, RoutedEventArgs e)
{
double value;
var isDouble = double.TryParse((sender as TextBox).Text, NumberStyles.Float, CultureInfo.InvariantCulture, out value) && value >= 0;
if (!SetVisibleRange(yAxis, yAxis.VisibleRange.Min, isDouble ? value : yAxis.VisibleRange.Max))
{
maxValueTb.Text = yAxis.VisibleRange.Max.ToString();
}
}
private bool SetVisibleRange(IAxis axis, IComparable min, IComparable max)
{
if (CheckVisibleRange(min, max))
{
axis.VisibleRange = RangeFactory.NewWithMinMax(axis.VisibleRange, min, max);
return true;
}
return false;
}
private bool CheckVisibleRange(IComparable min, IComparable max)
{
return min.CompareTo(max) < 0;
}
private void OnXVisibleRangeChanged(object sender, VisibleRangeChangedEventArgs e)
{
((ToValidDateTimeConverter)grid.Resources["ToValidDateTimeConverter"]).XVisibleRange = (DateRange)xAxis.VisibleRange;
}
}
}