SciChart® the market leader in Fast WPF Charts, WPF 3D Charts, iOS Chart, Android Chart and JavaScript Chart Components
SciChart WPF ships with hundreds of WPF Chart Examples which you can browse, play with, view the source-code and even export each WPF Chart Example to a stand-alone Visual Studio solution. All of this is possible with the new and improved SciChart WPF Examples Suite, which ships as part of the SciChart WPF SDK.
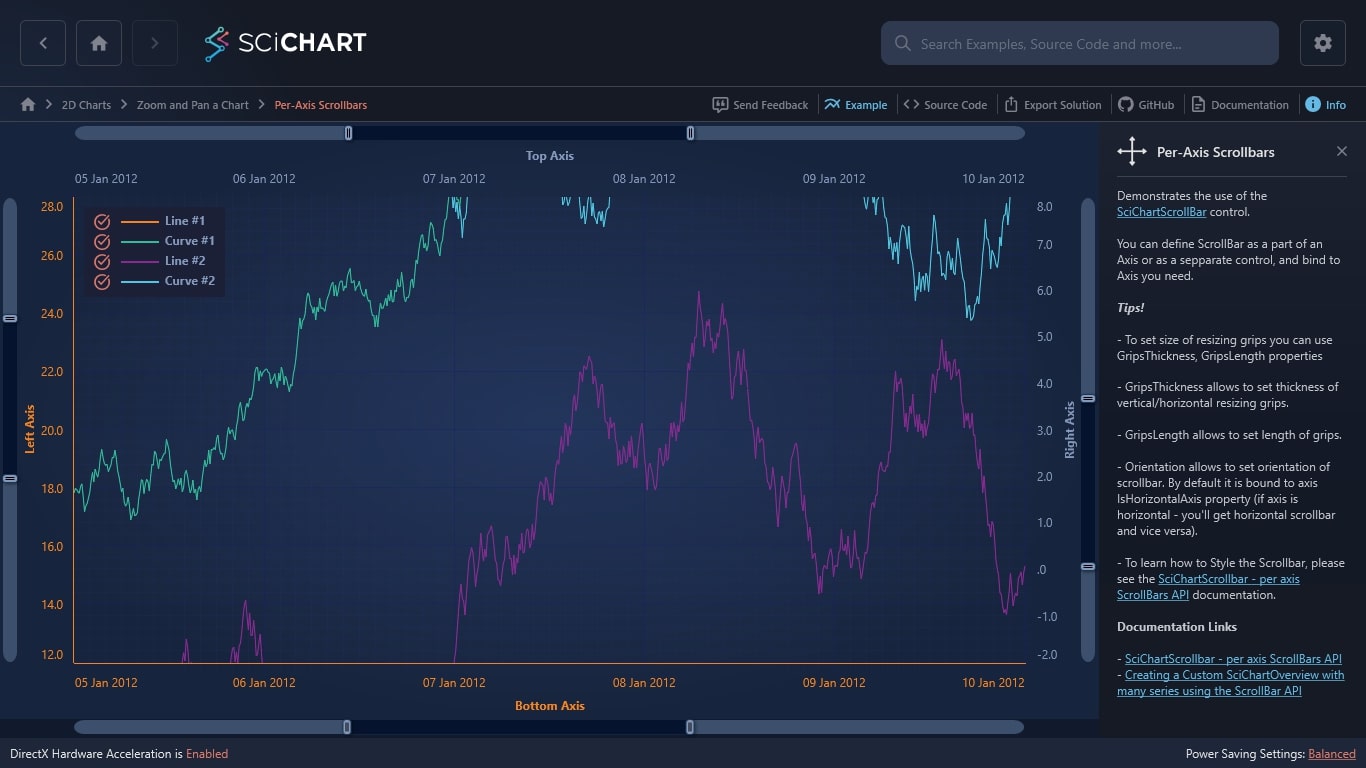
Demonstrates the use of the SciChartScrollBar control.
You can define ScrollBar as a part of an Axis or as a sepparate control, and bind to Axis you need.
Tips!
– To set size of resizing grips you can use GripsThickness, GripsLength properties
– GripsThickness allows to set thickness of vertical/horizontal resizing grips.
– GripsLength allows to set length of grips.
– Orientation allows to set orientation of scrollbar. By default it is bound to axis IsHorizontalAxis property (if axis is horizontal – you’ll get horizontal scrollbar and vice versa).
– To learn how to Style the Scrollbar, please see the SciChartScrollbar – per axis ScrollBars API documentation.
Documentation Links
– SciChartScrollbar – per axis ScrollBars API
– Creating a Custom SciChartOverview with many series using the ScrollBar API
The C#/WPF source code for the WPF Chart Per-Axis Scrollbars example is included below (Scroll down!).
Did you know you can also view the source code from one of the following sources as well?
<UserControl x:Class="SciChart.Examples.Examples.ZoomAndPanAChart.ScrollBars"
xmlns="http://schemas.microsoft.com/winfx/2006/xaml/presentation"
xmlns:x="http://schemas.microsoft.com/winfx/2006/xaml"
xmlns:s="http://schemas.abtsoftware.co.uk/scichart"
Loaded="ScrollBarsLoaded"
xmlns:d="http://schemas.microsoft.com/expression/blend/2008"
xmlns:mc="http://schemas.openxmlformats.org/markup-compatibility/2006"
d:DesignHeight="400"
d:DesignWidth="600"
mc:Ignorable="d">
<Grid >
<Grid.RowDefinitions>
<RowDefinition Height="*" />
<RowDefinition Height="Auto" />
</Grid.RowDefinitions>
<!-- Create the chart surface -->
<s:SciChartSurface Name="sciChart" Grid.Row="0">
<!-- Declare RenderableSeries and assign to Y-Axis -->
<s:SciChartSurface.RenderableSeries>
<s:FastLineRenderableSeries x:Name="bottomLeftLine"
Stroke="#c04d4d"
StrokeThickness="1"
XAxisId="BottomAxisId"
YAxisId="LeftAxisId" />
<s:FastLineRenderableSeries x:Name="bottomLeftCurve"
Stroke="#dfa239"
StrokeThickness="1"
XAxisId="BottomAxisId"
YAxisId="LeftAxisId" />
<s:FastLineRenderableSeries x:Name="topRightLine"
Stroke="#FFB3E8F6"
StrokeThickness="1"
XAxisId="TopAxisId"
YAxisId="RightAxisId" />
<s:FastLineRenderableSeries x:Name="topRightCurve"
Stroke="#6495ed"
StrokeThickness="1"
XAxisId="TopAxisId"
YAxisId="RightAxisId" />
</s:SciChartSurface.RenderableSeries>
<!-- Create an X Axis -->
<s:SciChartSurface.XAxes>
<s:DateTimeAxis x:Name="BottomAxis"
AxisAlignment="Bottom"
AxisTitle="Bottom Axis"
BorderBrush="#FFE26565"
BorderThickness="0,1,0,0"
Id="BottomAxisId"
TickTextBrush="#FFE26565" />
<s:DateTimeAxis AxisAlignment="Top"
AxisTitle="Top Axis"
BorderThickness="0,0,0,1"
Id="TopAxisId">
<s:DateTimeAxis.Scrollbar>
<s:SciChartScrollbar Margin="0 3 0 0" />
</s:DateTimeAxis.Scrollbar>
</s:DateTimeAxis>
</s:SciChartSurface.XAxes>
<!-- Create Y Axes on the Left and Right. Optional bands give a cool look and feel for minimal performance impact -->
<s:SciChartSurface.YAxes>
<s:NumericAxis AxisAlignment="Left"
AxisTitle="Left Axis"
BorderBrush="#FFE26565"
BorderThickness="0,0,1,0"
DrawMajorBands="True"
GrowBy="0.05, 0.05"
Id="LeftAxisId"
TextFormatting="#.0"
TickTextBrush="#FFE26565">
<s:NumericAxis.Scrollbar>
<s:SciChartScrollbar Margin="3 0 0 0" />
</s:NumericAxis.Scrollbar>
</s:NumericAxis>
<s:NumericAxis AxisAlignment="Right"
AxisTitle="Right Axis"
BorderThickness="1,0,0,0"
GrowBy="0.05, 0.05"
Id="RightAxisId"
TextFormatting="#.0">
<s:NumericAxis.Scrollbar>
<s:SciChartScrollbar Margin="0 0 3 0" />
</s:NumericAxis.Scrollbar>
</s:NumericAxis>
</s:SciChartSurface.YAxes>
<!-- Create chart modifiers to zoom, pan and double click to zoom extents -->
<s:SciChartSurface.ChartModifier>
<s:ModifierGroup>
<s:RubberBandXyZoomModifier IsXAxisOnly="True" />
<s:ZoomPanModifier ExecuteOn="MouseRightButton" />
<s:ZoomExtentsModifier ExecuteOn="MouseDoubleClick" />
<s:LegendModifier Margin="10"
GetLegendDataFor="AllSeries"
ShowLegend="True" />
<s:YAxisDragModifier/>
<s:XAxisDragModifier/>
</s:ModifierGroup>
</s:SciChartSurface.ChartModifier>
</s:SciChartSurface>
<Grid Grid.Row="1" Background="#FF1C1C1E">
<s:SciChartScrollbar Width="{Binding Source={x:Reference Name=BottomAxis}, Path=ActualWidth}"
Margin="0,0,0,3"
Axis="{Binding Source={x:Reference Name=BottomAxis}}" />
</Grid>
</Grid>
</UserControl>
// *************************************************************************************
// SCICHART® Copyright SciChart Ltd. 2011-2022. All rights reserved.
//
// Web: http://www.scichart.com
// Support: support@scichart.com
// Sales: sales@scichart.com
//
// ScrollBars.xaml.cs is part of the SCICHART® Examples. Permission is hereby granted
// to modify, create derivative works, distribute and publish any part of this source
// code whether for commercial, private or personal use.
//
// The SCICHART® examples are distributed in the hope that they will be useful, but
// without any warranty. It is provided "AS IS" without warranty of any kind, either
// expressed or implied.
// *************************************************************************************
using System;
using System.Windows;
using System.Windows.Controls;
using SciChart.Charting.Model.DataSeries;
using SciChart.Data.Model;
namespace SciChart.Examples.Examples.ZoomAndPanAChart
{
/// <summary>
/// Interaction logic for ScrollBars.xaml
/// </summary>
public partial class ScrollBars : UserControl
{
// Used to generate Random Walk
private Random _random = new Random(251916);
const int Count = 2000;
public ScrollBars()
{
InitializeComponent();
}
private void ScrollBarsLoaded(object sender, RoutedEventArgs e)
{
// Batch updates with one redraw
using (sciChart.SuspendUpdates())
{
// Add four data-series
var dataSeries0 = new XyDataSeries<DateTime, double>();
var dataSeries1 = new XyDataSeries<DateTime, double>();
var dataSeries2 = new XyDataSeries<DateTime, double>();
var dataSeries3 = new XyDataSeries<DateTime, double>();
// Fill each dataset with 2,000 pts of X,Y values (Date,Double)
// and ensure RenderableSeries has its datasource
bottomLeftLine.DataSeries = FillData(dataSeries0, "Line #1");
bottomLeftCurve.DataSeries = FillData(dataSeries1, "Curve #1");
topRightLine.DataSeries = FillData(dataSeries2, "Line #2");
topRightCurve.DataSeries = FillData(dataSeries3, "Curve #2");
// Set Visible ranges to force scrollBars
sciChart.YAxes[0].VisibleRange = new DoubleRange(12, 28);
sciChart.YAxes[1].VisibleRange = new DoubleRange(-2, 8);
sciChart.XAxes[0].VisibleRange = new DateRange(new DateTime(2012, 1, 5), new DateTime(2012, 1, 10));
sciChart.XAxes[1].VisibleRange = new DateRange(new DateTime(2012, 1, 5), new DateTime(2012, 1, 10));
}
}
private IDataSeries FillData(IXyDataSeries<DateTime, double> dataSeries, string name)
{
double randomWalk = 10.0;
var startDate = new DateTime(2012, 01, 01);
// Generate the X,Y data with sequential dates on the X-Axis and slightly positively biased random walk on the Y-Axis
var xBuffer = new DateTime[Count];
var yBuffer = new double[Count];
for (int i = 0; i < Count; i++)
{
randomWalk += (_random.NextDouble() - 0.498);
yBuffer[i] = randomWalk;
xBuffer[i] = startDate.AddMinutes(i * 10);
}
// Buffer above and append all in one go to avoid multiple recalculations of series range
dataSeries.Append(xBuffer, yBuffer);
dataSeries.SeriesName = name;
return dataSeries;
}
}
}