SciChart® the market leader in Fast WPF Charts, WPF 3D Charts, iOS Chart, Android Chart and JavaScript Chart Components
SciChart WPF ships with hundreds of WPF Chart Examples which you can browse, play with, view the source-code and even export each WPF Chart Example to a stand-alone Visual Studio solution. All of this is possible with the new and improved SciChart WPF Examples Suite, which ships as part of the SciChart WPF SDK.
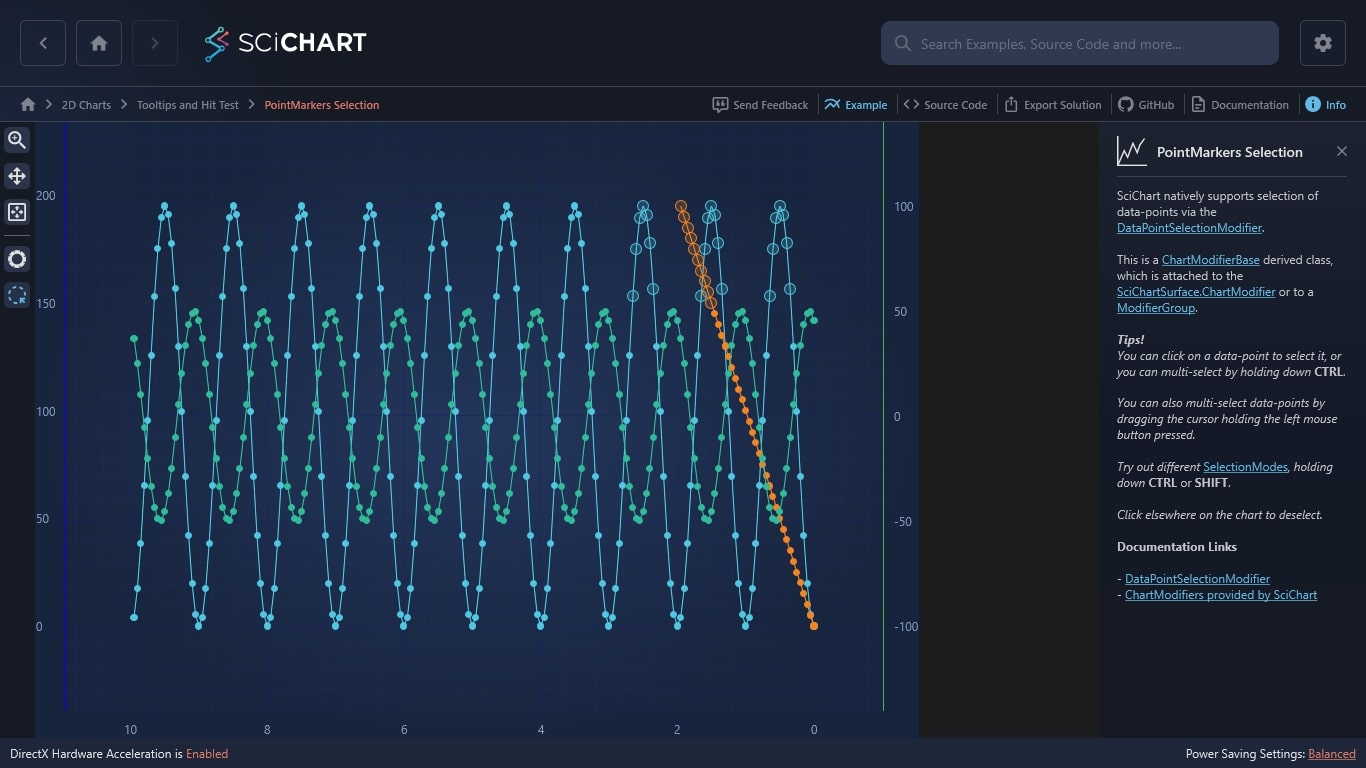
SciChart natively supports selection of data-points via the DataPointSelectionModifier.
This is a ChartModifierBase derived class, which is attached to the SciChartSurface.ChartModifier or to a ModifierGroup.
Tips!
You can click on a data-point to select it, or you can multi-select by holding down CTRL.
You can also multi-select data-points by dragging the cursor holding the left mouse button pressed.
Try out different SelectionModes, holding down CTRL or SHIFT.
Click elsewhere on the chart to deselect.
Documentation Links
– DataPointSelectionModifier
– ChartModifiers provided by SciChart
The C#/WPF source code for the WPF Chart Data-Point Selection example is included below (Scroll down!).
Did you know you can also view the source code from one of the following sources as well?
<UserControl x:Class="SciChart.Examples.Examples.CreateSimpleChart.PointMarkersSelectionExampleView"
xmlns="http://schemas.microsoft.com/winfx/2006/xaml/presentation"
xmlns:x="http://schemas.microsoft.com/winfx/2006/xaml"
xmlns:d="http://schemas.microsoft.com/expression/blend/2008"
xmlns:ext="http://schemas.abtsoftware.co.uk/scichart/exampleExternals"
xmlns:mc="http://schemas.openxmlformats.org/markup-compatibility/2006"
xmlns:s="http://schemas.abtsoftware.co.uk/scichart"
Loaded="PointMarkersSelectionExampleView_OnLoaded"
d:DesignHeight="400"
d:DesignWidth="600"
mc:Ignorable="d">
<UserControl.Resources>
<ResourceDictionary>
<ResourceDictionary.MergedDictionaries>
<ResourceDictionary
Source="/SciChart.Examples.ExternalDependencies;component/Resources/Styles/ToolbarButtonsCommon.xaml" />
</ResourceDictionary.MergedDictionaries>
<s:ColorToBrushConverter x:Key="ColorToBrushConverter" />
</ResourceDictionary>
</UserControl.Resources>
<Grid>
<Grid.ColumnDefinitions>
<ColumnDefinition Width="Auto" />
<ColumnDefinition Width="*" />
<ColumnDefinition Width="180" />
</Grid.ColumnDefinitions>
<!-- The SciChartInteractionToolbar adds zoom, pan, zoom extents and rotate functionality -->
<!-- to the chart and is included for example purposes. -->
<!-- If you wish to know how to zoom and pan a chart then do a search for Zoom Pan in the Examples suite! -->
<ext:SciChartInteractionToolbar TargetSurface="{Binding Source={x:Reference Name=sciChart}}" />
<!-- Create the chart surface -->
<s:SciChartSurface Name="sciChart"
Grid.Column="1">
<!-- Declare RenderableSeries -->
<s:SciChartSurface.RenderableSeries>
<s:FastLineRenderableSeries x:Name="lineRenderSeries1"
Stroke="#4AB748"
StrokeThickness="1"
YAxisId="Right">
<s:FastLineRenderableSeries.PointMarker>
<s:EllipsePointMarker Fill="#138A43" />
</s:FastLineRenderableSeries.PointMarker>
<s:FastLineRenderableSeries.SelectedPointMarker>
<s:EllipsePointMarker Fill="#C4ECA0"
Width="12"
Height="12" />
</s:FastLineRenderableSeries.SelectedPointMarker>
</s:FastLineRenderableSeries>
<s:FastLineRenderableSeries x:Name="lineRenderSeries2"
Stroke="Blue"
StrokeThickness="1"
YAxisId="Left">
<s:FastLineRenderableSeries.PointMarker>
<s:EllipsePointMarker Fill="Blue" />
</s:FastLineRenderableSeries.PointMarker>
<s:FastLineRenderableSeries.SelectedPointMarker>
<s:EllipsePointMarker Fill="CornflowerBlue"
Width="12"
Height="12" />
</s:FastLineRenderableSeries.SelectedPointMarker>
</s:FastLineRenderableSeries>
<s:FastLineRenderableSeries x:Name="lineRenderSeries3"
Stroke="Yellow"
StrokeThickness="1"
YAxisId="Right">
<s:FastLineRenderableSeries.PointMarker>
<s:EllipsePointMarker Fill="Yellow" />
</s:FastLineRenderableSeries.PointMarker>
<s:FastLineRenderableSeries.SelectedPointMarker>
<s:EllipsePointMarker Fill="YellowGreen"
Width="12"
Height="12" />
</s:FastLineRenderableSeries.SelectedPointMarker>
</s:FastLineRenderableSeries>
</s:SciChartSurface.RenderableSeries>
<!-- Create an X Axis with Growby -->
<s:SciChartSurface.XAxis>
<s:NumericAxis DrawMajorBands="True"
FlipCoordinates="True"
GrowBy="0.1, 0.1" />
</s:SciChartSurface.XAxis>
<!-- Create a Y Axis with GrowBy. Optional bands give a cool look and feel for minimal performance impact -->
<s:SciChartSurface.YAxes>
<s:NumericAxis DrawMajorBands="True" GrowBy="0.2, 0.2" Id="Right" BorderBrush="#4AB748" BorderThickness="1,0,0,0"/>
<s:NumericAxis DrawMajorBands="False" GrowBy="0.2, 0.2" Id="Left" AxisAlignment="Left" BorderBrush="Blue" BorderThickness="0,0,1,0"/>
</s:SciChartSurface.YAxes>
<!-- Setting IsEnabled enables or disables a modifier in the Toolbar -->
<s:SciChartSurface.ChartModifier>
<s:ModifierGroup>
<s:DataPointSelectionModifier Name="PointMarkersSelectionModifier"
IsEnabled="True"
SelectionFill="#B1B5B2B2"
SelectionStroke="#009E9C9C" />
<s:MouseWheelZoomModifier IsEnabled="True" />
<s:RubberBandXyZoomModifier IsEnabled="False" />
</s:ModifierGroup>
</s:SciChartSurface.ChartModifier>
</s:SciChartSurface>
<!-- The list of selected points -->
<Grid Grid.Column="2" Background="#1C1C1F">
<TextBlock Margin="10"
Text="Selected PointMarkers:"
Foreground="#C6C6C6" />
<ListBox ItemsSource="{Binding Source={x:Reference Name=PointMarkersSelectionModifier}, Path=SelectedPointMarkers}"
Foreground="#57A54A"
BorderBrush="Transparent"
Margin="5"
Background="#1C1C1F"
ScrollViewer.VerticalScrollBarVisibility="Auto"
ScrollViewer.HorizontalScrollBarVisibility="Auto">
<!-- Disable items selection in the listbox -->
<ListBox.ItemContainerStyle>
<Style TargetType="ListBoxItem">
<Setter Property="IsEnabled" Value="False"/>
</Style>
</ListBox.ItemContainerStyle>
<ItemsControl.ItemTemplate>
<DataTemplate DataType="s:DataPointInfo">
<StackPanel Orientation="Horizontal">
<TextBlock Foreground="{Binding RenderableSeries.Stroke, Converter={StaticResource ColorToBrushConverter}}" Text="{Binding DataSeriesName}"/>
<TextBlock Foreground="{Binding RenderableSeries.Stroke, Converter={StaticResource ColorToBrushConverter}}" Text="{Binding XValue, StringFormat=', X:{0:##0.##}'}"/>
<TextBlock Foreground="{Binding RenderableSeries.Stroke, Converter={StaticResource ColorToBrushConverter}}" Text="{Binding YValue, StringFormat=', Y:{0:##0.##}'}"/>
</StackPanel>
</DataTemplate>
</ItemsControl.ItemTemplate>
</ListBox>
</Grid>
</Grid>
</UserControl>
using System.ComponentModel;
using System.Linq;
using System.Windows;
using System.Windows.Controls;
using SciChart.Charting.Model.DataSeries;
using SciChart.Examples.ExternalDependencies.Data;
namespace SciChart.Examples.Examples.CreateSimpleChart
{
public class MyMetadata : IPointMetadata
{
public event PropertyChangedEventHandler PropertyChanged;
public bool IsSelected { get; set; }
}
public partial class PointMarkersSelectionExampleView : UserControl
{
public PointMarkersSelectionExampleView()
{
InitializeComponent();
}
private void PointMarkersSelectionExampleView_OnLoaded(object sender, RoutedEventArgs e)
{
// Create a DataSeries of type X=double, Y=double
var dataSeries1 = new UniformXyDataSeries<double>(0d, 0.05) { SeriesName = "Green" };
var dataSeries2 = new UniformXyDataSeries<double>(0d, 0.05) { SeriesName = "Blue" };
var dataSeries3 = new UniformXyDataSeries<double>(0d, 0.05) { SeriesName = "Yellow" };
// Attach DataSeries to RenderableSeries
lineRenderSeries1.DataSeries = dataSeries1;
lineRenderSeries2.DataSeries = dataSeries2;
lineRenderSeries3.DataSeries = dataSeries3;
// Generate data
var count = 200;
var data1 = DataManager.Instance.GetSinewaveYData(100, 55, count);
var data3 = DataManager.Instance.GetSinewaveYData(50, 20, count);
// Append data to series
using (sciChart.SuspendUpdates())
{
dataSeries1.Append(data1, Enumerable.Range(0, count).Select(i => new MyMetadata()));
dataSeries3.Append(data3, Enumerable.Range(0, count).Select(i => new MyMetadata()));
for (int i = 0; i < count; i += 4)
{
dataSeries2.Append(i++, new MyMetadata());
}
}
// Zoom out to the extents of data
sciChart.ZoomExtents();
}
}
}