SciChart® the market leader in Fast WPF Charts, WPF 3D Charts, iOS Chart, Android Chart and JavaScript Chart Components
SciChart WPF ships with hundreds of WPF Chart Examples which you can browse, play with, view the source-code and even export each WPF Chart Example to a stand-alone Visual Studio solution. All of this is possible with the new and improved SciChart WPF Examples Suite, which ships as part of the SciChart WPF SDK.
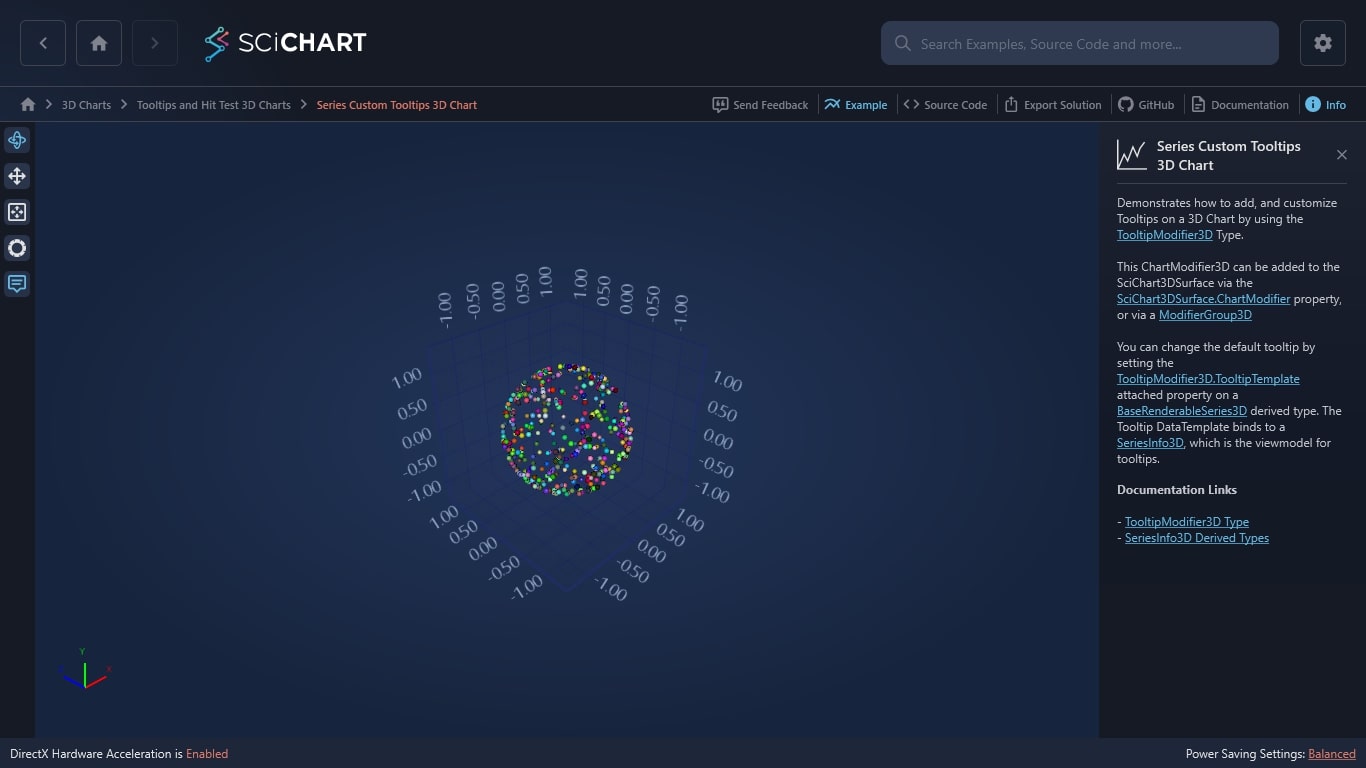
Demonstrates how to add, and customize Tooltips on a 3D Chart by using the TooltipModifier3D Type.
This ChartModifier3D can be added to the SciChart3DSurface via the SciChart3DSurface.ChartModifier property, or via a ModifierGroup3D
You can change the default tooltip by setting the TooltipModifier3D.TooltipTemplate attached property on a BaseRenderableSeries3D derived type. The Tooltip DataTemplate binds to a SeriesInfo3D, which is the viewmodel for tooltips.
Documentation Links
The C#/WPF source code for the WPF 3D Chart Custom Tooltip Template Example example is included below (Scroll down!).
Did you know you can also view the source code from one of the following sources as well?
<UserControl x:Class="SciChart.Examples.Examples.Charts3D.TooltipsAndHitTest3DCharts.SeriesCustomTooltips3DChart"
xmlns="http://schemas.microsoft.com/winfx/2006/xaml/presentation"
xmlns:x="http://schemas.microsoft.com/winfx/2006/xaml"
xmlns:ext="http://schemas.abtsoftware.co.uk/scichart/exampleExternals"
xmlns:s="http://schemas.abtsoftware.co.uk/scichart"
xmlns:s3D="http://schemas.abtsoftware.co.uk/scichart3D"
xmlns:cd="clr-namespace:SciChart.Charting3D.Model.ChartData;assembly=SciChart.Charting3D"
xmlns:t3D="clr-namespace:SciChart.Charting3D.Modifiers.Tooltip3D;assembly=SciChart.Charting3D">
<UserControl.Resources>
<DropShadowEffect x:Key="DropShadowEffect"
BlurRadius="5"
Direction="-45"
ShadowDepth="10"
Color="Black" />
<Style x:Key="TooltipStyle" TargetType="s:TooltipControl">
<Setter Property="Template">
<Setter.Value>
<ControlTemplate TargetType="s:TooltipControl">
<Border Background="#ff6495ed"
BorderBrush="#ff4d81dd"
BorderThickness="2"
Effect="{StaticResource DropShadowEffect}"
Opacity="0.9"
Padding="5">
<ContentPresenter Content="{TemplateBinding DataContext}" ContentTemplate="{TemplateBinding ContentTemplate}" />
</Border>
</ControlTemplate>
</Setter.Value>
</Setter>
</Style>
<DataTemplate x:Key="XyzSeriesTooltipTemplate" DataType="cd:BaseXyzSeriesInfo3D">
<StackPanel>
<TextBlock>
<Run FontWeight="Bold" Text="This is the Custom tooltip DataTemplate" />
</TextBlock>
<StackPanel Orientation="Vertical">
<TextBlock>
<Run FontWeight="Bold" Text="VertexId: " />
<Run Text="{Binding VertexId}" />
</TextBlock>
<TextBlock>
<Run FontWeight="Bold" Text="PointMetadata: " />
<Run Text="{Binding PointMetadata.Tag}" />
</TextBlock>
<TextBlock>
<Run FontWeight="Bold" Text="X: " />
<Run Text="{Binding FormattedXValue, Mode=OneWay}" />
</TextBlock>
<TextBlock>
<Run FontWeight="Bold" Text="Y: " />
<Run Text="{Binding FormattedYValue, Mode=OneWay}" />
</TextBlock>
<TextBlock>
<Run FontWeight="Bold" Text="Z: " />
<Run Text="{Binding FormattedZValue, Mode=OneWay}" />
</TextBlock>
</StackPanel>
</StackPanel>
</DataTemplate>
</UserControl.Resources>
<Grid>
<Grid.ColumnDefinitions>
<ColumnDefinition Width="Auto" />
<ColumnDefinition Width="*" />
</Grid.ColumnDefinitions>
<ext:SciChart3DInteractionToolbar Grid.Column="0" TargetSurface="{Binding Source={x:Reference Name=SciChart}}" />
<s3D:SciChart3DSurface x:Name="SciChart"
Grid.Column="1"
BorderThickness="0"
WorldDimensions="200,200,200">
<s3D:SciChart3DSurface.RenderableSeries>
<s3D:ScatterRenderableSeries3D t3D:TooltipModifier3D.TooltipContainerStyle="{StaticResource TooltipStyle}" t3D:TooltipModifier3D.TooltipTemplate="{StaticResource XyzSeriesTooltipTemplate}">
<s3D:ScatterRenderableSeries3D.PointMarker>
<s3D:SpherePointMarker3D Fill="#88ffffff" Size="2.0" />
</s3D:ScatterRenderableSeries3D.PointMarker>
</s3D:ScatterRenderableSeries3D>
</s3D:SciChart3DSurface.RenderableSeries>
<s3D:SciChart3DSurface.XAxis>
<s3D:NumericAxis3D GrowBy="0.2,0.2" VisibleRange="-1.1, 1.1" />
</s3D:SciChart3DSurface.XAxis>
<s3D:SciChart3DSurface.YAxis>
<s3D:NumericAxis3D GrowBy="0.2,0.2" VisibleRange="-1.1, 1.1" />
</s3D:SciChart3DSurface.YAxis>
<s3D:SciChart3DSurface.ZAxis>
<s3D:NumericAxis3D GrowBy="0.2,0.2" VisibleRange="-1.1, 1.1" />
</s3D:SciChart3DSurface.ZAxis>
<s3D:SciChart3DSurface.ChartModifier>
<s3D:ModifierGroup3D>
<s3D:OrbitModifier3D ExecuteOn="MouseLeftButton" IsEnabled="True" />
<s3D:FreeLookModifier3D ExecuteOn="MouseLeftButton" IsEnabled="False" />
<t3D:TooltipModifier3D HoverDelay="150" ShowTooltipOn="MouseOver" />
<s3D:MouseWheelZoomModifier3D />
<s3D:ZoomExtentsModifier3D AnimateDurationMs="500"
AutoFitRadius="True"
ResetPosition="-200, 100, -200" />
</s3D:ModifierGroup3D>
</s3D:SciChart3DSurface.ChartModifier>
</s3D:SciChart3DSurface>
</Grid>
</UserControl>
// *************************************************************************************
// SCICHART® Copyright SciChart Ltd. 2011-2022. All rights reserved.
//
// Web: http://www.scichart.com
// Support: support@scichart.com
// Sales: sales@scichart.com
//
// SeriesCustomTooltips3DChart.xaml.cs is part of the SCICHART® Examples. Permission is hereby granted
// to modify, create derivative works, distribute and publish any part of this source
// code whether for commercial, private or personal use.
//
// The SCICHART® examples are distributed in the hope that they will be useful, but
// without any warranty. It is provided "AS IS" without warranty of any kind, either
// expressed or implied.
// *************************************************************************************
using System;
using System.Windows.Controls;
using System.Windows.Media;
using SciChart.Charting3D.Model;
namespace SciChart.Examples.Examples.Charts3D.TooltipsAndHitTest3DCharts
{
/// <summary>
/// Interaction logic for SeriesCustomTooltips3DChart.xaml
/// </summary>
public partial class SeriesCustomTooltips3DChart : UserControl
{
private const int Count = 500;
private readonly Random _random = new Random();
public SeriesCustomTooltips3DChart()
{
InitializeComponent();
Loaded += (sender, args) =>
{
Initialize();
SciChart.ZoomExtents();
};
}
private void Initialize()
{
var xyzDataSeries3D = new XyzDataSeries3D<double>();
for (int i = 0, pointIndex = 0; i < Count; i++)
{
var m1 = _random.Next(2) == 0 ? -1 : 1;
var m2 = _random.Next(2) == 0 ? -1 : 1;
var x1 = _random.NextDouble() * m1;
var x2 = _random.NextDouble() * m2;
if (x1 * x1 + x2 * x2 > 1) continue;
var x = 2 * x1 * Math.Sqrt(1 - x1 * x1 - x2 * x2);
var y = 2 * x2 * Math.Sqrt(1 - x1 * x1 - x2 * x2);
var z = 1 - 2 * (x1 * x1 + x2 * x2);
// Append an XYZ Point with random color
// Set the PointMetadata.Tag which we bind to in the View
xyzDataSeries3D.Append(x, y, z, new PointMetadata3D(GetRandomColor(), 3.0f, false,
string.Format("PointMetadata Index {0}", ++pointIndex)));
}
SciChart.RenderableSeries[0].DataSeries = xyzDataSeries3D;
}
private Color GetRandomColor()
{
return Color.FromArgb(255, (byte)_random.Next(0, 255), (byte)_random.Next(0, 255),
(byte)_random.Next(0, 255));
}
}
}