WPF Chart - Examples
SciChart WPF ships with hundreds of WPF Chart Examples which you can browse, play with, view the source-code and even export each WPF Chart Example to a stand-alone Visual Studio solution. All of this is possible with the new and improved SciChart WPF Examples Suite, which ships as part of the SciChart WPF SDK.
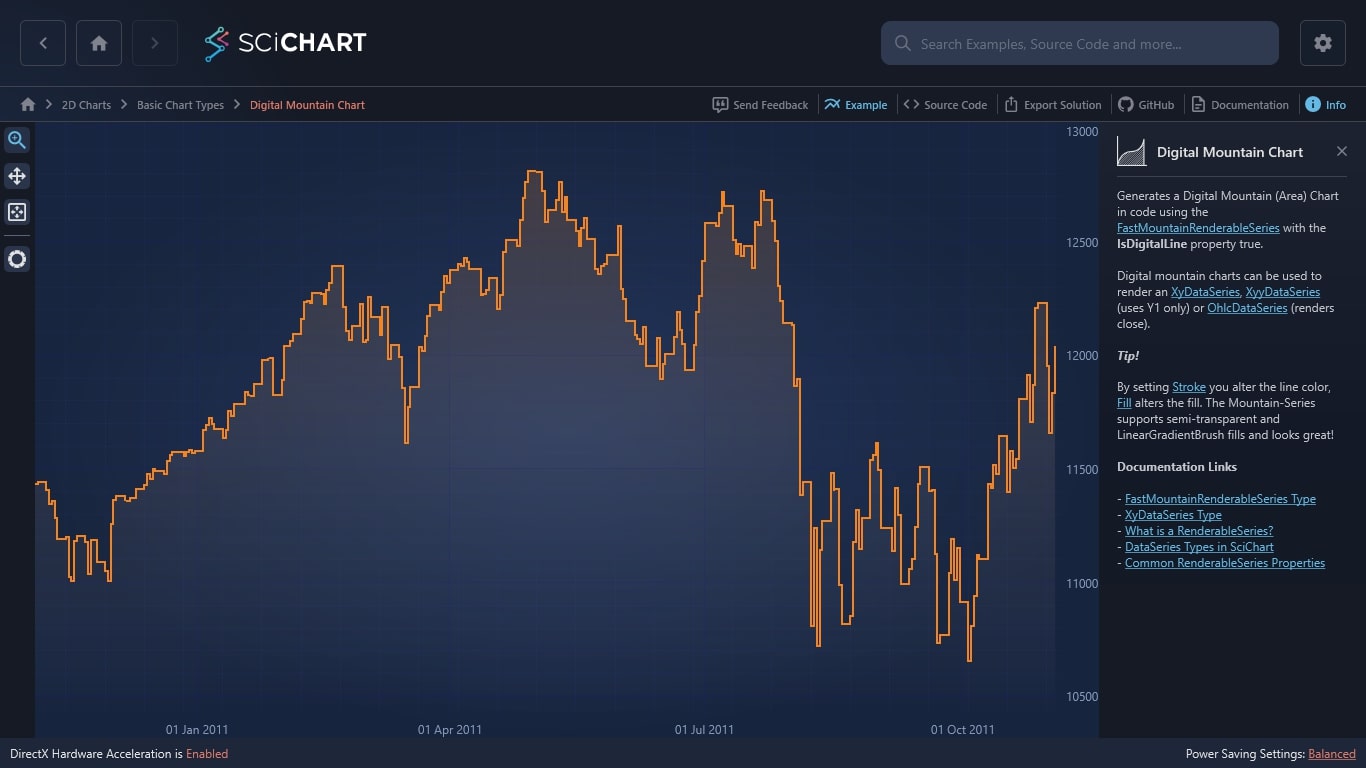
With our award-winning WPF chart software, you can easily generate WPF Digital Mountain Charts in code using the FastMountainRenderableSeries with the IsDigitalLine property true.
Digital mountain charts can be used to render an XyDataSeries, XyyDataSeries (uses Y1 only) or OhlcDataSeries (renders close).
Tip!
By setting Stroke you alter the line color, Fill alters the fill. The Mountain-Series supports semi-transparent and LinearGradientBrush fills and looks great!
Documentation Links
– FastMountainRenderableSeries Type
– XyDataSeries Type
– What is a RenderableSeries?
– DataSeries Types in SciChart
– Common RenderableSeries Properties
The C#/WPF source code for the WPF Digital Mountain Chart Example is included below.
You can also view the source code from one of the following sources:
- Clone the SciChart.WPF.Examples from Github.
- View source in the SciChart WPF Examples suite.
- SciChart WPF Trial contains the full source for the examples.
Download the WPF examples or begin your free trial today.
How to get started
Ready to get started with your free 30-day trial? Read our Getting Started guide:
- Begin your free trial
- Create charts with tutorials
- Compile example source code
- Access documentation
Start building your high performance data visualization dashboards and web applications with a free trial of SciChart.WPF. No credit card details required.
Get Started With Your Free Trial Today
Real-world, Big-data Use Cases
We understand the common pitfalls that developers and users of big-data charts encounter. Our aim has always been to provide the best possible data visualization enhancements so you can work smarter and deliver the best results. You’ll find our charts have been used by top companies across the globe for a wide range of use cases, including healthcare, research and finances.
Endless Customizations
Our software supports endless customization abilities so you can stay on-brand and create personalised data applications. With our Theme Manager, you can access our ready-prepared customizations allowing your developers to alter the colors of cursors, axis and more.
Why Use SciChart?
Since 2012, our team of WPF developers have been pioneering charts that are built with real-world, big-data applications in mind. We’re not only the world’s fastest WPF Chart Library, we’re also recognised for our world-class tech support, earning us a 98% customer recommendation rating and the Queen’s Award for Innovation.
- In-house GPU accelerated graphics engine
- Extensive features & customizations
- 5-star rated support for developers
- Winner of the Queen’s Award for Innovation
- 98% of customers recommend SciChart
Frequently Asked Questions
What tech support is available for developers?
We’re proud to offer 5-star rated support for developers. This includes quick responses to queries and access to thousands of online forum pages, examples and guides.
What does the WPF licence include?
With the WPF licence, you’ll have complete access to our WPF Chart Library. You’ll also have access to the full tech support. One licence is designed for one developer, but can be downloaded on multiple devices, which is useful for hybrid working developers.

The C#/WPF source code for the WPF Digital Mountain Chart example is included below (Scroll down!).
Did you know you can also view the source code from one of the following sources as well?
- Clone the SciChart.WPF.Examples from Github.
- Or, view source in the SciChart WPF Examples suite.
- Also the SciChart WPF Trial contains the full source for the examples (link below).
